

The Oral Wound Healing Potential of Thai Propolis Based on Its Antioxidant Activity and Stimulation of Oral Fibroblast Migration and Proliferation
- PMID: 35664934
- PMCID: PMC9162842
- DOI: 10.1155/2022/3503164
The Oral Wound Healing Potential of Thai Propolis Based on Its Antioxidant Activity and Stimulation of Oral Fibroblast Migration and Proliferation
Abstract
Introduction: Propolis has demonstrated wound healing effects. Propolis' effects vary based on its composition and geographical origin. However, there are few reports on the effects of propolis on oral wound healing. The aim of this study was to evaluate the antioxidant and in vitro gingival wound healing effects of the n-hexane extract of propolis (HEP), ethyl acetate extract of propolis (EEP), and aqueous extract of propolis (AEP) fractions of the ethanol extract of Thai propolis.
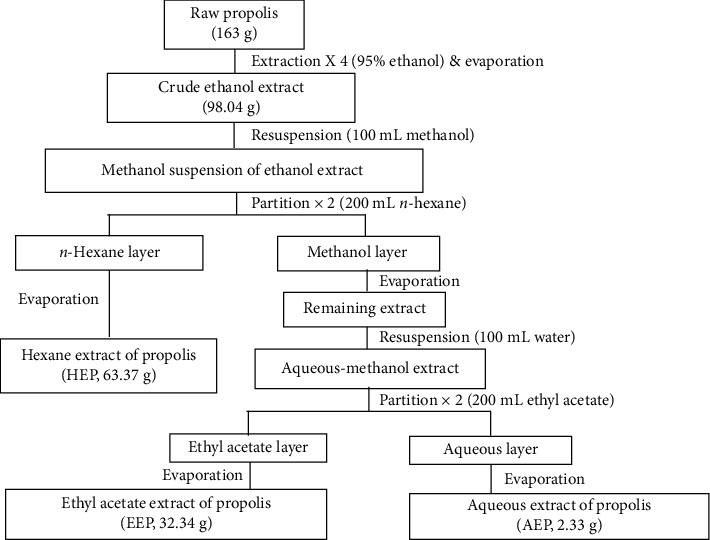
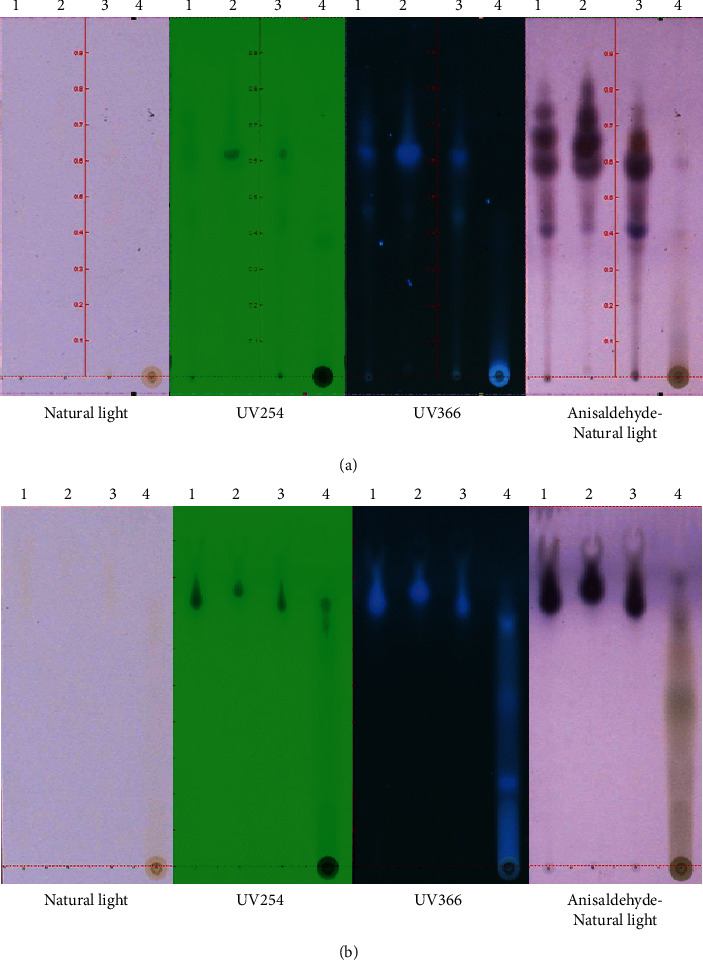
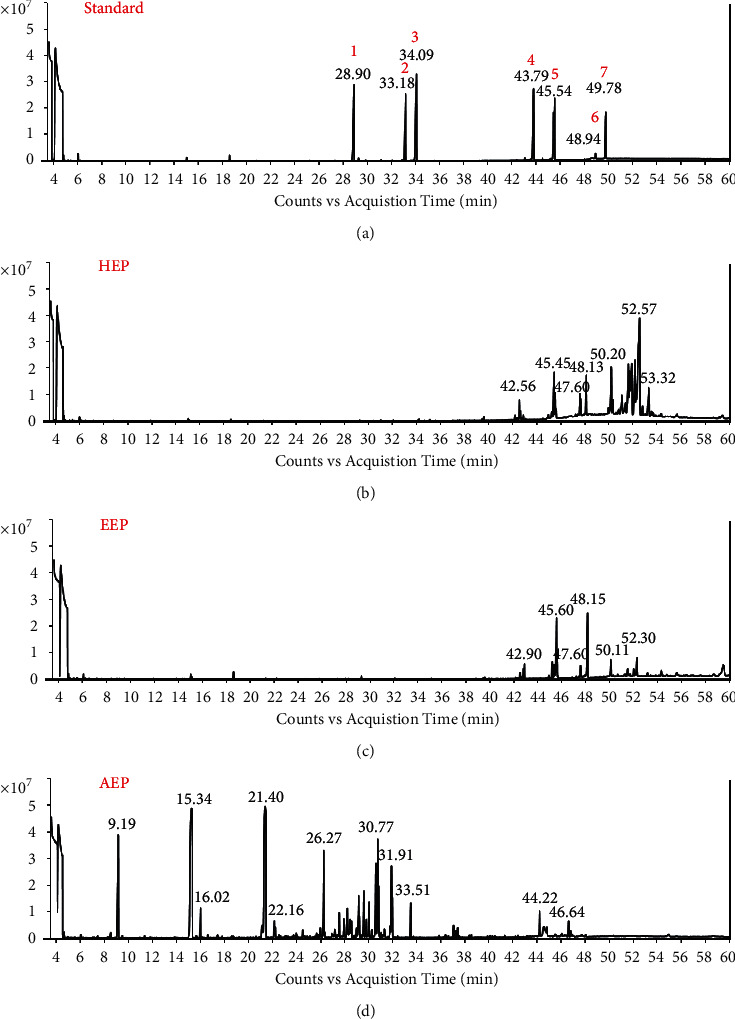
Materials and methods: The crude ethanol extract of propolis was obtained by maceration with 95% ethanol that was sequentially fractionated with hexane, ethyl acetate, and distilled water. The chemical profiles of the samples were assessed by thin-layer chromatography (TLC) and gas chromatography-mass spectrometry (GC-MS). Antioxidant activity was determined using DPPH and FRAP assays. The effects of the propolis fractions on human gingival fibroblast (HGF) proliferation, migration, and in vitro wound healing were determined by MTT, modified Boyden chamber, and scratch assay, respectively.
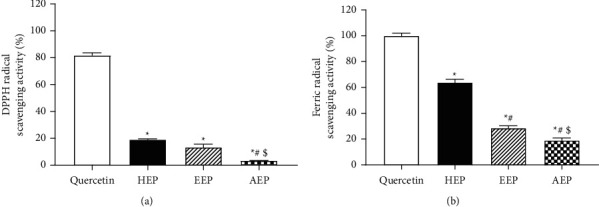
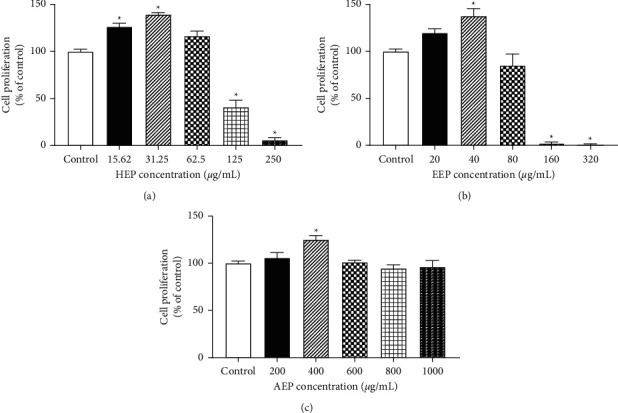
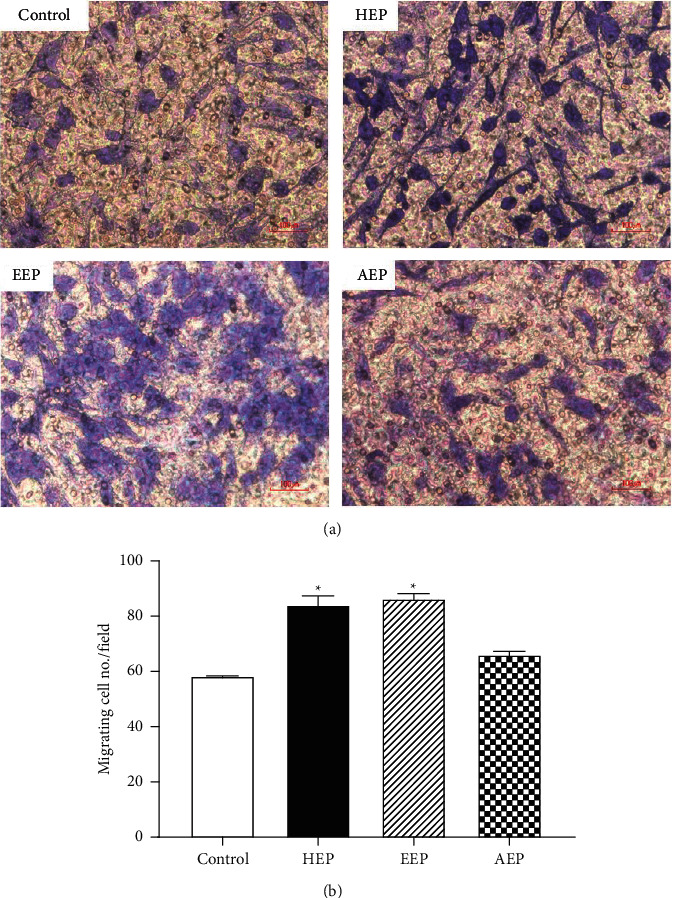
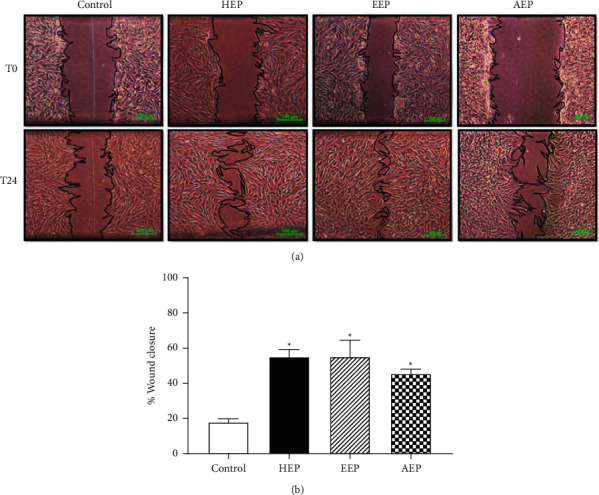
Results: We found that solvent polarity greatly affected the extract yield and TLC profiles. The highest extract yield was found in HEP (38.88%), followed by EEP (19.8%) and AEP (1.42%). TLC revealed 7 spots in the crude ethanol extract (Rf 0.36-0.80), 6 spots in HEP (Rf 0.42-0.80) and EEP (Rf 0.36-0.72), and 4 spots in AEP (Rf 0.17-0.79). GC-MS analysis revealed a high amount of triterpenoids in HEP (82.97%) compared with EEP (28.96%). However, no triterpenoid was found in AEP. The highest antioxidant activity and stimulation of HGF proliferation were observed in HEP, followed by EEP and AEP. HEP and EEP, but not AEP, enhanced HGF migration. However, all propolis fractions induced wound closure.
Conclusions: HEP contained a large amount of triterpenoids. Antioxidant and in vitro wound closure effects were found in HEP, EEP, and AEP fractions.
Copyright © 2022 Suppanut Jongjitaree et al.
Conflict of interest statement
The authors declare that they have no conflicts of interest.
Figures
Similar articles
-
Brazilian red propolis: phytochemical screening, antioxidant activity and effect against cancer cells.BMC Complement Altern Med. 2015 Oct 14;15:357. doi: 10.1186/s12906-015-0888-9. BMC Complement Altern Med. 2015. PMID: 26467757 Free PMC article.
-
Effects of aqueous and ethanolic extracts of Chinese propolis on dental pulp stem cell viability, migration and cytokine expression.PeerJ. 2024 Dec 18;12:e18742. doi: 10.7717/peerj.18742. eCollection 2024. PeerJ. 2024. PMID: 39713129 Free PMC article.
-
Wound Healing, Anti-Inflammatory and Anti-Oxidant Activities, and Chemical Composition of Korean Propolis from Different Sources.Int J Mol Sci. 2024 Oct 22;25(21):11352. doi: 10.3390/ijms252111352. Int J Mol Sci. 2024. PMID: 39518905 Free PMC article.
-
Radioprotective Effects from Propolis: A Review.Molecules. 2023 Aug 3;28(15):5842. doi: 10.3390/molecules28155842. Molecules. 2023. PMID: 37570811 Free PMC article. Review.
-
Nanomaterials Based on Honey and Propolis for Wound Healing-A Mini-Review.Nanomaterials (Basel). 2022 Dec 10;12(24):4409. doi: 10.3390/nano12244409. Nanomaterials (Basel). 2022. PMID: 36558262 Free PMC article. Review.
Cited by
-
Anti-Malassezia globosa (MYA-4889, ATCC) activity of Thai propolis from the stingless bee Geniotrigona thoracica.Heliyon. 2024 Apr 16;10(8):e29421. doi: 10.1016/j.heliyon.2024.e29421. eCollection 2024 Apr 30. Heliyon. 2024. PMID: 38660263 Free PMC article.
-
Isolation of phenolic compounds from eco-friendly white bee propolis: Antioxidant, wound-healing, and anti-Alzheimer effects.Food Sci Nutr. 2023 Dec 7;12(3):1928-1939. doi: 10.1002/fsn3.3888. eCollection 2024 Mar. Food Sci Nutr. 2023. PMID: 38455224 Free PMC article.
References
LinkOut - more resources
Full Text Sources
Miscellaneous
