. 2022 May 18:13:779514.
doi: 10.3389/fphys.2022.779514. eCollection 2022.

High-Resolution 3D Heart Models of Cardiomyocyte Subpopulations in Cleared Murine Heart

Affiliations

High-Resolution 3D Heart Models of Cardiomyocyte Subpopulations in Cleared Murine Heart

Huiying Ren et al. Front Physiol. .

Abstract

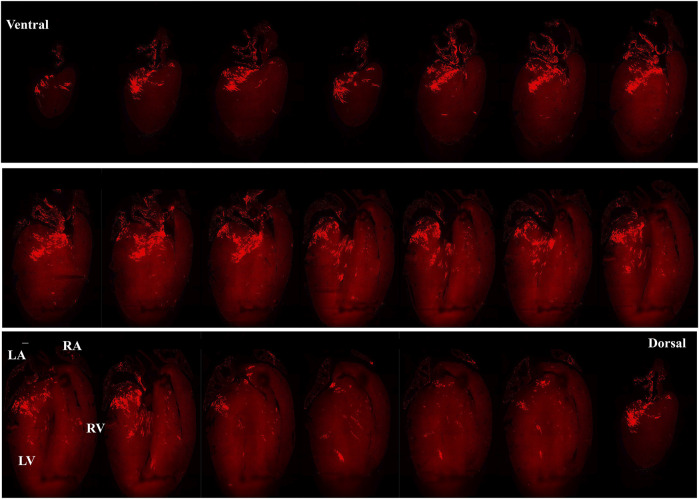
Biological tissues are naturally three-dimensional (3D) opaque structures, which poses a major challenge for the deep imaging of spatial distribution and localization of specific cell types in organs in biomedical research. Here we present a 3D heart imaging reconstruction approach by combining an improved heart tissue-clearing technique with high-resolution light-sheet fluorescence microscopy (LSFM). We have conducted a three-dimensional and multi-scale volumetric imaging of the ultra-thin planes of murine hearts for up to 2,000 images per heart in x-, y-, and z three directions. High-resolution 3D volume heart models were constructed in real-time by the Zeiss Zen program. By using such an approach, we investigated detailed three-dimensional spatial distributions of two specific cardiomyocyte populations including HCN4 expressing pacemaker cells and Pnmt+ cell-derived cardiomyocytes by using reporter mouse lines Hcn4DreER/tdTomato and PnmtCre/ChR2-tdTomato. HCN4 is distributed throughout right atrial nodal regions (i.e., sinoatrial and atrioventricular nodes) and the superior-inferior vena cava axis, while Pnmt+ cell-derived cardiomyocytes show distinct ventral, left heart, and dorsal side distribution pattern. Our further electrophysiological analysis indicates that Pnmt + cell-derived cardiomyocytes rich left ventricular (LV) base is more susceptible to ventricular arrhythmia under adrenergic stress than left ventricular apex or right ventricle regions. Thus, our 3D heart imaging reconstruction approach provides a new solution for studying the geometrical, topological, and physiological characteristics of specific cell types in organs.

Keywords: 3D volume heart models; HCN4 expression (HCN4+) pacemaker cells; Pnmt+ cell-derived cardiomyocytes (PdCMs); heart tissue-clearing; light-sheet fluorescence microscopy; optogenetics.


Conflict of interest statement

The authors declare that the research was conducted in the absence of any commercial or financial relationships that could be construed as a potential conflict of interest.

Figures

FIGURE 1
FIGURE 1
A workflow for tissue clearing and examples of 3D reconstruction. (A) A schematic overview of the workflow of the study and the process of the experimental procedures. Heart dissection was conducted. Afterward tissue fixation and clearing were done to obtain transparent hearts. Finally, Fluorescence images for detecting fluorescent positive cells were obtained using Zeiss Fluorescent microscopy (provide the model details here) in transparent hearts; Diagram illustrating the procedure for the 3D reconstruction achieved using the ZEISS ZEN software to present both Tdtomato fluorescence and depth color code models. 3D volume data (Videos 1–4) was visualized in Paraview following Gaussian smoothing and down-sampling. (B) Images of Heart samples showing the appearance before, with, and without the perfusion. (C) Examples of fluorescence and depth code images for final products.
FIGURE 2
FIGURE 2
3D volume reconstruction of the spatial distribution of HCN4+ pacemaker cells in adult Hcn4DreER/tdTomato mouse heart. (Ai–Ci) The tdTomato fluorescence images show the distribution of HCN4+ cells from the ventral, left side, and dorsal view respectively (also see online video 1, heart size: 10.05 mm × 12.01 mm x 7.565 mm). (Aii–Cii) The depth code image showing the distribution of HCN4+ cells from the ventral, left side, and dorsal view respectively, corresponding to (Ai–Ci) (also see online video 2). (D–F) Three representatives of tdTomato fluorescence image showing the consistent signal pattern in adult Hcn4DreER/tdTomato mouse hearts. (n number = 3). LA: left atrium; RA: right atrium.
FIGURE 3
FIGURE 3
Selected representative coronal sections of Hcn4DreER/tdTomato showing the distribution of HCN4+ cells from ventral side to dorsal side in adult mouse heart. Scale bar: 1,000 μm.
FIGURE 4
FIGURE 4
3D volume reconstruction of the spatial distribution of Pnmt + cell-derived cardiomyocytes (PdCMs) in adult PnmtCre/ChR2−tdTomato heart. (Ai–Ci) The tdTomato fluorescence images show the distribution of PdCMs from the ventral, left side, and dorsal view respectively (also see online video 3, heart size: 7.86 mm × 11.26 mm x 6.113 mm). (Aii–Cii) The depth code image showing the distribution of PdCMs from the ventral, left side, and dorsal view respectively, corresponding to (Ai−Ci) (also see online video 4). (D–F) Three representatives of tdTomato fluorescence image showing the consistent signal pattern in adult PnmtCre/ChR2−tdTomato mouse hearts. (n number = 3). LA: left atrium; RA: right atrium. LV: left ventricular; RV: right ventricular.
FIGURE 5
FIGURE 5
Selected representative coronal sections from an adult PnmtCre/ChR2−tdTomato mouse heart showing the distribution of PdCMs from ventral side to dorsal side. Scale bar: 1,000 μm.
FIGURE 6
FIGURE 6
Controlling heart rhythm with selective optogenetic stimulation and electrical pacing under β-adrenergic stress conditions induced by administration of isoprenaline (ISO) compared with a baseline condition in an adult PnmtCre/ChR2m mouse model. (A). Localized light pacing and electrical pacing in different regions of the heart. (B). The upper panel shows a representative ECG recording of a PnmtCre/ChR2 heart in intrinsic sinus rhythm. The bottom panels show representative ECG recordings of this heart paced by targeting blue light pulses to LV base regions respectively. “P” in representative ECG recordings stands for “P wave”. (C). Examples of ECG recordings in the four different regions of PnmtCre/ChR2 mouse hearts under baseline conditions. (D). ECG was recorded in the LV base of a PnmtCre/ChR2 heart by programmed light stimulation (PLS) and electrical pacing with the S1S2 protocol. (E). ECG of PnmtCre/ChR2 in four different regions with frequency-dependent pacing under β-adrenergic (ISO) stress conditions. (F). A typical example of VT occurred by burst electrical pacing under β-adrenergic stress conditions. (G). Summary of the occurrence of VT in four different regions with frequency-dependent pacing under baseline and β-adrenergic stress conditions. The left ventricular base of hearts showed higher occurrences of VT under β-adrenergic stress. (n number = 5). LA: left atrium; RA: right atrium. LV: left ventricular; RV: right ventricular; LVB: left ventricular base; LVA: left ventricular apex; RVB: right ventricular base; RVA: right ventricular apex.
FIGURE 7
FIGURE 7
Histological section confocal microscopic images of expression of distribution patterns of the HCN4+ cells in Hcn4DreER/tdTomato heart (A) and Pnmt+/Tdtomato positive cells in PnmtCre/ChR2−tdTomato heart (B). Tdtomato fluorescence signal indicating PdCMs was observed on the left side of the heart and SAN region. (B) Tdtomato fluorescence signal was mainly observed in the SAN and AVN regions in Hcn4DreER/tdTomato heart. Blue: nuclear staining by DAPI. Scale bar: 500 μm. Online video 1: The video was generated to show the HCN4+ cells (tdTomato) in an adult mouse heart. The video can be found in the following link: https://figshare.com/s/26bbc6c38ae7a01c7778heart size: 10.05 mm × 12.01 mm x 7.565 mm. Online video 2: The video was generated to show the depth details of HCN4+ cells in the adult mouse heart. The video can be found in the following link: https://figshare.com/s/21c472847c46f0936dddheart size: 10.05 mm × 12.01 mm x 7.565 mm. Online video 3: The video was processed to show the PdCMs (tdTomato) in the adult mouse heart. The video can be found in the following link: https://figshare.com/s/01471ea1c3eda4f6bc43.heart size: 7.86 mm × 11.26 mm x 6.113 mm. Online video 4: The video was processed to show the depth details of PdCMs in the adult mouse heart. The video can be found in the following link: https://figshare.com/s/4d9bb0b180cb58c3082f heart size: 7.86 mm × 11.26 mm x 6.113 mm.

Similar articles

Cited by

References

    1. Acar M., Kocherlakota K. S., Murphy M. M., Peyer J. G., Oguro H., Inra C. N., et al. (2015). Deep Imaging of Bone Marrow Shows Non-dividing Stem Cells Are Mainly Perisinusoidal. Nature 526, 126–130. 10.1038/nature15250 - DOI - PMC - PubMed
    1. Belle M., Godefroy D., Couly G., Malone S. A., Collier F., Giacobini P., et al. (2017). Tridimensional Visualization and Analysis of Early Human Development. Cell 169, 161–173. 10.1016/j.cell.2017.03.008 - DOI - PubMed
    1. Brennan J. A., Chen Q., Gams A., Dyavanapalli J., Mendelowitz D., Peng W., et al. (2020). Evidence of Superior and Inferior Sinoatrial Nodes in the Mammalian Heart. JACC: Clin. Electrophysiol. 6, 1827–1840. 10.1016/j.jacep.2020.09.012 - DOI - PMC - PubMed
    1. Chung K., Wallace J., Kim S.-Y., Kalyanasundaram S., Andalman A. S., Davidson T. J., et al. (2013). Structural and Molecular Interrogation of Intact Biological Systems. Nature 497, 332–337. 10.1038/nature12107 - DOI - PMC - PubMed
    1. Ebert S., Baden J. M., Mathers L. H., Siddall B. J., Wong D. L. (1996). Expression of Phenylethanolamine N-Methyltransferase in the Embryonic Rat Heart. J. Mol. Cell Cardiol. 28, 1653–1658. 10.1006/jmcc.1996.0155 - DOI - PubMed