. 2022 May 19:13:864404.
doi: 10.3389/fphys.2022.864404. eCollection 2022.

Central Commands to the Elbow and Shoulder Muscles During Circular Planar Movements of Hand With Simultaneous Generation of Tangential Forces

Affiliations

Central Commands to the Elbow and Shoulder Muscles During Circular Planar Movements of Hand With Simultaneous Generation of Tangential Forces

Alexander I Kostyukov et al. Front Physiol. .

Abstract

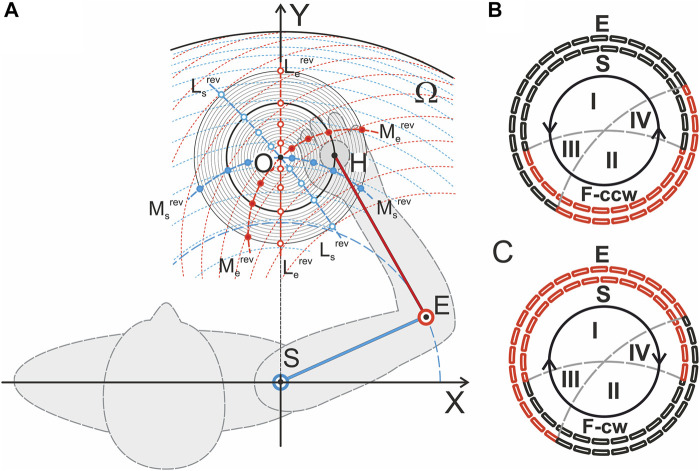
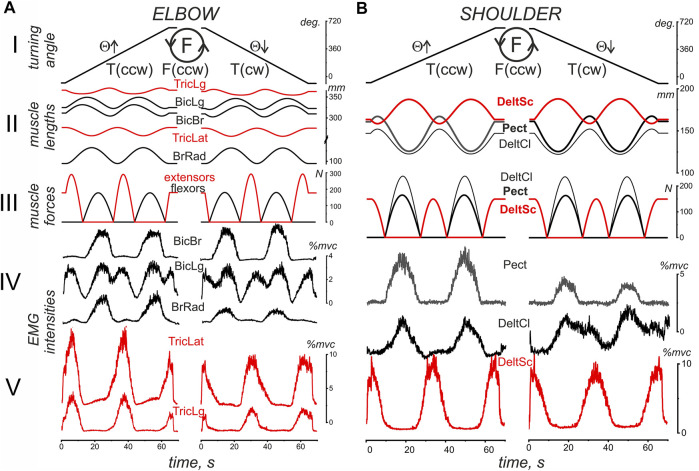
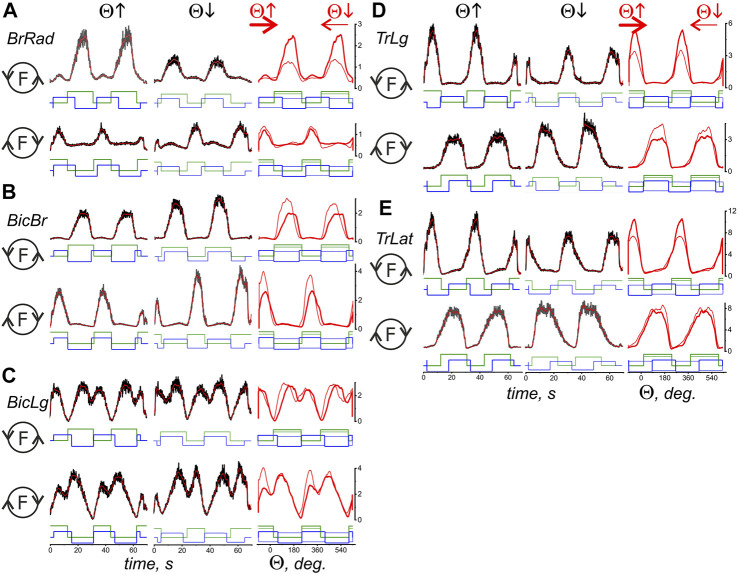
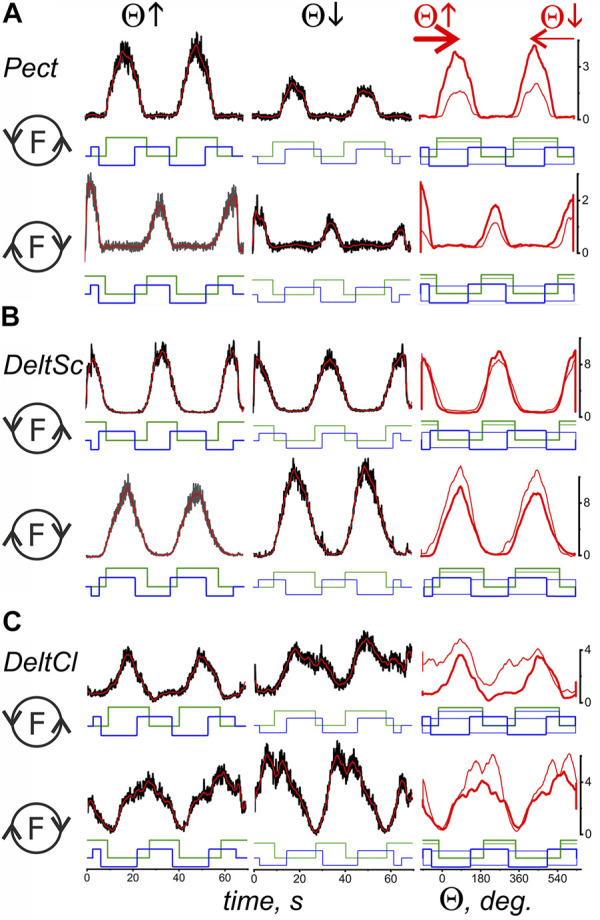
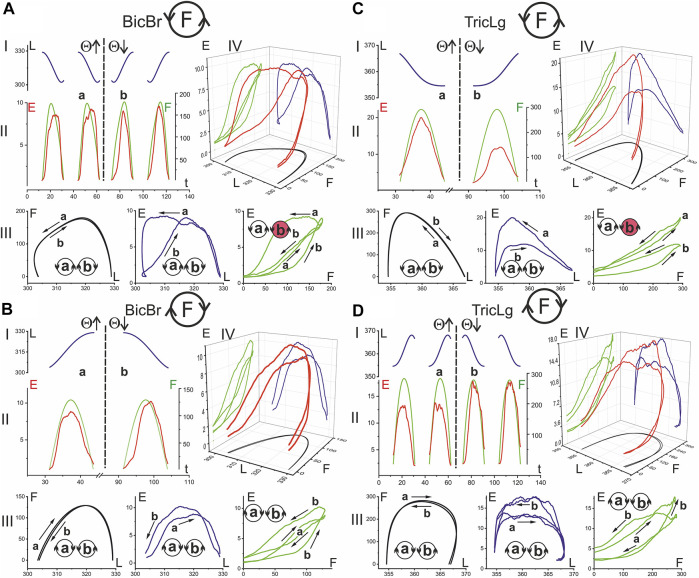
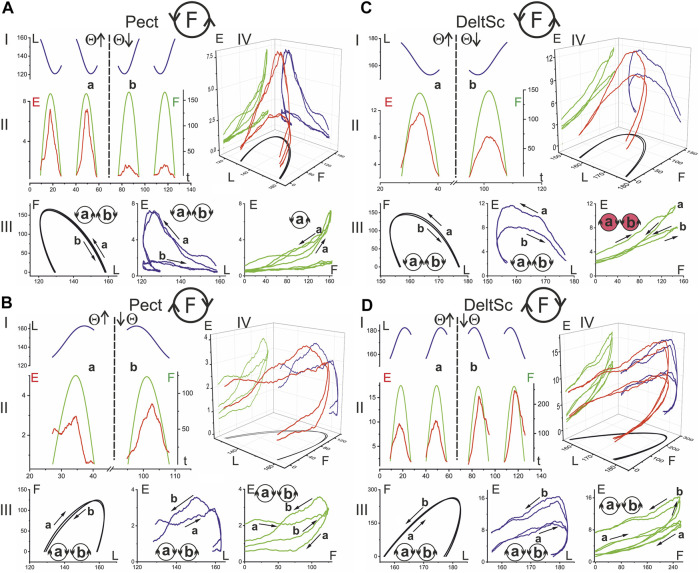
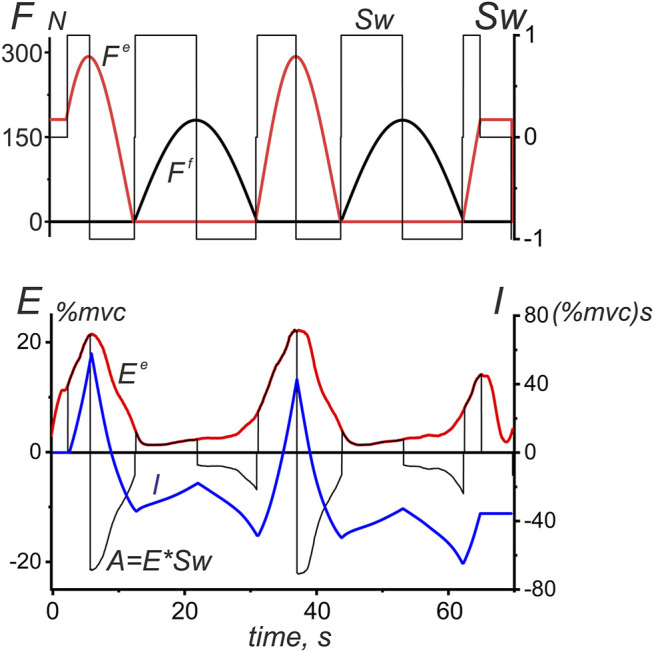
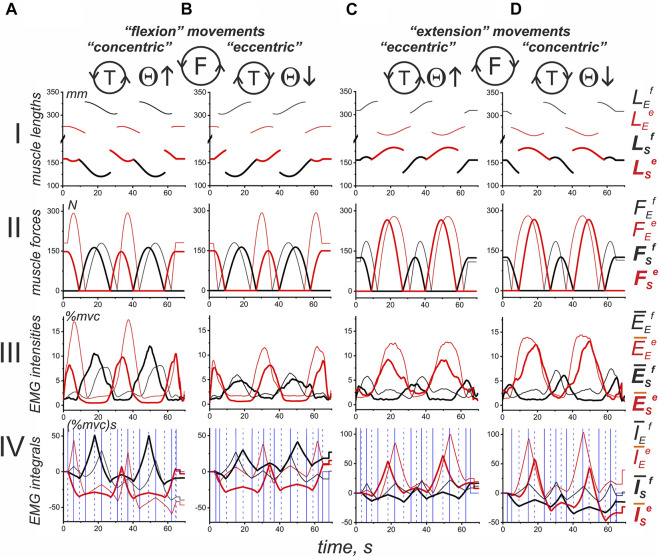
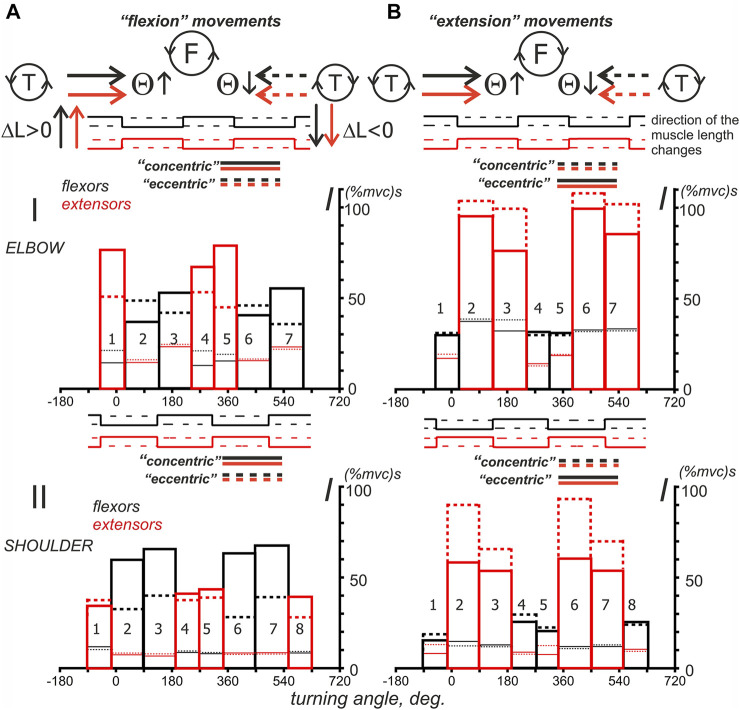
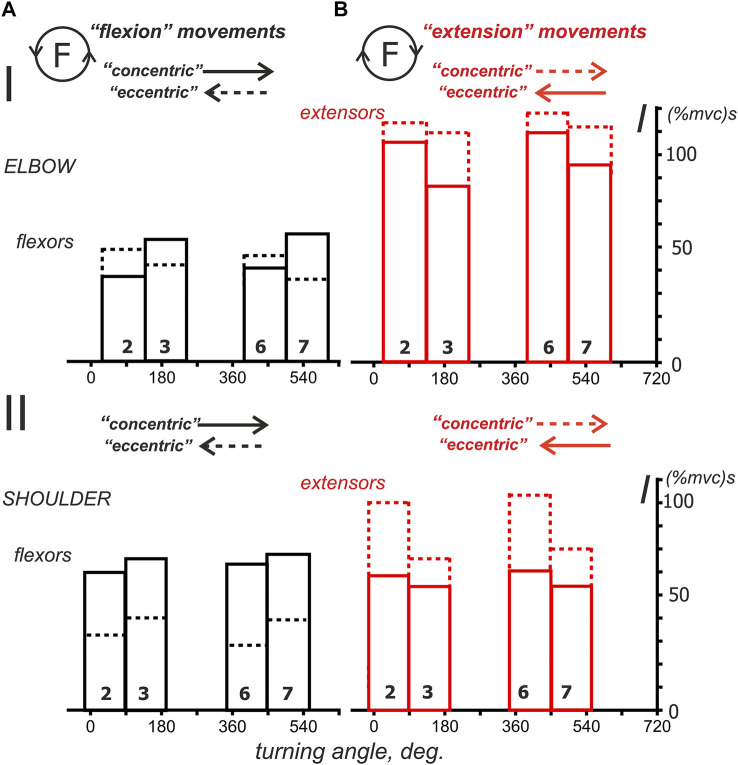
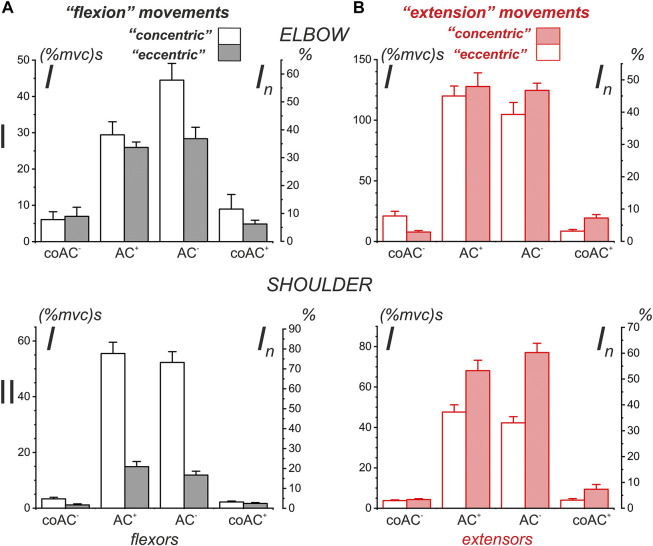
This study examines some of the non-linear effects of signal transduction in the human motor system, with particular emphasis on muscle hysteresis. The movement tests were analyzed in a group of eight subjects, which were asked to develop tangential force using visual biofeedback while performing slow, externally imposed, circular movements of right hand holding a moving handle operated by a computerized mechatronic system. The positional changes in the averaged EMGs of the elbow and shoulder muscles were compared for all combinations of direction of movement and generated force. Additionally, for one of the subjects, there was carried out MRI identification and 3D printing of the bones of the forelimb, shoulder, scapula and collarbone, which made it possible to reconstruct for him the length and force traces of all the muscles under study. The averaged EMG traces in muscles of both joints show their close correspondence to the related force traces, however, the co-activation patterns of activity in agonists and antagonists were also often encountered. The EMG waves related to the respective force waves were strongly dependent on the predominant direction of the muscle length changes within the correspondent force wave locations: the EMG intensities were higher for the shortening muscle movements (concentric contractions) and lower during muscle lengthening (eccentric contractions). The data obtained allows to suggest that for two-joint movements of the forelimbs, it is sufficient to consider the force and activation synergies (patterns of simultaneous activity in different muscles), ignoring at the first stage the effects associated with kinematic synergy. On the other hand, the data obtained indicate that the movement kinematics has a strong modulating effect on the activation synergy, dividing it into concentric and eccentric subtypes, in accordance with the known non-linear features of the muscle dynamics. It has been shown that the concentric and eccentric differences in the responses of the shoulder muscles are more clearly distinguishable than those in the elbow muscles. The shoulder muscles also have a more pronounced symmetry of the averaged EMG responses with respect to the ascending and descending phases of force waves, while demonstrating a lower degree of antagonist cocontraction. The data obtained suggest that the central commands in two-joint movements are determined mainly by the interdependence of force and activation synergies including both intra- and inter-joint components, while kinematic synergy can be interpreted as a potent modulator of activation synergy.

Keywords: electromyogram; forelimb; motor commands; motor control; muscle synergy; two-joint movements.


Conflict of interest statement

The authors declare that the research was conducted in the absence of any commercial or financial relationships that could be construed as a potential conflict of interest.

Figures

FIGURE 1
FIGURE 1
Experimental setup. (A) Geometry of the test movements; the respective graphs are built in a scale for the subject YK, for whom the tomographic identification of the joint bones had been preliminarily performed (Gorkovenko et al., 2020). The center of the circle of movement (a thickened line in the family of concentric circles, R = 10 cm) was located on a line perpendicular to the frontal plane passing through the axis of the subject’s right shoulder joint; the distance from the circle center to the joint center was 40 cm, and the lengths of the SE and EH segments were 28 and 32 cm, respectively (the distances can be used as a scale for this Panel). The red dashed lines represent traces of movement in the elbow joint for a fixed set of shoulder positions; the blue dashed lines show movements in the shoulder joint during stepwise fixation of the elbow joint angle. Additionally, the reverse lines for the torques acting around the shoulder and elbow joints (Ms,e rev) and for the directions of the muscle length changes (Ls,e rev) (Kostyukov, 2016) are shown in (B,C). The segments of the circular movement where the flexor (black) and extensor (red) muscles belonging to the shoulder (E, outer dashed circles) and elbow (S, inner dotted circles) joints actively contract to develop tangential forces in counterclockwise F (ccw) or clockwise F (cw) directions are shown. Synergy sectors I and II define the zones in which combinations of the elbow and shoulder muscles of the same functionality (flexor-flexor, extensor-extensor) are activated to create tangential forces; in sectors III and IV, the flexor-extensor or extensor-flexor pairs should be active. A change in the force direction, F (ccw) on F (cw), and vice versa leads to a change in the positions of the activation sectors between the flexors and extensors of both joints.
FIGURE 2
FIGURE 2
An example of typical recordings of EMG activity in the flexor (black) and extensor (red) muscles (subject YK with identified bone geometry). The muscles belong to the elbow (A) and shoulder (B) joints during standard test movements, including the creation of counterclockwise hand force (F inside the drawn circle); the same movement program (not shown in this panel) is then repeated for a clockwise direction of force. The movement trajectory of the handle under the subject’s right hand (H), which has been defined by the program of the related turnings of the step motors, is presented as the turning angle (Θ) of the handle’s position at the circular trace; the EMG reactions during the rising (Θ↑) and falling (Θ↓) branches of movement are considered separately. The pressure on the handle was created by a subject in accordance with an arbitrary contraction program (ACP) that was prepared in advance together with the imposed movement program (IMP) for the handle transitions of the mechatronic mechanostimulator (MMS). The muscle lengths and forces were evaluated in an off-line regimen using a corresponding model approach based on the 3D prints of the bones of this subject (Gorkovenko et al., 2020), therefore the presented single records of force and length correspond to all identical movements used for further averaging procedure of the EMG records in six repetitions of the tests (see Methods). Note the different calibration scales for EMGs recorded from different muscles.
FIGURE 3
FIGURE 3
Comparison of the average EMG activities in the flexor and extensor muscles of the elbow joint during standard test movements produced during the creation of the hand force in opposite directions. The data were obtained of subject YK with identified bone geometry, repetition of six identical tests for averaging procedure. The EMG reactions on the rising (Θ↑) and falling (Θ↓) branches of the turning angle change are compared, and the circle with the letter F inside designates the force direction in the respective movement tests. The first two columns present the time scale, thus including the averaged EMG records (black) with subsequent filtering by 300-point Savitsky-Golay smoothing (red lines); the filtered records are additionally transformed to depend on the turning angle and are superimposed in the third column; the thick and thin red lines correspond to the rising and falling branches of the turning angle, respectively. The stepwise records below the EMGs describe the timing of both the respective force waves (green) and the directions of the muscle length changes (blue). The “up” and “down” on the blue records correspond to the lengthening and shortening movement phases, respectively. The thick EMG records in the third column evolve from left to right, whereas the thin records evolve in the opposite direction. The EMG intensities are calibrated based on % of the corresponding MVC values. A continuation of the presentation of this experiment for the shoulder muscles is shown in Figure 4 .
FIGURE 4
FIGURE 4
Comparison of the averaged EMG activities in the flexor and extensor muscles of the shoulder joint during test movements. The data were obtained in the same experiment as in Figure 3; combining both drawings proved impractical due to their scope. The structure of the plots and all the designations (except for the names of muscles) are the same as in Figure 3.
FIGURE 5
FIGURE 5
The hysteresis effects in the activity of the elbow muscles: relationship between EMG intensity (E), muscle length (L) and force (F). The data were obtained of subject YK with identified bone geometry, repetition of six identical tests for averaging procedure. The analysis is based on the segments of time records L(t) (blue), E(t) (red), and F(t) (green), which are allocated strictly within the action zones of the forces generated by the muscle [Panels I, II in (A–D)]. After reordering the functional dependencies between variables, the 3D traces of the EMG intensity changes are presented in dependency on the respective mechanical parameters of the muscles E(L, F) (red color) [panel IV in (A–D)]. Functional dependencies F (L), E (L), and E (F) are defined as projections of three-dimensional traces on coordinate plates, and they are displayed in the respective colors: black, blue, and green [panels III in (A–D)]. Other designations: the circle with letter F inside designates the force direction in respective movement tests (A–D); a and b are the phases of the test movement coinciding with rising (Θ↑) and falling (Θ↓) branches of the turning angle change; the circles with letters a and b inside designate the directions of the respective hysteresis loops (the directions mainly coincide for different pairs of variables with the exception of those marked in red). A continuation of the presentation of this experiment for the shoulder muscles is shown in Figure 6.
FIGURE 6
FIGURE 6
The hysteresis effects in the activity of the shoulder muscles. The data were obtained in the same experiment as in Figure 5; combining both drawings proved impractical due to their scope. The structure of the plots and all the designations (except for the names of muscles) are the same as in Figure 5.
FIGURE 7
FIGURE 7
A procedure used to integrate the EMG intensity in the antagonist muscles of a given joint during the ascending and descending phases of successive force waves. An example is the EMG reaction of TrLat shown earlier in Figure 3. The switch function Sw at the upper plot is defined by Equation 3, and the integration procedure for the EMG intensity (I) is applied to the auxiliary function A = E*Sw; the integration result is an oscillatory process that correlates with the original EMG intensity curve, at the same time, stressing more distinctively differences between EMG areas at the ascending and descending phases of the force waves. The difference between the maximum and minimum points at each section of the integral curve (I), where this function changes monotonically, gives us a strict value of the EMG intensity area within the corresponding time intervals. The integral curve I makes it possible to more clearly represent the differences between the central commands acting on the studied muscles on the ascending and descending branches of force waves.
FIGURE 8
FIGURE 8
Average of the results obtained in identical experiments with four different subjects. The records of muscle length (I) and force (II) were taken from an experiment with subject YK, of which a complete anthropometric identification of his right arm was obtained (see Methods). First, for each subject, including YK, the average EMG recordings belonging to the following four muscle groups were obtained: (A) elbow flexors (an additional averaging procedure was applied to the records of BrRad, BicBr, BicLg); (B) elbow extensors (TrBr, TrLat); (C) shoulder flexors (Pect, DeltCl); and (D) shoulder extensors (DeltSc). Second, using the corresponding Sw functions reconstructed for the muscles of subject YK, the EMG integrals (as shown in Figure 7) were determined for each subject. Third, the corresponding EMG integrals, which were previously determined for different subjects, were averaged within each of the muscle groups, and the resulting records are presented in line IV. In addition, line III shows the results of the in-group averaging of the corresponding EMGs of the four subjects. The data related to flexor and extensor muscles are shown in black and red, where the thin and thick lines represent the muscles of the elbow and shoulder joints, respectively. The blue vertical lines in line IV correspond to the ascending and descending portions of the Sw functions defined for the muscles of the elbow (solid lines) and shoulder (dashed lines) joints.
FIGURE 9
FIGURE 9
Turning angle-dependent distributions of the mean values of the average EMG integrals defined for four subjects in Figure 8. Two force direction (A,B) and two movement direction combinations are compared, as shown by the solid and dashed lines for the turning angle changes, i.e., T (ccw) and T (cw). The distributions of EMG integrals depending on the turning angle are presented for the sequences of intervals that correspond to the ascending and descending phases of the force waves, which are sequentially generated by the antagonistic muscles of the elbow and shoulder joints. Note the difference between the positions of the ascending and descending parts of the force waves for different force directions. Using the sequential numbering of the column bars in the Panel, the ascending parts correspond to the even numbers in F (ccw) and odd numbers in the F (cw) directions of force. The details of the data collection and calculation methods are presented in Figures 7, 8. The thick bars, which are marked by color (black—flexors, red—extensors), are related to the integral characteristics defined within the “own” force wave sectors, whereas the thin lines of respective color describe the effects of cocontraction within sectors with predominant activation of the antagonistic muscles; the solid and dashed lines refer to the turning angle change directions, as shown at the top of the figure.
FIGURE 10
FIGURE 10
The average integral EMG characteristics considered for predominantly activated muscles during the “flexion” (A) and “extension” (B) movement paradigms. These reduced plots are extracted from the corresponding diagrams in Figure 9; the reactions of the antagonist muscles in these plots (extensors in A; flexors in B) are hidden for simplicity. Note the rotation of the “concentric” and “eccentric” directions for the flexor and extensor muscles.
FIGURE 11
FIGURE 11
Statistical analysis of the average EMG components recorded in four different experiments on a subject with identified bone geometry (YK). This is a partial representation in graphical form of the quantitative data from Table 1. The additional scales I n (%) on the right side of the plots represent the percentage normalization of the statistical parameters with respect to the sum of the means of all presented components in the plots. Note that the order of components in the plots along their X-axes coincides with the sequence of their appearance in the corresponding test movements.

Similar articles

Cited by

References

    1. Abramovich T. I., Vereshchaka I. V., Tal’nov A. M., Gorkovenko A. V., Dornovski M., Kostyukov A. I. (2015). Coordination of Activity of the Shoulder Belt and Shoulder Muscles in Humans During Bimanual Synchronous Two-Joint Movements. Neurophysiology 47, 310–321. 10.1007/s11062-015-9538-6 - DOI
    1. Almeida G. L., Hong D. A., Corcos D., Gottlieb G. L. (1995). Organizing Principles for Voluntary Movement: Extending Single-Joint Rules. J. Neurophysiol. 74 (4), 1374–1381. 10.1152/jn.1995.74.4.1374 - DOI - PubMed
    1. Berger D. J., Gentner R., Edmunds T., Pai D. K., d'Avella A. (2013). Differences in Adaptation Rates After Virtual Surgeries Provide Direct Evidence for Modularity. J. Neurosci. 33 (30), 12384–12394. 10.1523/JNEUROSCI.0122-13.2013 - DOI - PMC - PubMed
    1. Bernstein N. A. (1967). The Coordination and Regulation of Movements. London: Pergamon Press.
    1. Bizzi E., Cheung V. C. K. (2013). The Neural Origin of Muscle Synergies. Front. Comput. Neurosci. 7, 51. 10.3389/fncom.2013.00051 - DOI - PMC - PubMed

LinkOut - more resources