. 2021 Dec;1(12):1148-1161.
doi: 10.1038/s43587-021-00143-2. Epub 2021 Dec 6.

Regulation of aged skeletal muscle regeneration by circulating extracellular vesicles

Affiliations

Regulation of aged skeletal muscle regeneration by circulating extracellular vesicles

Amrita Sahu et al. Nat Aging. 2021 Dec.

Abstract

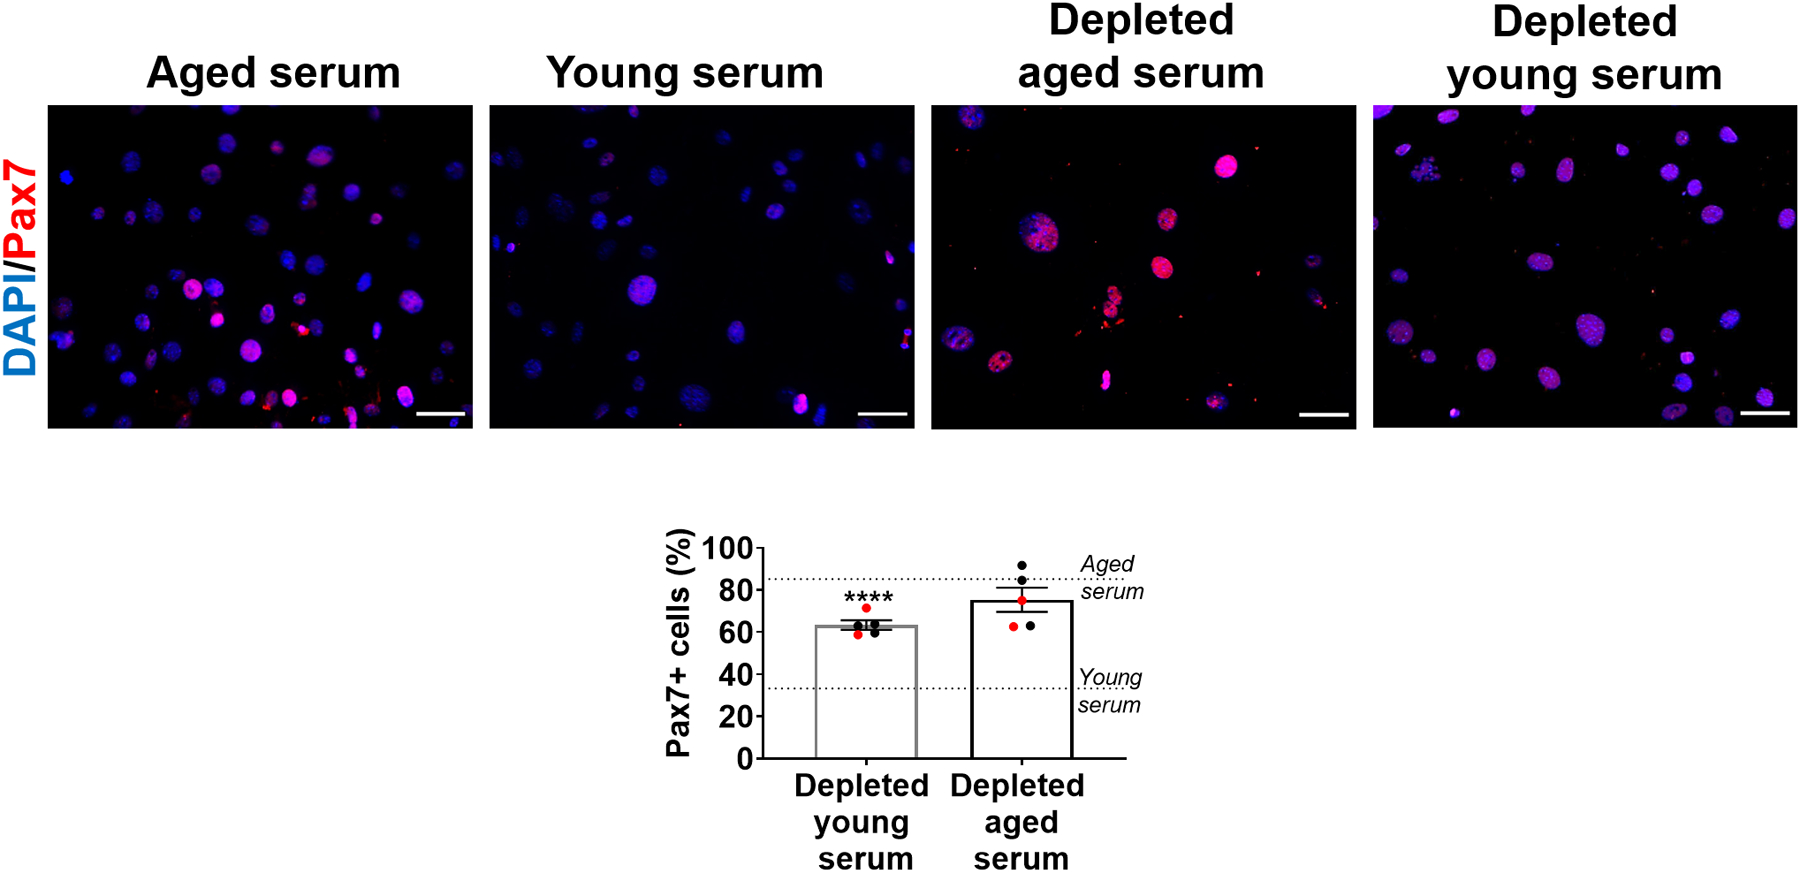
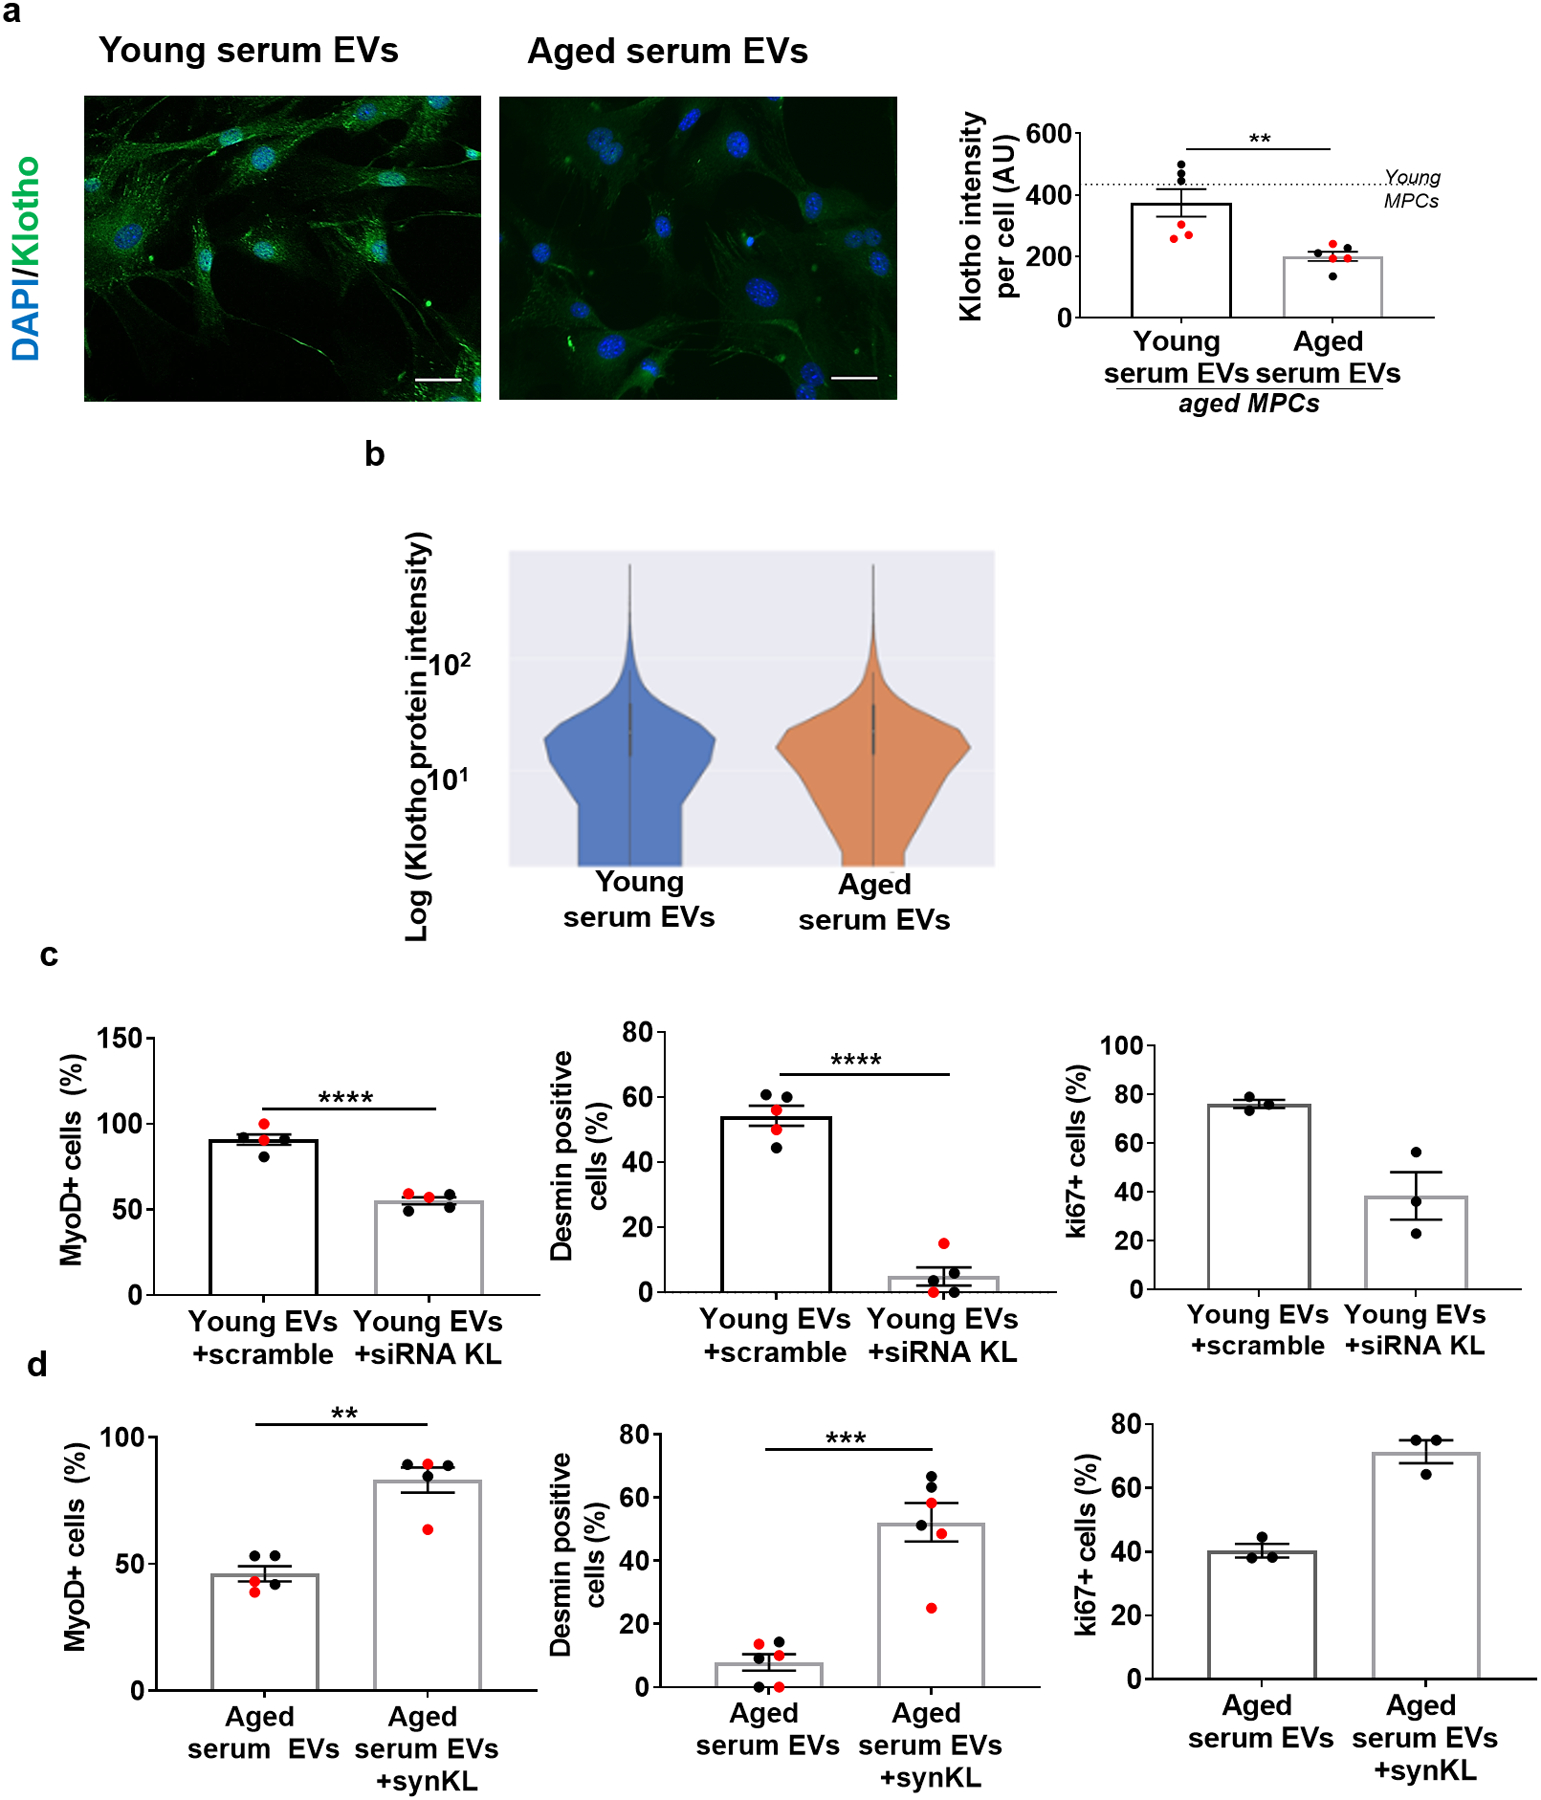
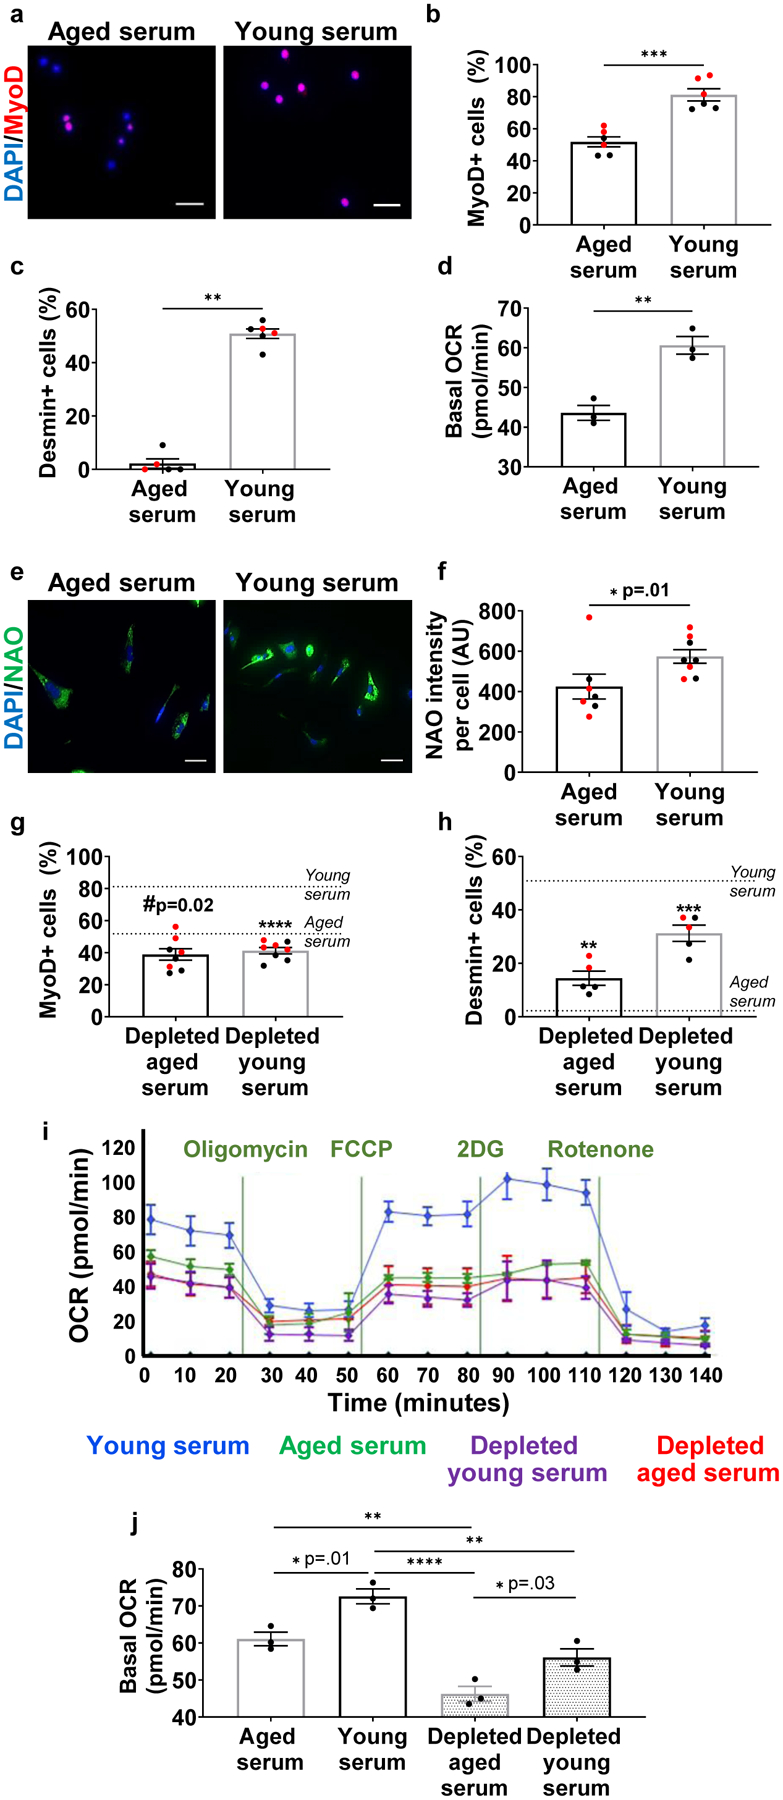
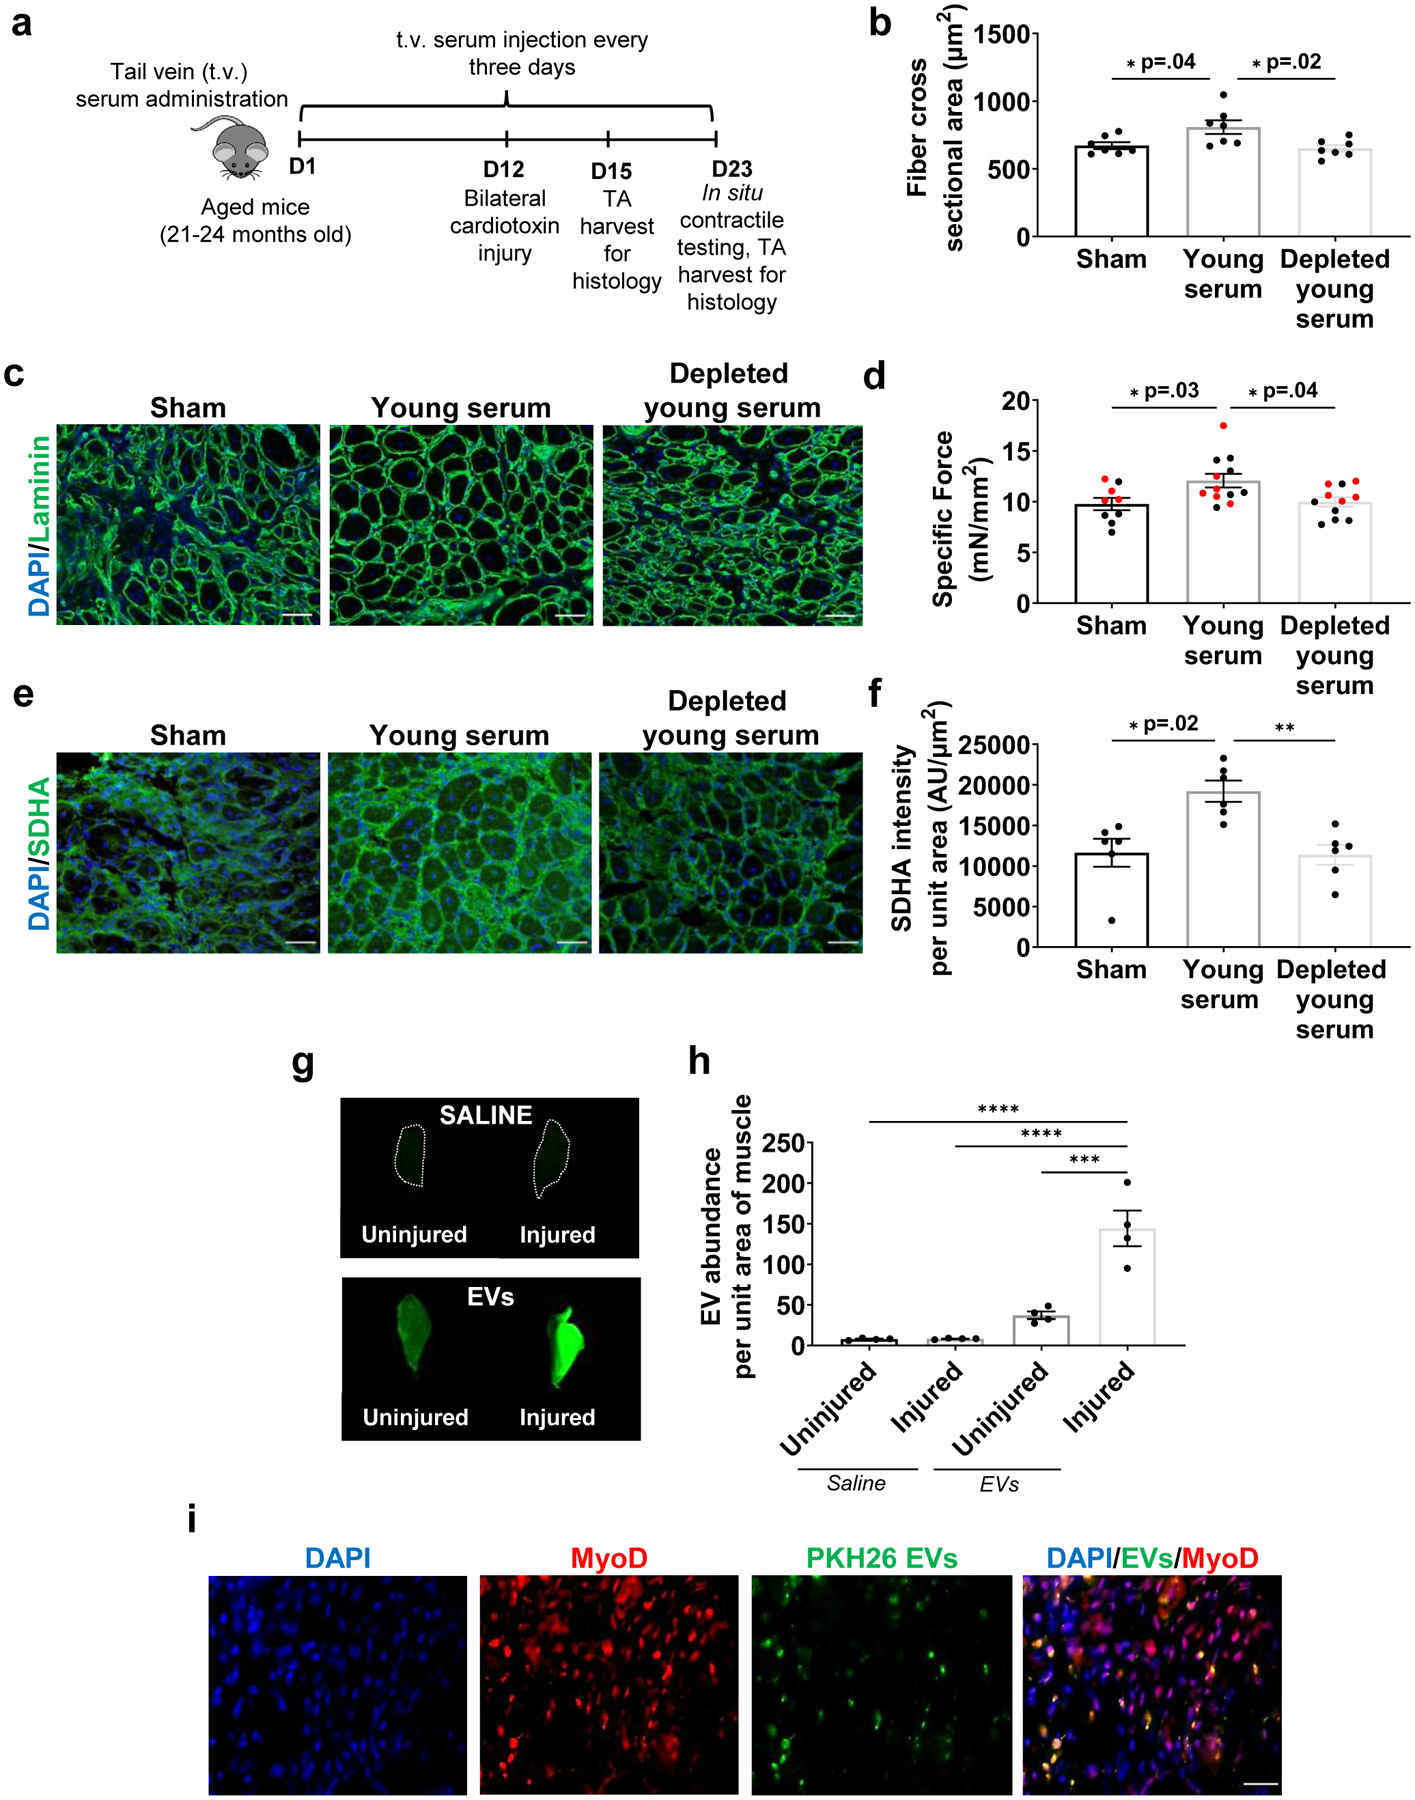
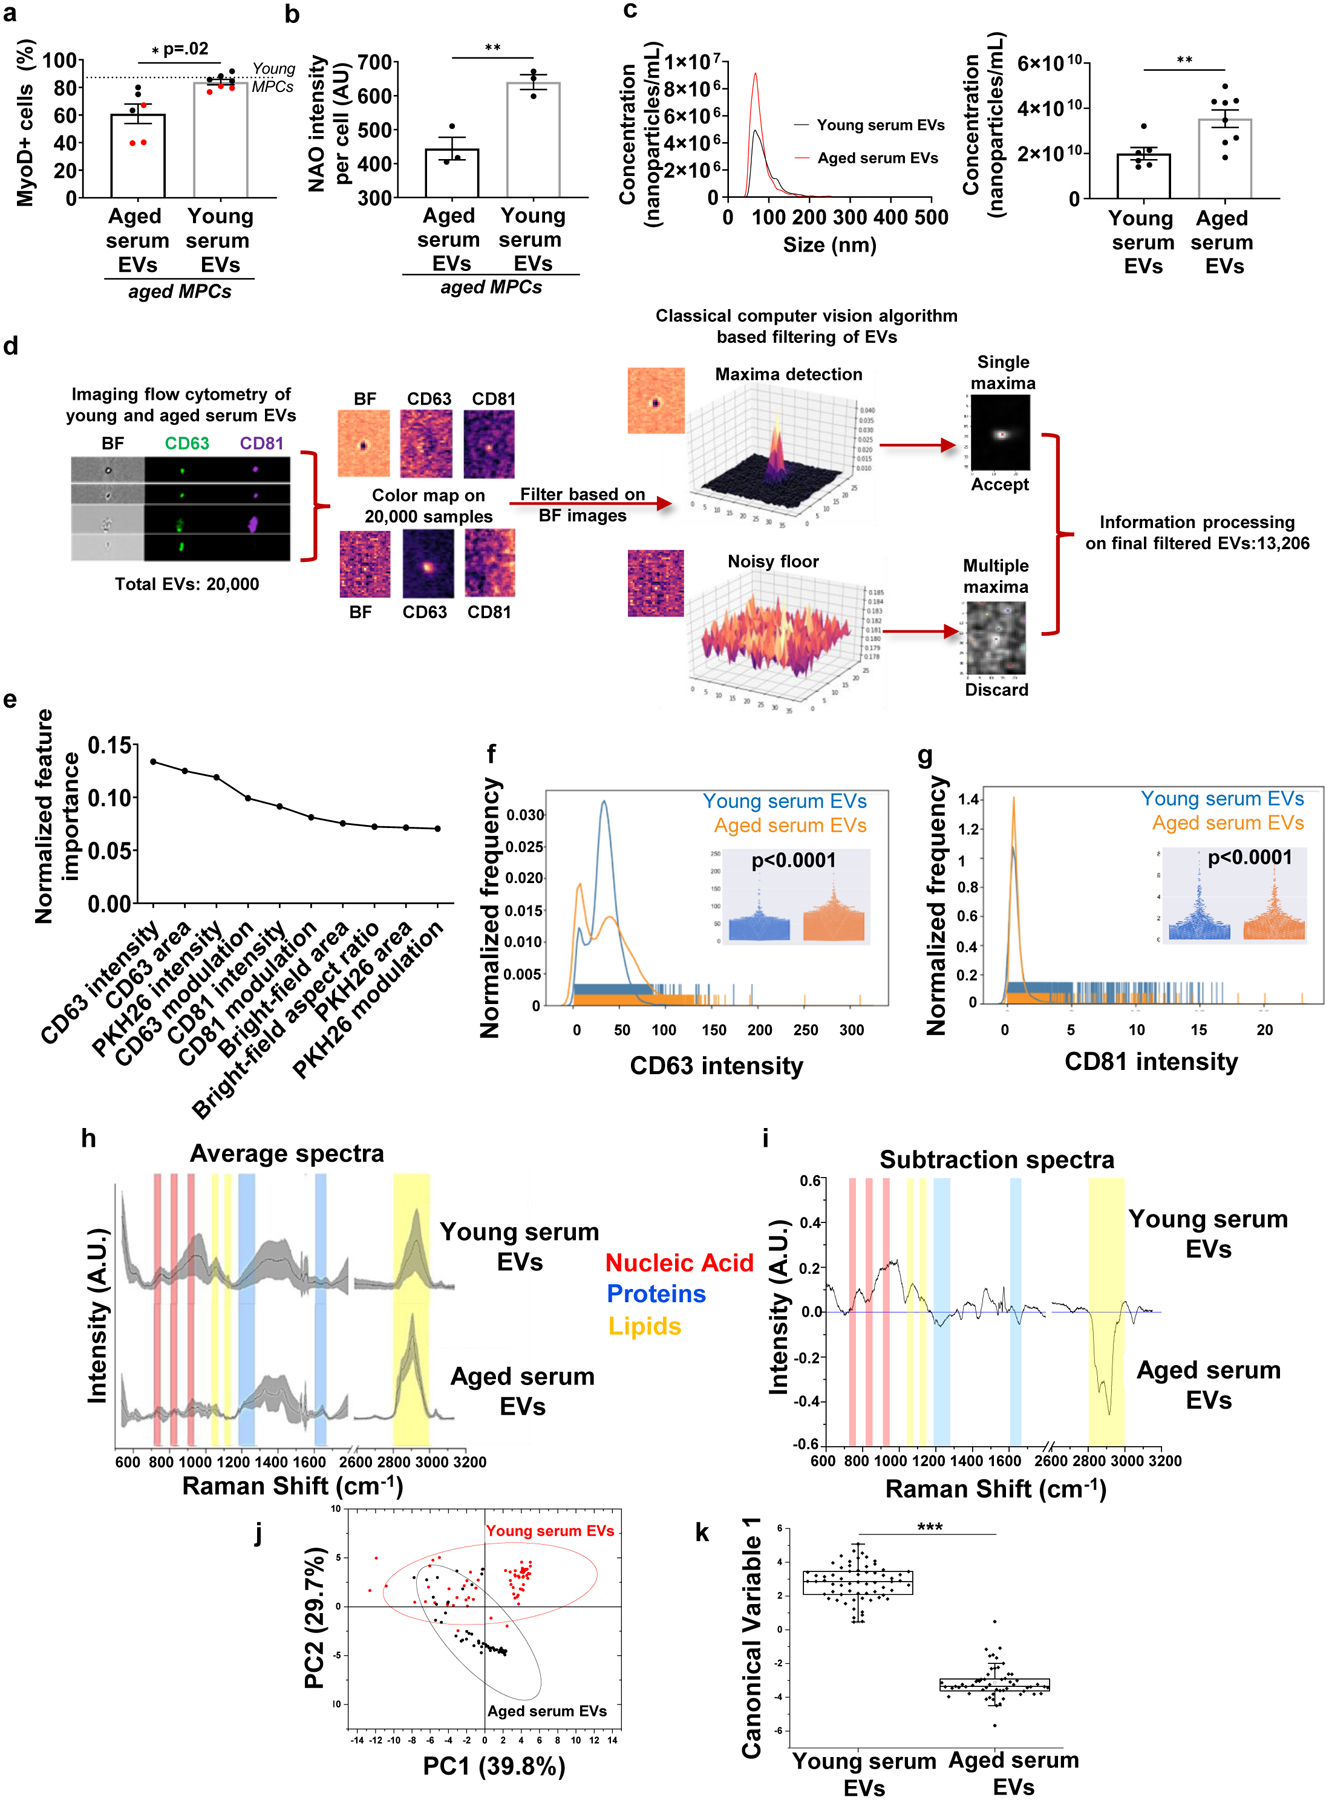
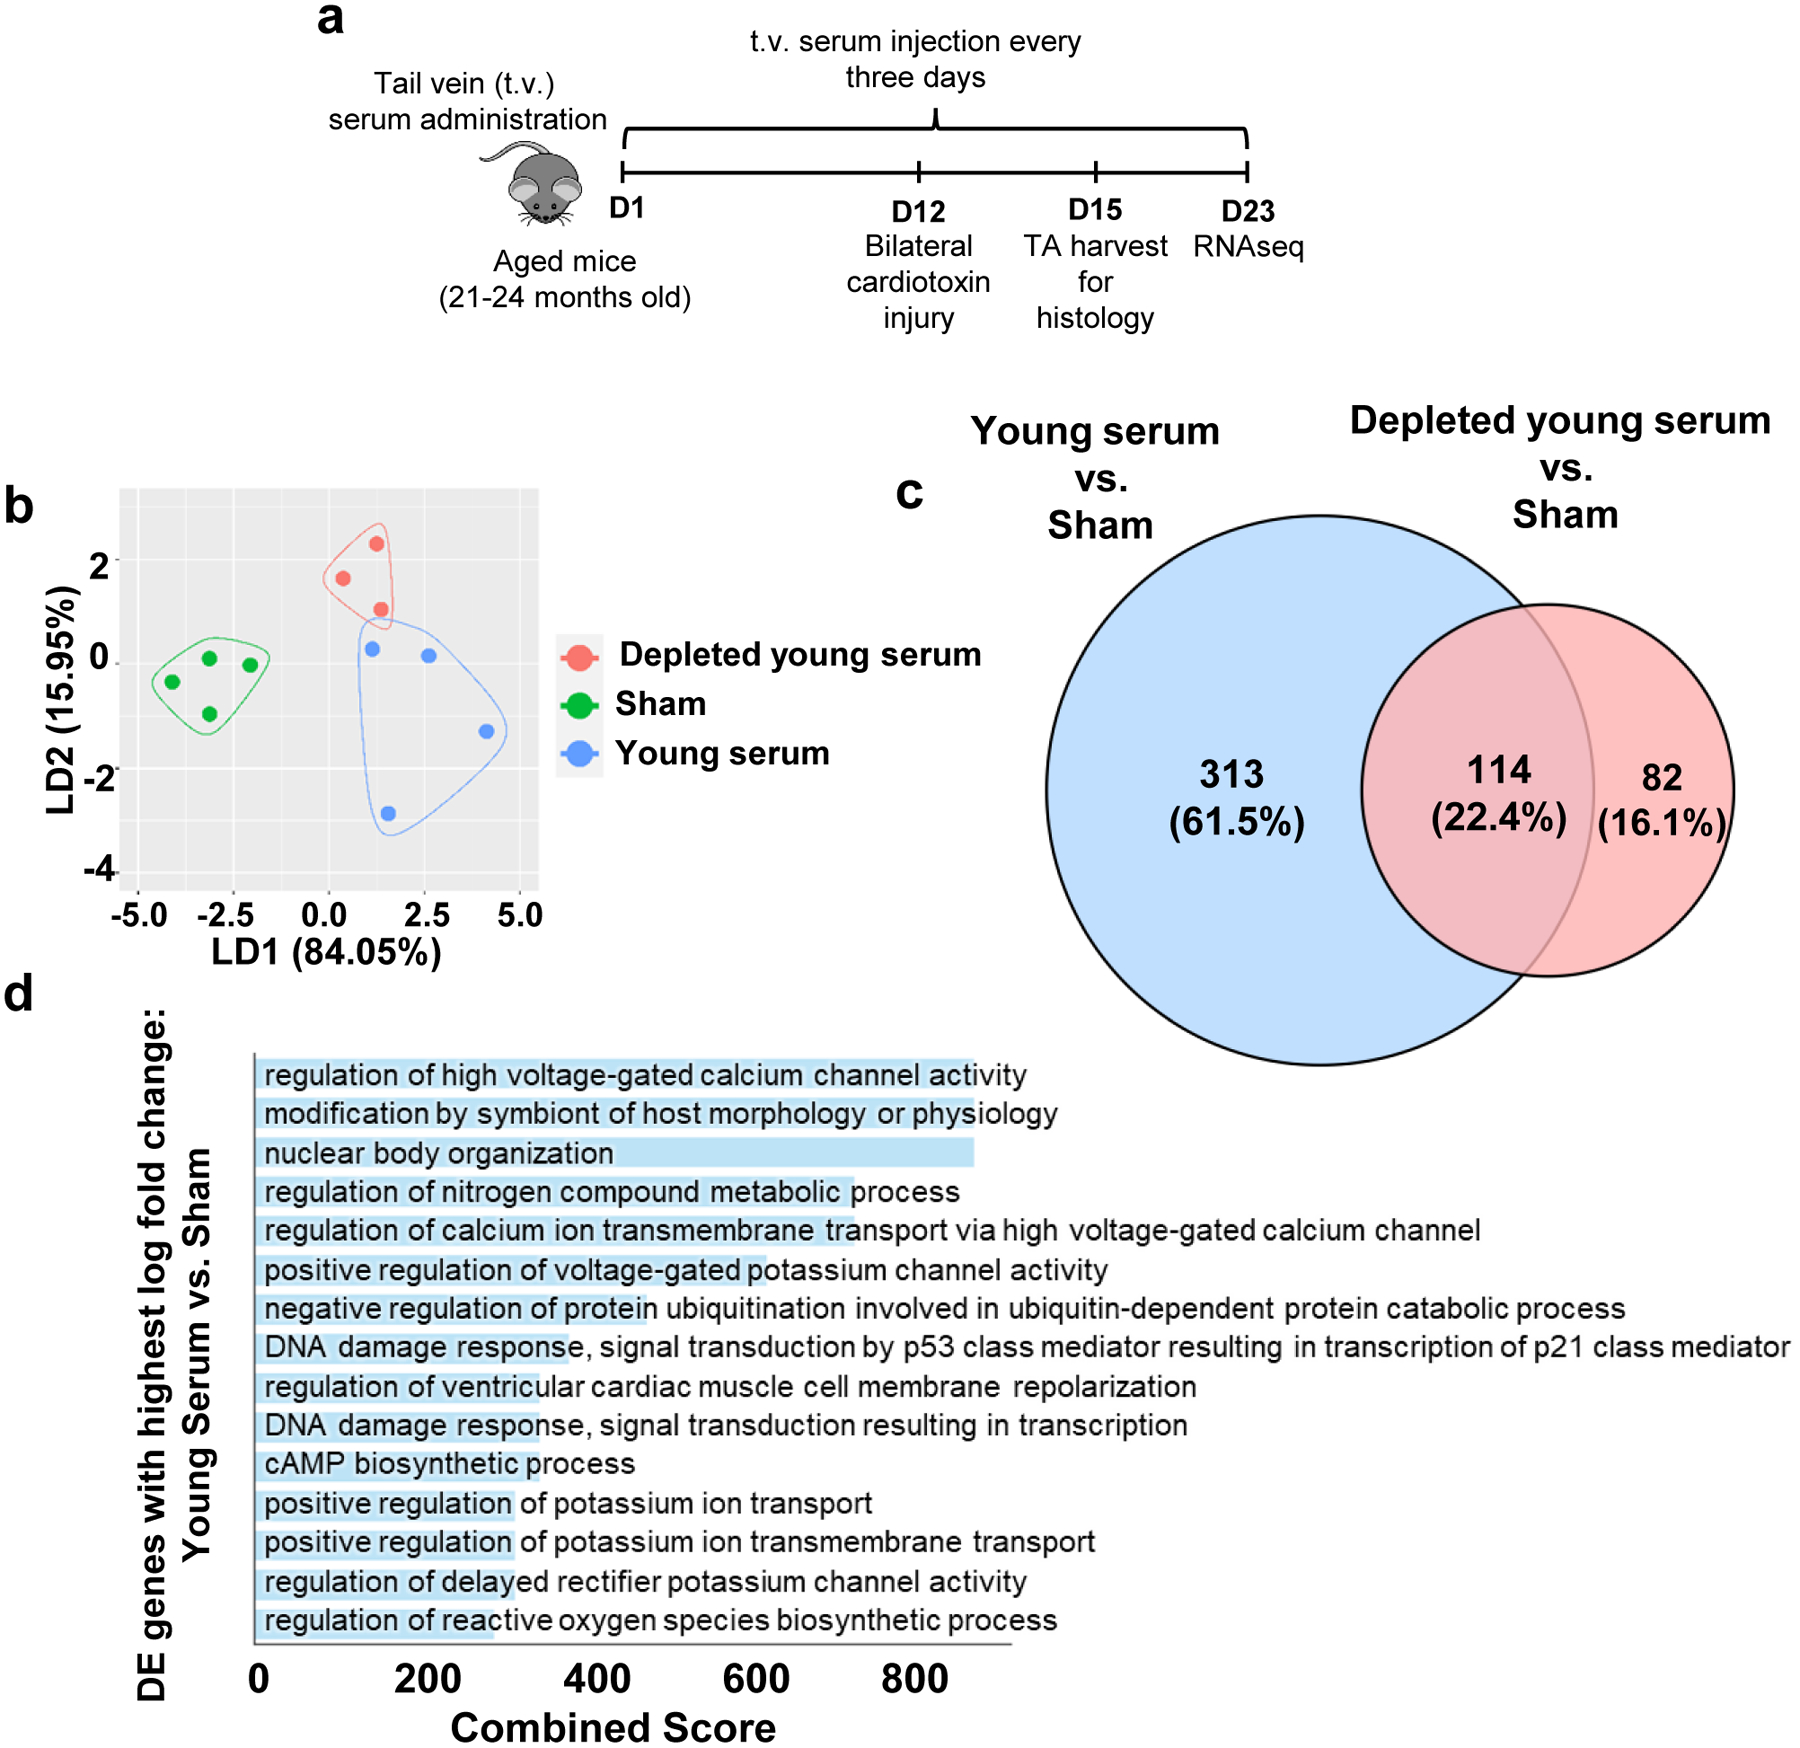
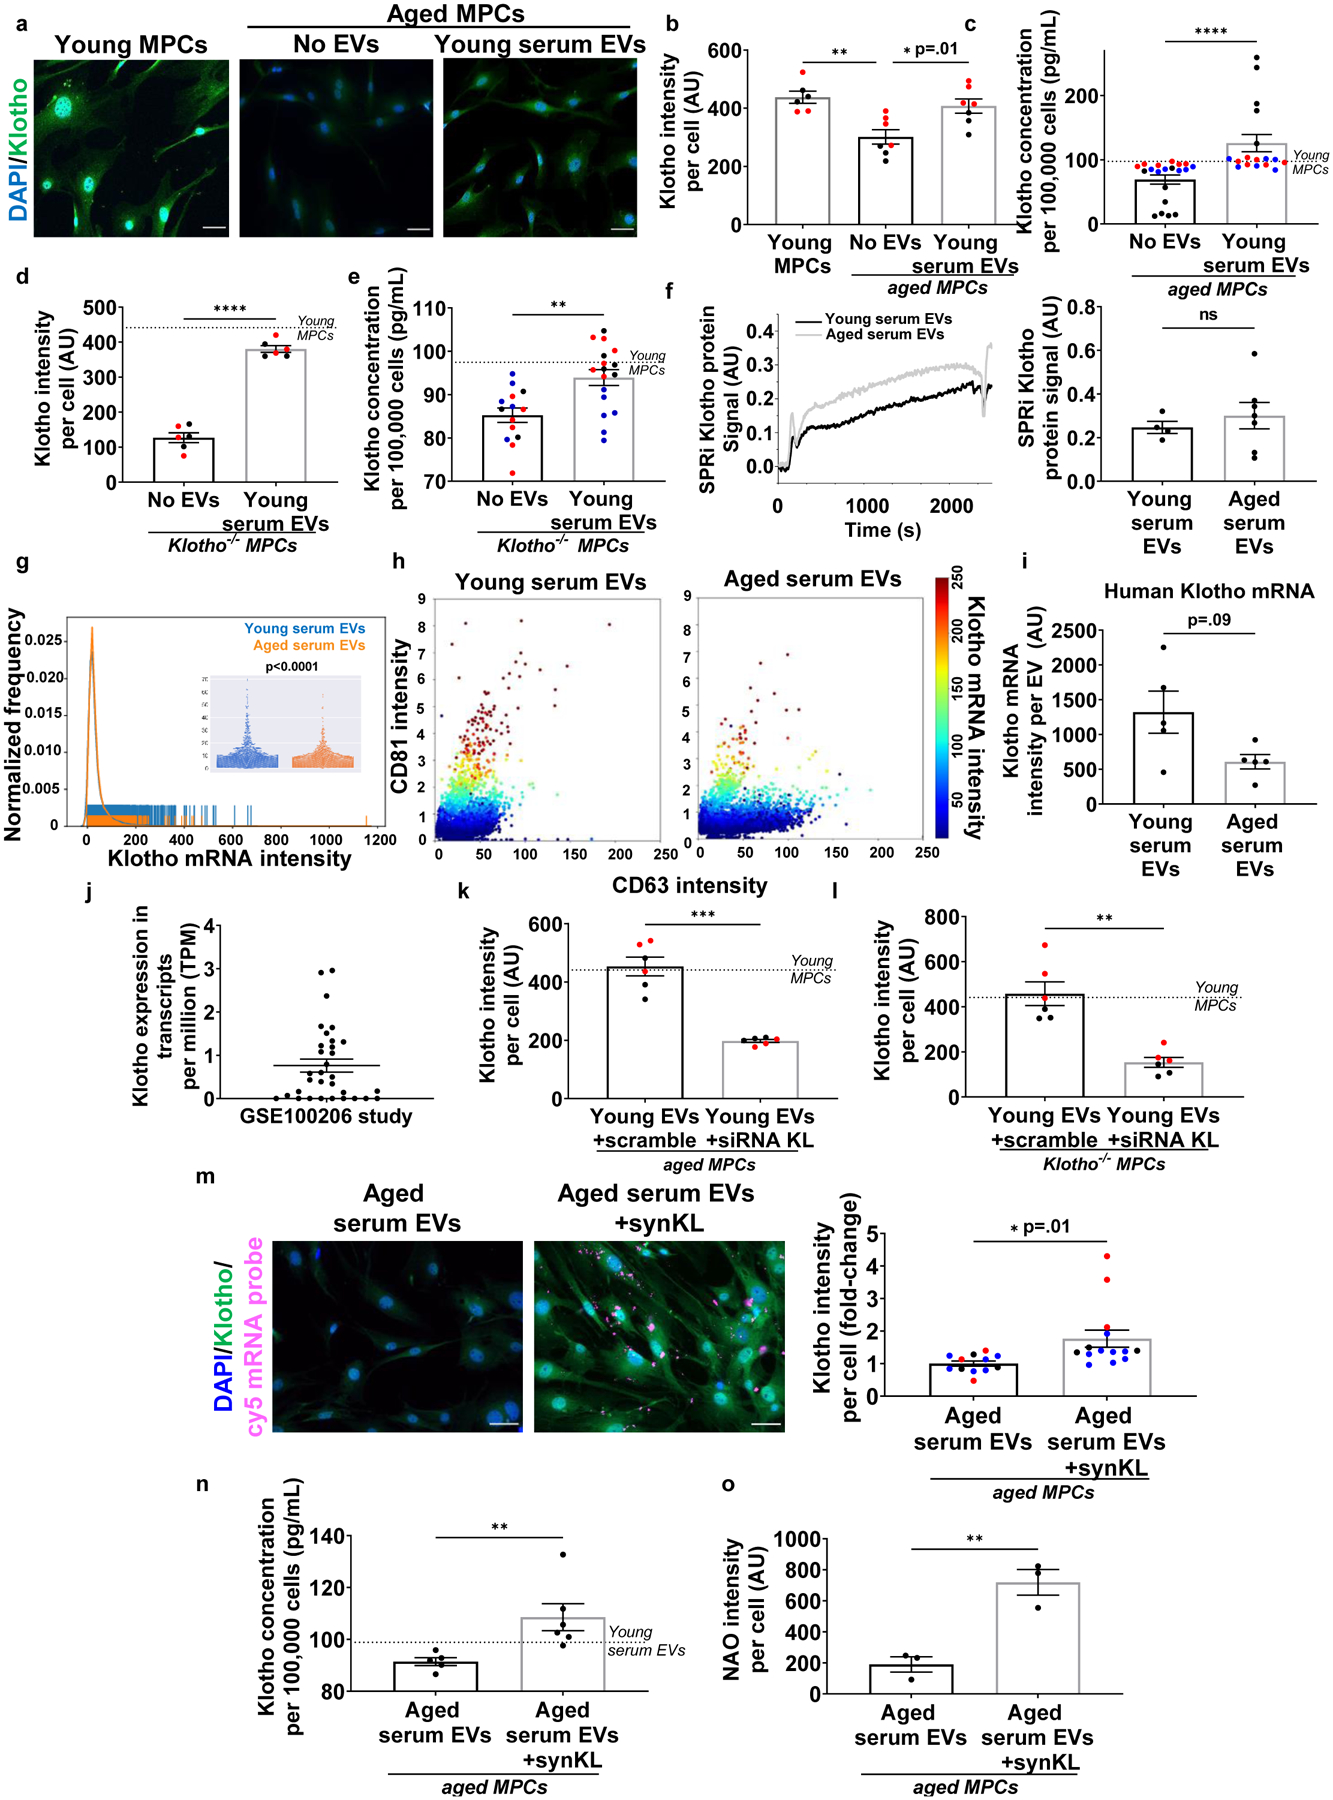
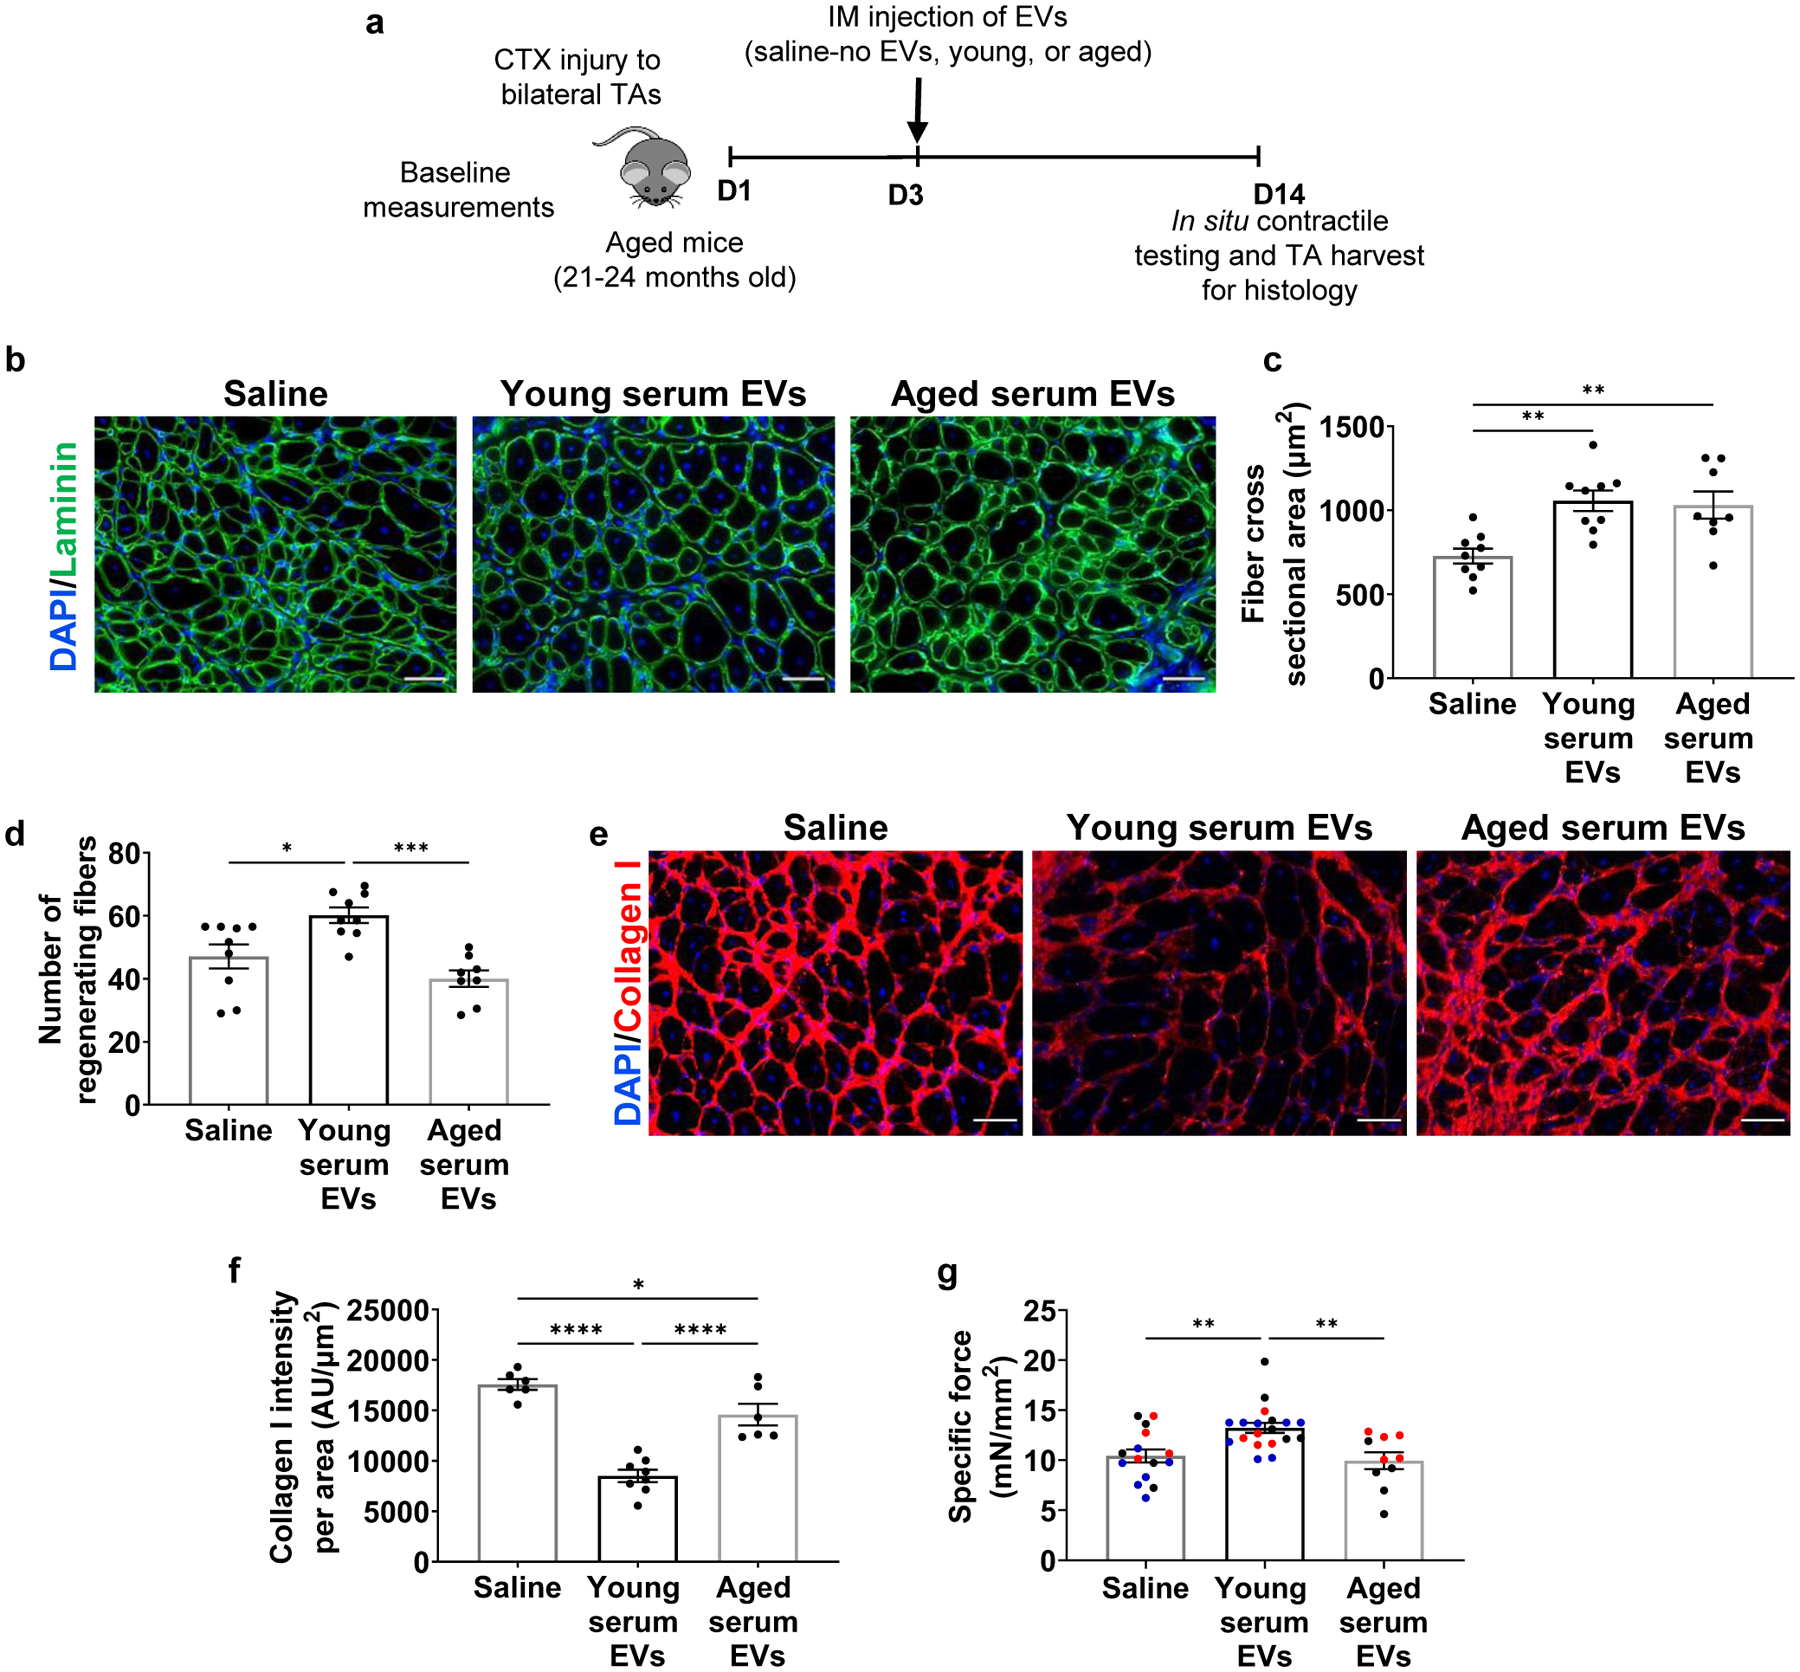
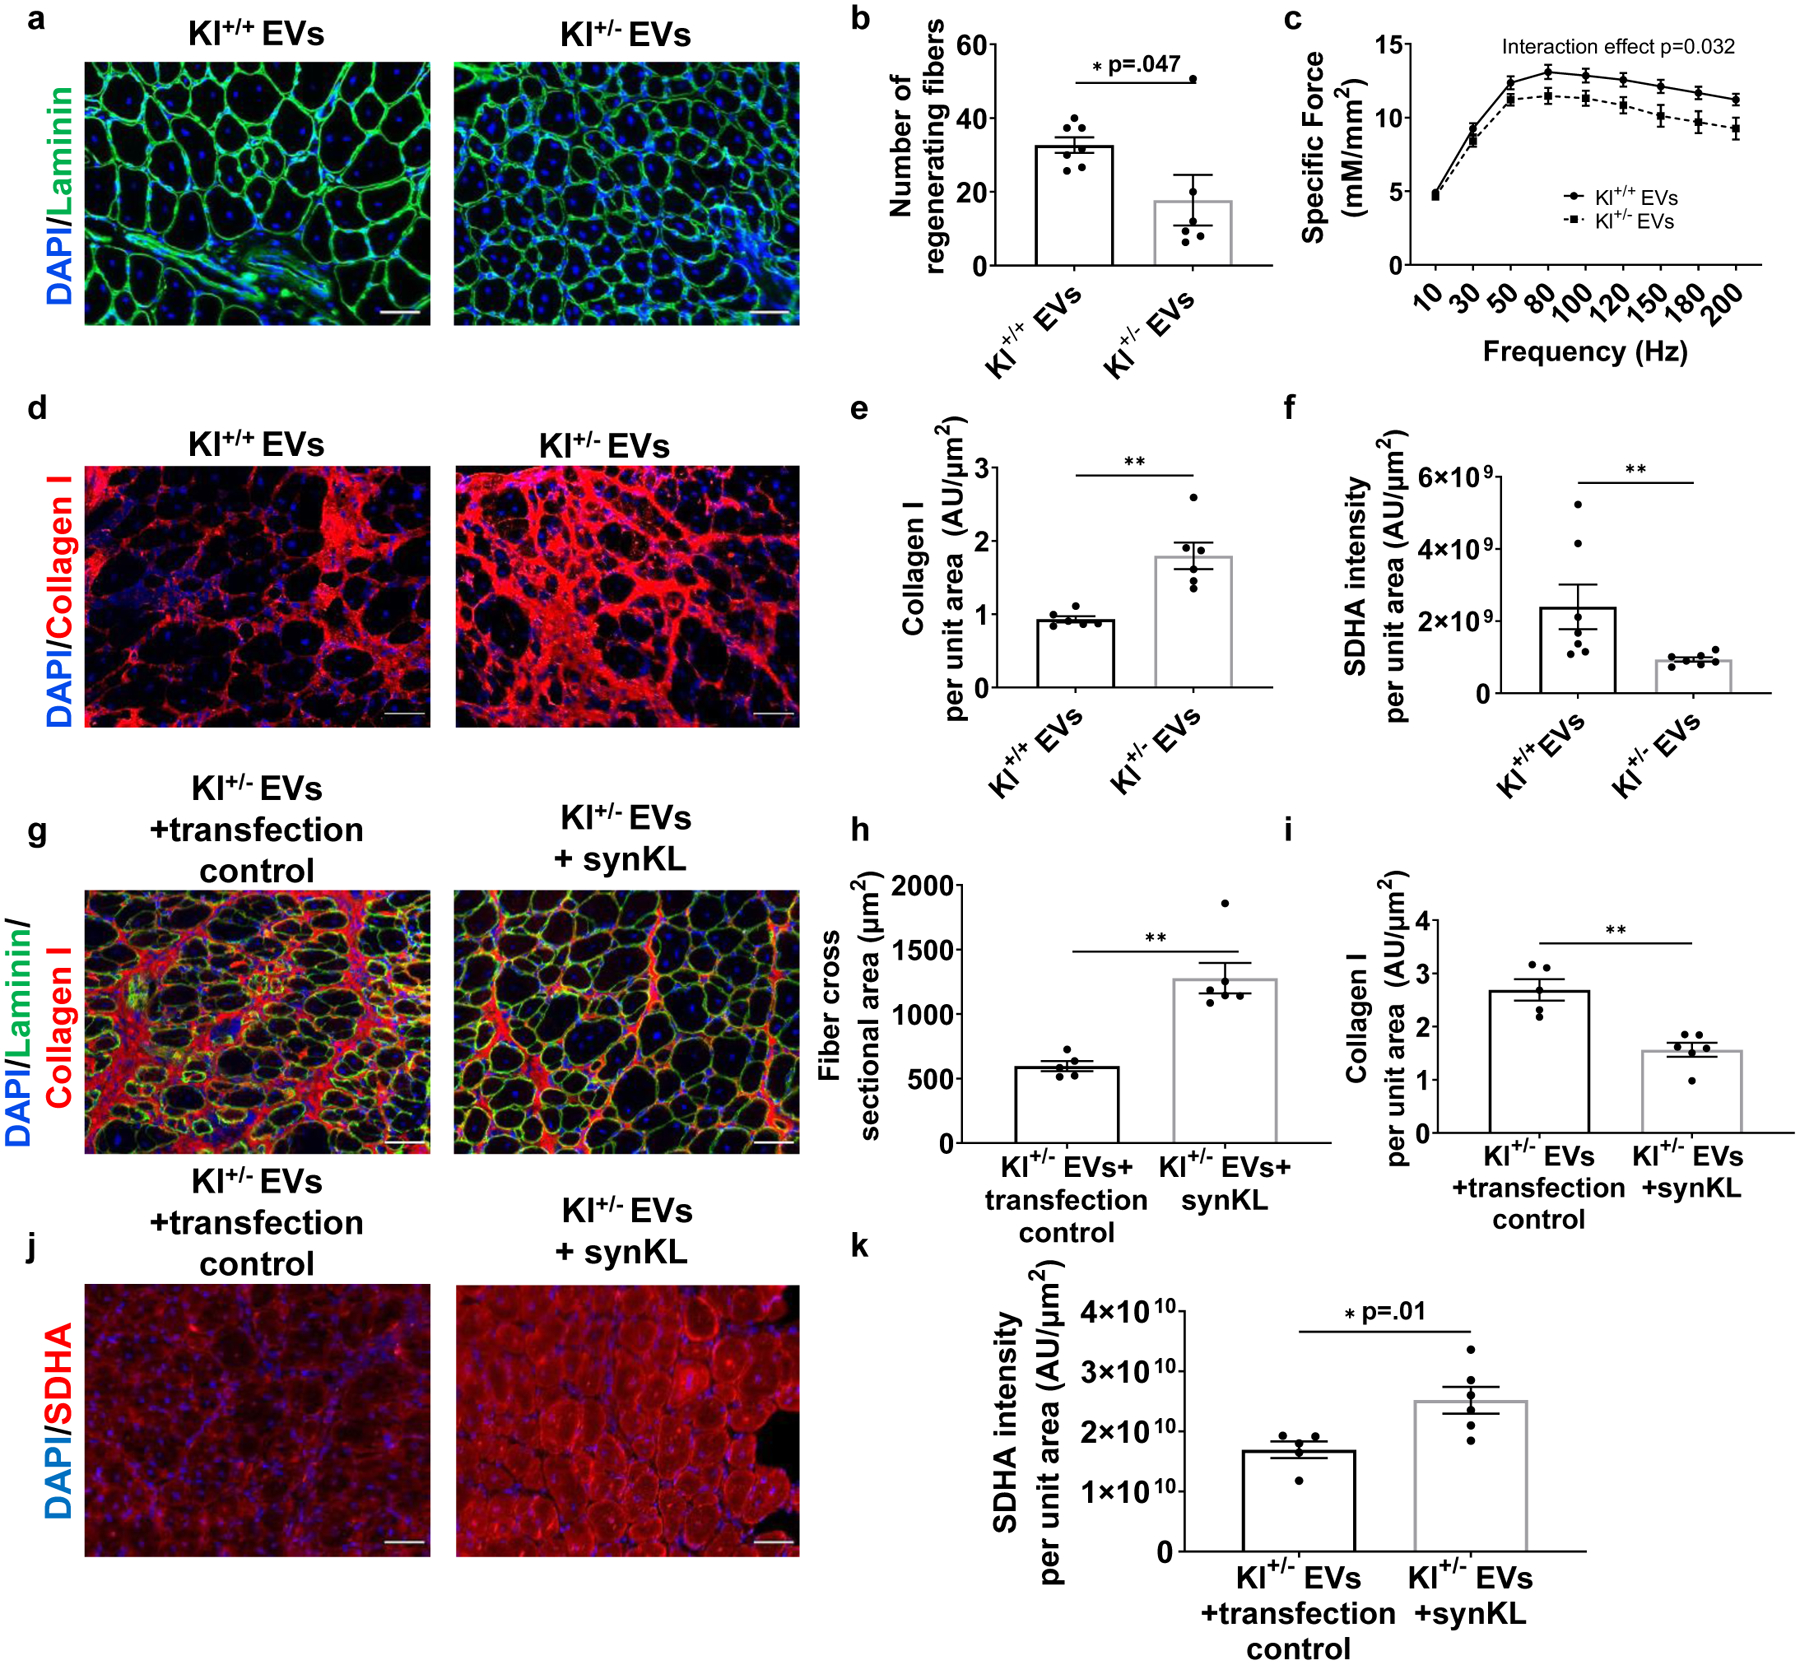
Heterochronic blood exchange (HBE) has demonstrated that circulating factors restore youthful features to aged tissues. However, the systemic mediators of those rejuvenating effects remain poorly defined. We show here that the beneficial effect of young blood on aged muscle regeneration was diminished when serum was depleted of extracellular vesicles (EVs). Whereas EVs from young animals rejuvenate aged cell bioenergetics and skeletal muscle regeneration, aging shifts EV subpopulation heterogeneity and compromises downstream benefits on recipient cells. Machine learning classifiers revealed that aging shifts the nucleic acid, but not protein, fingerprint of circulating EVs. Alterations in sub-population heterogeneity were accompanied by declines in transcript levels of the pro-longevity protein, α-Klotho, and injection of EVs improved muscle regeneration in a Klotho mRNA-dependent manner. These studies demonstrate that EVs play a key role in the rejuvenating effects of HBE and that Klotho transcripts within EVs phenocopy the effects of young serum on aged skeletal muscle.


Conflict of interest statement

Competing interests: The authors declare that they have no competing interests.

Figures

Extended Data Fig 1.
Extended Data Fig 1.. Depletion of EVs eliminates the effect of young serum on Pax7 expression of muscle progenitors.
Quantification of Pax7+ in aged MPCs treated with aged serum, young serum, or EV-depleted aged or young serum. Scale: 50 μm. (****p<0.0001, two-tailed Mann-Whitney test comparing depleted young serum and young serum treatments). Data presented as mean ± SEM. Data from different cohorts or experimental groups performed on different days are presented within the same graph as black or red circles.
Extended Data Fig 2.
Extended Data Fig 2.. The ability of EVs to modulate target cell Klotho and MyoD protein levels is dependent on Klotho mRNAs.
a, Imaging and quantification of Klotho protein in aged MPCs following culture in the presence of young or aged EVs for 24 hours. Scale: 50 μm.(n= 6 wells/group performed over two independent experiments, **p<0.01, two-tailed Welch’s t-test). b, Representative violin plot of Klotho protein intensity per EV from young and aged serum, using imaging flow cytometry. (n=11,229–11,685 EVs/group for this experimental run. EVs pooled from 4 young and 4 aged serum samples, p>0.05, two-tailed Mann Whitney test, experiment repeated in triplicates). Violin plot minima, maxima, median, 25th percentile and 75th percentile are 0, 272915.9, 0, 0, and 26.36 for young, and 0, 272241.3, 0, 0, and 23.2 for aged respectively. c, Quantification of MyoD+ (%), desmin+ (%), and ki67+(%) aged MPCs receiving young serum EVs treated with scramble or siRNA to Klotho or d, aged serum EVs or aged serum EVs loaded with synthetic Klotho mRNA.(MyoD and desmin (scramble, siRNA), desmin (aged EVs, synKL): **p<0.01, ***p<0.001, ****p<0.0001, two-tailed t-test with Welch’s correction, n=5–6 wells/group; MyoD (aged EVs, synKL, **p<0.01, two-tailed Mann Whitney test, n=5 wells/group), ki67 (scramble, siRNA and aged EVs, synKL, p>0.05 (p=0.1), two-tailed Mann Whitney test). Data presented as mean ± SEM. Data from different cohorts or experimental groups performed on different days are presented within the same graph as black or red circles.
Fig. 1.
Fig. 1.. The beneficial effect of young serum on aged muscle progenitors is dependent on circulating EVs
a, Immunofluorescent imaging of MyoD (red) and nuclei (DAPI; blue) in aged MPCs cultured with serum from aged or young mice. Scale: 25 μm. Quantification of b, MyoD and c, desmin (b: ***p < 0.0001, two-tailed Welch’s t-test, n=6 wells/group. c: **p<0.01, two-tailed Mann-Whitney test, n=5 wells/group). d, Quantification of oxygen consumption rates (OCR) of MPCs cultured in the presence of aged or young serum. The experiment was repeated in triplicate. Data presented were taken from one representative experiment (**p<0.01, two-tailed Student’s t test, 3–4 wells/group averaged over n=3 time points prior to oligomycin treatment). e, Immunofluorescent imaging and f, quantification of cardiolipin (NAO; green) and nuclei (DAPI; blue) in aged MPCs cultured with young or aged serum. Scale bar: 50 μm (*p < 0.05, two-tailed Mann Whitney test, n=7 (aged serum), 8 (young serum) wells). Quantification of g, MyoD (#p<0.05, ****p<0.0001 when compared to age-matched controls from figure 1B, two-tailed student’s t-test, n=8 wells/group) and h, desmin (**p<0.05, ***p<0.001 when compared to age-matched controls from figure 1c, two-tailed student’s t-test, n=5 wells/group) in cells treated with young or aged serum depleted of EVs. i, Representative bioenergetic profiles of aged cells treated with young or aged serum with or without EVs (n=3 independent experiments). j, Seahorse analysis of aged MPCs treated with young and aged serum depleted of EVs (*p<0.05, **p<0.01, ****p<0.0001, one-way ANOVA with Tukey’s multiple comparisons). Data presented as mean ± SEM of n=3 time points prior to oligomycin treatment, performed in 4–8 wells/group, as shown in figure 1i. The experiment was repeated in triplicate, and one experimental set of data is presented. Data are presented as mean ± SEM. Data from different cohorts or experimental groups performed on different days are presented within the same graph as black or red circles.
Fig. 2.
Fig. 2.. The beneficial effect of young serum on aged muscle regeneration and mitochondrial function is dependent, at least in part, on circulating EVs.
a, Schematic of the experimental paradigm for muscle functional recovery after serum injections. b, Quantification and c, representation of cross-sectional area of muscle fibers (Laminin; green) and nuclei (DAPI; blue). Scale: 50 μm. (*p<0.05, n=7/group, one-way ANOVA with Tukey’s multiple comparisons). d, Comparison of peak specific force across the three experimental groups (*p<0.05, n=9 (Sham), 11 (Young serum), 12 (Depleted young serum), one-way ANOVA with Tukey’s multiple comparisons). e, Representation and f, quantification of SDHA in regenerating myofibers of injured muscles receiving sham, young serum, or EV-depleted young serum treatments. (SDHA; green) and nuclei (DAPI; blue) (*p<0.05, **p<0.01, n=6/group, non-parametric ANOVA with Dunn’s multiple comparisons). g, LiCOR imaging and h, quantification of intensity of labeled EVs in uninjured and injured TAs receiving saline or dyed EVs in the circulation. The experiment was repeated in duplicate. i, Quantification of intensity of labeled EVs in muscle using scanned images of TA muscles by LiCOR Odyssey equipment. (****p<0.0001, one-way ANOVA with Tukey’s multiple comparisons, n=4/group). i, Representative image of MyoD+ cells co-localizing with PKH26 dyed EVs at the site of injury 48 hours after EV injection. The immunofluorescence staining was repeated in duplicate by two independent investigators. Scale: 25 μm. Data presented as mean ± SEM. Data from different cohorts or experimental groups performed on different days are presented within the same graph as black or red circles.
Fig. 3.
Fig. 3.. Aging shifts EV subpopulation heterogeneity and disrupts the biochemical fingerprint of EVs.
a, Quantification of MyoD-positive aged MPCs treated with young or aged serum EVs (*p<0.05, two-tailed Welch’s t-test, n=6 (Aged),7(Young) wells). b, Quantification of cardiolipin content (NAO) of aged MPCs following exposure to young or aged EVs (**p<0.01, two-tailed Student’s t-test, 3 wells/group, data representative of two independent experiments). c, Representative histogram and quantification of nanoparticle concentration in young and aged serum EVs (**p<0.01, two-tailed Welch’s test, n=6 (Young), 8 (Aged) samples). d, Classical computer vision-based filtering of imaging flow cytometry images of EVs based on the bright-field channel. e, Elbow plot of gradient-boosted decision tree classifier derived feature importance ranks to discriminate EVs based on age. Features used were based on size (area, aspect ratio), signal strength (intensity) and texture (modulation) of the EVs in the bright-field, CD63, CD81 and PKH26 image channels. Rug plots and beeswarm plots (inset) for f, CD63 intensity (p<0.0001, n=6417–13077 EVs per group for this experimental run, EVs pooled from 4 serum samples of both young and aged animals, two-tailed Mann Whitney test, experiment repeated in triplicates) and g, CD81 intensity for young and aged serum EVs. (p<0.0001, n=6417 (young),13077 (aged) EVs for this experimental run, EVs pooled from 4 serum samples of both young and aged animals, two-tailed Mann Whitney test, experiment repeated in triplicates). h, Average Raman spectra with standard deviation (grey band) of young and aged serum EVs. i, Subtraction spectrum of the differences between the average spectra acquired for young and aged serum EVs. j, Principal Component Analysis (PCA) with 95% confidence interval and k, Linear Discriminant Analysis of spectra data acquired from aged and young serum EVs (n=5 samples/group; ***p<0.001, two-tailed Mann Whitney test). Minima, maxima, median, 25th percentile and 75th percentile: 0.46324, 5.082, 2.85669, 2.09799, 3.45523 (young serum EVs); −5.67133, 0.48193, −3.35317, −3.60656 and −2.9319 (aged serum EVs). Boundaries determined using inter-quartile range with 1.5 as coefficient: 1.35723 for young serum EVs and 0.67466 for aged serum EVs. Data presented as mean ± SEM.
Fig. 4.
Fig. 4.. Transcriptomic alterations in skeletal muscle with young serum treatment are predominated by EVs.
a, Schematic of the experimental paradigm for RNAseq analyses after serum injections. b, Linear Discriminant Analysis (LDA) of RNA-seq data acquired from injured aged skeletal muscles receiving sham, young serum, or EV-depleted young serum injections. c, Venn diagram displaying overlap of global differentially expressed (DE) genes when comparing young serum vs. sham and EV-depleted young serum vs. sham (Log fold change magnitude 0.1, false discovery rate magnitude 0.1). d, Gene ontology (GO) terms for highly differentially expressed due to the presence of EVs in young serum (log fold change magnitude higher than 1.5, false discovery rate magnitude lesser than 0.1).
Fig. 5.
Fig. 5.. Klotho transcripts in EVs decline over time and are preferentially contained within EVs with high expression of the CD81 surface marker.
a, Imaging and b, quantification of Klotho (green) in MPCs cultured in the presence or absence of young EVs in culturing media. Scale bar: 50 μm. (*p<0.05, **p<0.01, one-way ANOVA with Tukey’s multiple comparisons, n= 6 (Young MPCs), 7 (No EVs), 7 (Young serum EVs) wells). c, Quantification of secreted Klotho in conditioned media of aged MPCs treated with or without young EVs (****p < 0.01, two-tailed Mann Whitney test, n=11 (No EVs), 20 (Young serum EVs)). d, Klotho quantification in Klotho−/− MPCs in the presence of no EVs or young EVs (****p<0.0001, two-tailed Welch’s t-test, n=6 wells/group). e, Quantification of secreted Klotho in culture media of Klotho−/− MPCs in the presence or absence of young EVs (***p<0.001, two-tailed Welch’s test, n=14 (No EVs), 17 (Young serum EVs)). f, Surface Plasmon Resonance imaging (SPRi) and analysis of Klotho protein in young and aged serum EVs. (p>0.05, two-tailed Student’s t test, n=4 (Young), 7(Aged)). g, Rug plot with beeswarm plot of Klotho mRNAs in young and aged serum EVs. h, 3D-plots of Klotho mRNA distribution in CD63 and CD81 positive circulating EVs. i, Klotho mRNAs quantification in young and aged human serum EVs. (p>0.05, two-tailed Welch’s t-test, n=5/group) j, Human EV-Klotho mRNA quantification in publicly archived dataset (n=32). k, Klotho quantification in aged MPCs receiving young EVs treated with either non-targeting siRNA (scramble) or siRNA to Klotho (***p<0.001, two-tailed Welch’s t-test, n=6 wells/group, repeated in two independent experiments). l, Klotho quantification in Kl−/− MPCs receiving young EVs treated either with a non-targeting siRNA (scramble) or siRNA to Klotho (***p<0.001, two-tailed Welch’s t-test, n=6 wells/group, repeated in two independent experiments). m, Imaging and quantification of Klotho protein (green) in aged MPCs receiving aged EVs engineered with synthetic Klotho mRNA (pink). Scale: 50 μm. (*p<0.05, two-tailed Welch’s t-test, n=12 (aged EVs), 14 (aged EVs+synKL) wells, presented as fold change over aged serum EVs per experiment). n, Klotho quantification in conditioned media of aged MPCs administered with aged EVs or aged EVs engineered with synthetic Klotho mRNA (**p<0.01, two-tailed Student’ t test, n=5 (aged EVs), 6 (aged EVs+synKL)). o, Cardiolipin (NAO) quantification in aged MPCs treated with aged EVs or aged EVs engineered with synthetic mRNA (**p<0.01, two-tailed Mann Whitney test, n=3 wells/group, data representative of one of the two independent experiments). Data presented as mean ± SEM and different cohorts performed on different days presented within the same graph as black, red, or blue circles.
Fig. 6.
Fig. 6.. EV age impacts skeletal muscle regeneration and function.
a, Schematic of the in vivo administration of EVs to injured aged mice. b, Representative images of laminin (green) and c, histological analysis of fiber cross-sectional area of injured TAs of aged mice receiving saline, young, or aged EVs. (**p<0.01, one-way ANOVA with Tukey’s multiple comparisons, n=8–9/group). Scale: 50 μm. d, Quantification of number of regenerating fibers in injured TAs of aged mice receiving saline, young serum EVs, or aged serum EVs (***p<0.001, *p<0.01, one-way ANOVA with Tukey’s multiple comparisons, n=8 (aged), 9 (saline, young)). e, Representative images of Collagen I in injured muscle cross-sections of aged mice receiving saline, young, or aged EVs. f, Histological analysis of Collagen I in injured muscle cross-sections of aged mice receiving young or aged EVs when compared to saline-injected controls (*p<0.05, ****p<.0001, one-way ANOVA with Tukey’s multiple comparisons, n=6 (saline, aged), 8 (young)). Scale: 50 μm. g, Specific tetanic force of aged animals receiving intramuscular injections of saline, young, or aged EVs. (**p<0.01, one-way ANOVA with Tukey’s multiple comparison, n=10 (aged), 15 (saline), 19 (young)). Data presented as mean ± SEM. Data from different cohorts or experimental groups performed on different days are presented within the same graph as black, blue, or red circles.
Fig. 7.
Fig. 7.. Klotho mRNA within EVs contribute to functional skeletal muscle regeneration.
a, Representative images of fibers (Laminin) of injured aged TAs receiving Klotho+/+ or Klotho+/− serum EVs. Scale: 50 μm. b, Number of regenerating fibers greater than 600μm2 in injured TAs of aged mice receiving Klotho+/+ or Klotho+/− serum EVs. (*p<0.05, two-tailed Mann Whitney test, n=6 (Kl+/−), 7 (Kl+/+)). c, Specific tetanic force frequency curves of aged animals receiving EVs isolated from Klotho+/+ or Klotho+/− serum (two-way mixed ANOVA, repeated measures with frequency, interaction effect of frequency and experimental group p=0.032, n=18 (Kl+/+), 20(Kl+/−)). d, Representative images of Collagen I in injured muscles of aged mice receiving Klotho+/+ or Klotho+/− serum EVs. Scale: 50 μm. e, Quantification of Collagen I in injured muscle cross-sections of aged mice receiving Klotho+/+ or Klotho+/− serum EVs. (**p<0.01, two-tailed Welch’s t-test, n=6/group). f, Quantification of SDHA of regenerating myofibers in injured TAs of aged mice receiving Klotho+/+ or Klotho+/− serum EVs. (**p<0.01, two-tailed Mann Whitney test, n=7/group). g, Representative images and histological analysis of h, fiber cross-sectional area and i, collagen I of injured TAs of aged mice receiving Klotho+/− serum EVs loaded with transfection control or synthetic Klotho mRNA. (h: **p<0.01, two-tailed Mann Whitney test; i: **p<0.01, two-tailed Mann Whitney test; n=5 (Kl+/− EVs+transfection control), 6 (Kl+/− EVs+ synKL)). Scale: 50 μm. j, Imaging and k, quantification of SDHA in regenerating myofibers at the site of injury receiving Klotho+/− serum EVs loaded with transfection control or synthetic Klotho mRNA. (*p<0.05, two-tailed Welch’s t-test, n=5 (Kl+/− EVs+transfection control), 6 (Kl+/− EVs+ synKL)). Data presented as mean ± SEM.

Comment in

References

    1. Conboy MJ, Conboy IM & Rando TA Heterochronic parabiosis: historical perspective and methodological considerations for studies of aging and longevity. Aging cell 12, 525–530, doi: 10.1111/acel.12065 (2013). - DOI - PMC - PubMed
    1. Conboy IM et al. Rejuvenation of aged progenitor cells by exposure to a young systemic environment. Nature. 433.(7027.):760.–4 (2005). - PubMed
    1. Brack AS et al. Increased Wnt signaling during aging alters muscle stem cell fate and increases fibrosis. Science. 317.(5839.):807.–10 (2007). - PubMed
    1. Sousa-Victor P et al. MANF regulates metabolic and immune homeostasis in ageing and protects against liver damage. Nat Metab 1, 276–290, doi: 10.1038/s42255-018-0023-6 (2019). - DOI - PMC - PubMed
    1. Li L et al. Impairment of chondrocyte proliferation after exposure of young murine cartilage to an aged systemic environment in a heterochronic parabiosis model. Swiss Med Wkly 148, w14607, doi: 10.4414/smw.2018.14607 (2018). - DOI - PMC - PubMed

Publication types