Review
. 2022 Dec;62(12):1480-1500.
doi: 10.1002/jcph.2095. Epub 2022 Jul 1.

ECG Evaluation as Part of the Clinical Pharmacology Strategy in the Development of New Drugs: A Review of Current Practices and Opportunities Based on Five Case Studies

Affiliations
Review

ECG Evaluation as Part of the Clinical Pharmacology Strategy in the Development of New Drugs: A Review of Current Practices and Opportunities Based on Five Case Studies

Borje Darpo et al. J Clin Pharmacol. 2022 Dec.

Abstract

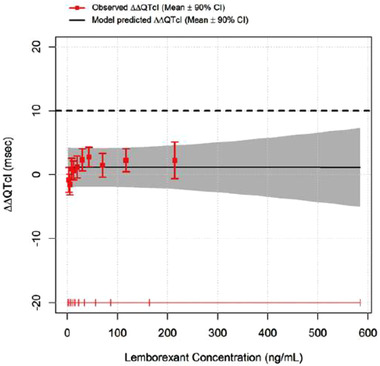
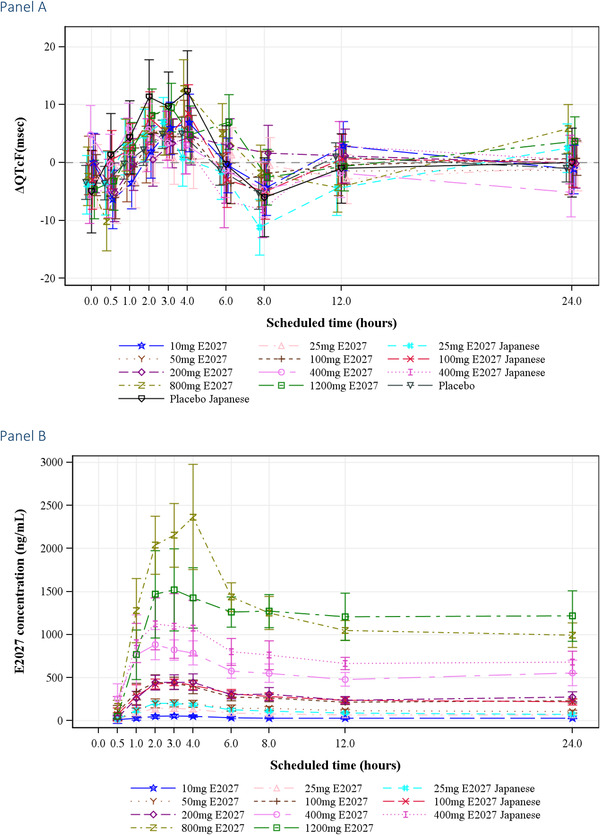
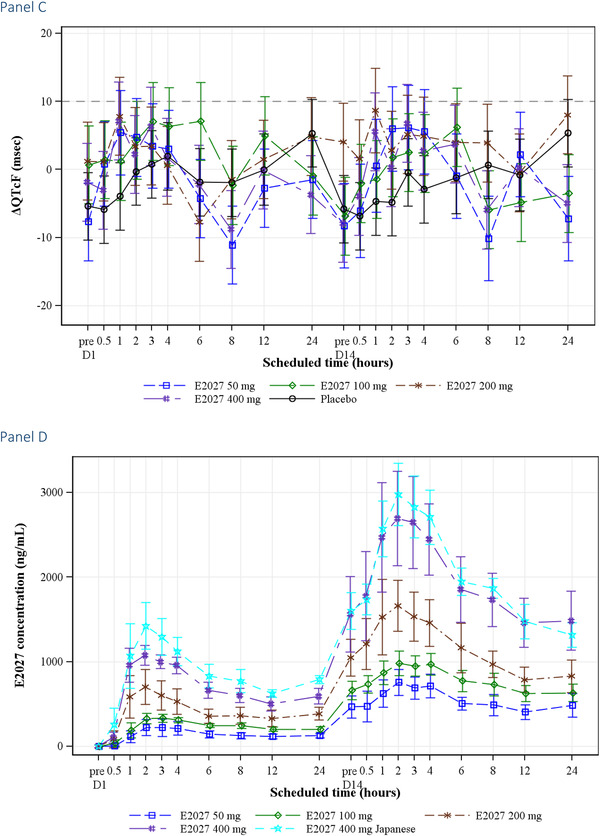
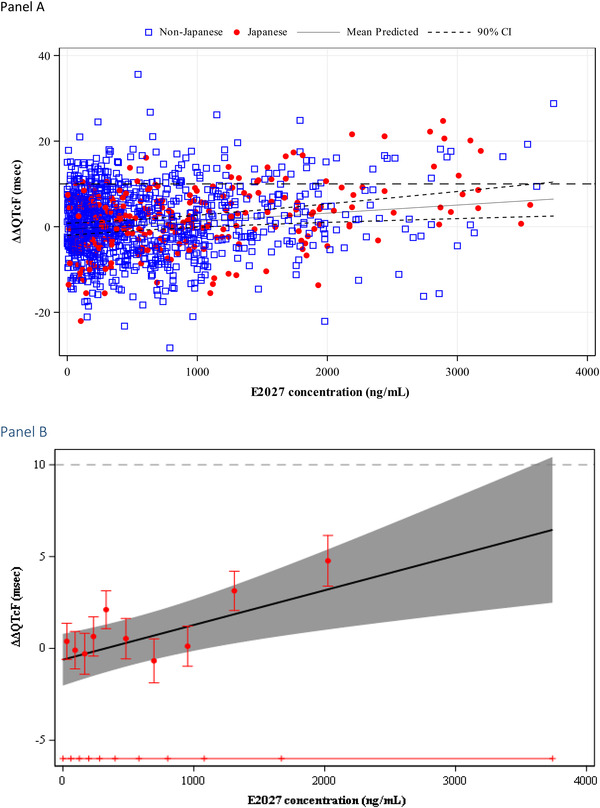
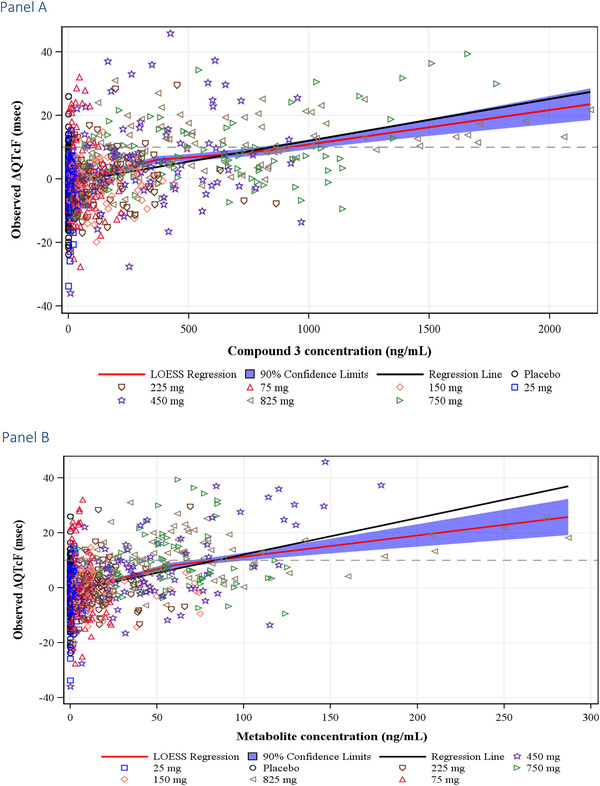
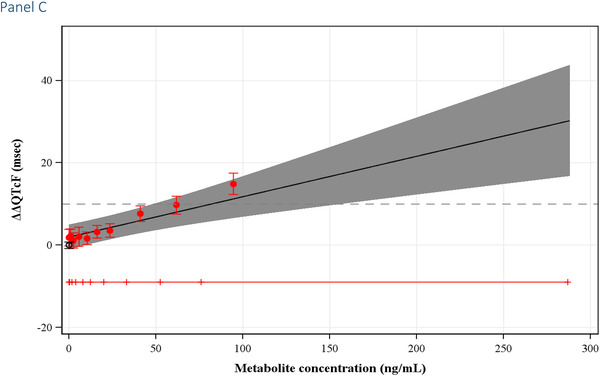
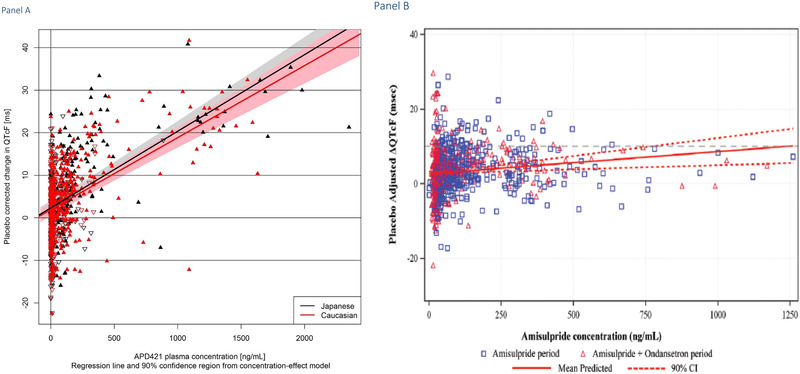
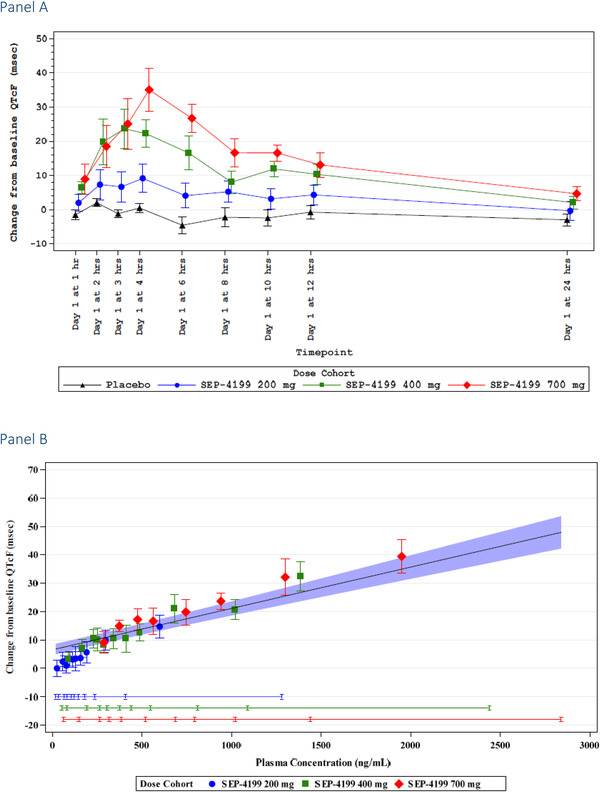
The International Conference on Harmonization (ICH) E14 document was revised in 2015 to allow concentration-corrected QT interval (C-QTc) analysis to be applied to data from early clinical pharmacology studies to exclude a small drug-induced effect on QTc. Provided sufficiently high concentrations of the drug are obtained in the first-in-human (FIH) study, this approach can be used to obviate the need for a designated thorough QT (TQT) study. The E14 revision has resulted in a steady reduction in the number of TQT studies and an increased use of FIH studies to evaluate electrocardiogram (ECG) effects of drugs in development. In this review, five examples from different sponsors are shared in which C-QTc analysis was performed on data from FIH studies. Case 1 illustrates a clearly negative C-QTc evaluation, despite observations of QTc prolongation at high concentrations in nonclinical studies. In case 2 C-QTc analysis of FIH data was performed prior to full pharmacokinetic characterization in patients, and the role of nonclinical assays in an integrated risk assessment is discussed. Case 3 illustrates a positive clinical C-QTc relationship, despite negative nonclinical assays. Case 4 demonstrates a strategy for characterizing the C-QTc relationship for a nonracemic therapy and formulation optimization, and case 5 highlights an approach to perform a preliminary C-QTc analysis early in development and postpone the definitive analysis until proof of efficacy is demonstrated. The strategy of collecting and storing ECG data from FIH studies to enable an informed decision on whether and when to apply C-QTc analysis to obviate the need for a TQT study is described.

Keywords: E14; ICH; QT; clinical pharmacology; exposure response analysis; healthy subjects.


Conflict of interest statement

BD is Chief Scientific Officer of Clario and owns stock and is eligible for stock options in Clario. MB is a paid consultant for Theravance Biopharma.

Figures

Figure 1
Figure 1
Lemborexant C–QTc analysis on data from two MAD studies. Goodness‐of‐fit plot for observed QTc values and predicted relationship between lemborexant plasma levels and ΔΔQTcI on pooled data from an FIH MAD study and a Japanese bridging MAD study. Red squares with vertical bars denote the observed mean ΔΔQTcI with 90%CI displayed at the median plasma concentration within each decile. The solid black line with gray‐shaded area denotes the C–QTc model‐predicted mean ΔΔQTcI with 90%CI. The horizontal red lines with notches show the range of plasma concentrations divided into deciles. (Figure 3B in Murphy et al. Reproduced with permission from the authors.)
Figure 2
Figure 2
E2027. (A) SAD ΔQTcF across dose groups and time points. The pattern of ΔQTcF across dose groups, including the pooled placebo group, does not suggest that single doses of E2027 prolongs the QTc interval in a dose‐dependent way. Mean ± 90%CI ΔQTcF across postdose time points. (B) SAD E2027 plasma concentration profile across dose groups. The highest concentrations were observed between 2 and 4 hours postdose in the highest dose groups (400, 800, and 1200 mg). Mean concentrations were higher in the E2027 800 mg dose group than in the 1200 mg group, probably as a result of limited absorption and variability within small dose groups. Mean ± 90%CI, calculated from descriptive statistics. (C) MAD ΔQTcF across dose groups and time points. Mean ± 90%CI ΔQTcF across postdose time points. (D) MAD plasma concentration profile across dose groups Substantial accumulation was observed with multiple dosing. E2027 concentrations on day 14 were similar between Japanese and non‐Japanese subjects in the 400 mg groups. Mean ± 90%CI, calculated from descriptive statistics.
Figure 2
Figure 2
E2027. (A) SAD ΔQTcF across dose groups and time points. The pattern of ΔQTcF across dose groups, including the pooled placebo group, does not suggest that single doses of E2027 prolongs the QTc interval in a dose‐dependent way. Mean ± 90%CI ΔQTcF across postdose time points. (B) SAD E2027 plasma concentration profile across dose groups. The highest concentrations were observed between 2 and 4 hours postdose in the highest dose groups (400, 800, and 1200 mg). Mean concentrations were higher in the E2027 800 mg dose group than in the 1200 mg group, probably as a result of limited absorption and variability within small dose groups. Mean ± 90%CI, calculated from descriptive statistics. (C) MAD ΔQTcF across dose groups and time points. Mean ± 90%CI ΔQTcF across postdose time points. (D) MAD plasma concentration profile across dose groups Substantial accumulation was observed with multiple dosing. E2027 concentrations on day 14 were similar between Japanese and non‐Japanese subjects in the 400 mg groups. Mean ± 90%CI, calculated from descriptive statistics.
Figure 3
Figure 3
E2027. (A) Scatter plot on data from both SAD and MAD. The blue squares and red filled circles denote the pairs of observed E2027 plasma concentrations and ΔΔQTcF (derived from the individual ΔQTcF for the active subtracted by the mean predicted ΔQTcF for placebo from the model) for the non‐Japanese (blue) and Japanese (red) subjects, respectively. The black solid and dashed lines denote the model‐predicted mean ΔΔQTcF with 90%CI. (B) Goodness‐of‐fit plot for observed ΔΔQTc and predicted ΔΔQTcF on pooled data from the E2027 FIH SAD and MAD study in Japanese and non‐Japanese healthy subjects. Red circles with vertical bars denote the observed mean ΔΔQTcF with 90%CI displayed at the median plasma concentration within each decile. The solid black line with gray‐shaded area denotes the C–QTc model‐predicted mean ΔΔQTcF with 90%CI. The horizontal red lines with notches show the range of E2027 plasma concentrations divided into deciles.
Figure 4
Figure 4
Compound 2. (A) ΔQTcF across dose groups and time points Mean with 90%CI ΔQTcF across postdose time points. (B) Plasma concentration profile across dose groups. Mean with 90%CI calculated from descriptive statistics.
Figure 5
Figure 5
Compound 2. (A) Scatter plot with linear and local regression. The red line with the blue shaded area denotes the LOESS regression and 90%CI. The black solid line denotes the simple linear regression line. The plotted points denote the pairs of observed compound 2 plasma concentrations and ΔQTcF. The linear regression line falls within the 90%CI of LOESS in most of the concentration range, thereby illustrating that a linear model captures the data across the concentration range in an acceptable way. (B) Goodness‐of‐fit plot for observed ΔΔQTcF and predicted ΔΔQTcF on data from the compound 2 FIH SAD study in healthy subjects. Red circles with vertical bars denote the observed mean ΔΔQTcF with 90%CI displayed at the median plasma concentration within each concentration decile for compound 2. The solid black line with gray shaded area denotes the model‐predicted mean ΔΔQTcF with 90%CI. The horizontal red line with notches shows the range of concentrations divided into deciles for compound 2.
Figure 6
Figure 6
Compound 3. (A) ΔQTcF across dose groups and time points. Mean with 90%CI ΔQTcF across postdose time points. (B) Compound 3 plasma concentration profile across dose groups. Mean ± SD calculated from descriptive statistics. (C) Metabolite plasma concentration profile across dose groups. Mean ± SD calculated from descriptive statistics.
Figure 6
Figure 6
Compound 3. (A) ΔQTcF across dose groups and time points. Mean with 90%CI ΔQTcF across postdose time points. (B) Compound 3 plasma concentration profile across dose groups. Mean ± SD calculated from descriptive statistics. (C) Metabolite plasma concentration profile across dose groups. Mean ± SD calculated from descriptive statistics.
Figure 7
Figure 7
Compound 3. (A) Scatter plot with linear and local regression for the parent drug. The plotted points denote the pairs of observed compound 3 plasma concentrations and ΔQTcF. The red line with the blue shaded area denotes the LOESS regression and 90%CI. The black solid line denotes the simple linear regression line. The linear regression captures the data across the concentration range in an acceptable way. (B) Scatter plot with linear and local regression for the metabolite. The linear regression line falls outside and above the LOESS 90%CI, suggesting that simple linear regression may overestimate the effect on ΔΔQTc at higher concentration levels. (C) Goodness‐of‐fit plot for observed ΔΔQTcF and predicted ΔΔQTcF on data with the metabolite from the compound 3 FIH SAD study in healthy subjects. It seems that the model to some extent underestimates the observed data at high concentrations. Symbols are as described in Figure 5.
Figure 7
Figure 7
Compound 3. (A) Scatter plot with linear and local regression for the parent drug. The plotted points denote the pairs of observed compound 3 plasma concentrations and ΔQTcF. The red line with the blue shaded area denotes the LOESS regression and 90%CI. The black solid line denotes the simple linear regression line. The linear regression captures the data across the concentration range in an acceptable way. (B) Scatter plot with linear and local regression for the metabolite. The linear regression line falls outside and above the LOESS 90%CI, suggesting that simple linear regression may overestimate the effect on ΔΔQTc at higher concentration levels. (C) Goodness‐of‐fit plot for observed ΔΔQTcF and predicted ΔΔQTcF on data with the metabolite from the compound 3 FIH SAD study in healthy subjects. It seems that the model to some extent underestimates the observed data at high concentrations. Symbols are as described in Figure 5.
Figure 8
Figure 8
Amisulpride. (A) C–QTc relationship in a TQT study with amisulpride. Scatter plot of ΔΔQTcF against the amisulpride plasma concentration (ng/ml). Regression lines for amisulpride derived from a linear mixed‐effect model. The 90%CIs are represented by gray shading for the slope in Japanese subjects and red shading for the slope in white subjects. (Figure 3B in Taubel et al British J Clin Pharm 2017;83:338–49, with permission from the publisher, John Wiley and Sons Inc. 22 ) (B) C–QTc relationship in a study with amisulpride alone and in combination with ondansetron. Scatter plot of observed amisulpride plasma concentrations and ΔΔQTcF by subject. The solid red line with dashed red lines denotes the model‐predicted mean ΔΔQTcF with 90%CI using a model with amisulpride as the only analyte. The blue squares and red triangles denote the pairs of observed amisulpride plasma concentrations and ΔΔQTcF by subjects for the amisulpride and amisulpride + ondansetron treatment periods, respectively. (Figure 4A in Fox et al Anesth Analg 2021;132:150–159. 23 )
Figure 9
Figure 9
SEP‐4199. (A) ΔQTcF across dose groups and time points. Mean with 90%CI ΔQTcF across postdose time points. (B) Goodness‐of‐fit plot for observed ΔΔQTcF and predicted ΔΔQTcF on data from an SAD study in healthy subjects with SEP‐4199. The model seems to slightly underestimate the effect on ΔΔQTcF at high concentrations. Symbols are as described in Figure 5.
Figure 10
Figure 10
Nezulcitinib. (A) Placebo‐corrected ΔQTcF across dose groups and time points. Data from safety ECGs and the matched, nearest concentration value in the SAD and MAD cohorts. Mean with 90%CI ΔQTcF across postdose time points. (B) Plasma concentration profile across dose groups in the SAD and MAD cohorts. Mean ± standard deviation of ΔQTcF across postdose time points.
Figure 11
Figure 11
Nezulcitinib. (A) Scatter plot with linear and local regression. The red line with the light‐gray shaded area denotes the LOESS regression and 90%CI. The black solid line denotes the simple linear regression line. The plotted points denote the pairs of observed nezulcitinib plasma concentrations and ΔQTcF pooled from the SAD and MAD portions of the study. (B) Goodness‐of‐fit plot for observed ΔΔQTcF and predicted ΔΔQTcF on data from an SAD study in healthy subjects with nezulcitinib. Symbols are as described in Figure 5.

Similar articles

Cited by

References

    1. ICH E14 . The clinical evaluation of QT/QTc interval prolongation and proarrhythmic potential for nonantiarrhythmic drugs. https://www.ich.org/page/efficacy-guidelines. Accessed June 27, 2022.
    1. ICH E14 . Questions & Answers (R3) December 10, 2015. https://www.ich.org/page/efficacy‐guidelines. Accessed June 27, 2022.
    1. Darpo B, Garnett C. Early QT assessment–how can our confidence in the data be improved? Br J Clin Pharmacol. 2013;76:642–648. - PMC - PubMed
    1. Garnett C, Beasley N, Bhattaram VA, et al. Concentration‐QT relationships play a key role in the evaluation of proarrhythmic risk during regulatory review. J Clin. Pharmacol. 2008;48:13–18. - PubMed
    1. Darpo B, Benson C, Dota C, et al. Results from the IQ‐CSRC prospective study support replacement of the thorough QT study by QT assessment in the early clinical phase. Clin Pharmacol Ther. 2015;97:326–335. - PubMed