. 2022 Aug;247(15):1364-1378.
doi: 10.1177/15353702221098962. Epub 2022 Jun 6.

Intermittent hypoxia promotes the recovery of motor function in rats with cerebral ischemia by regulating mitochondrial function

Affiliations

Intermittent hypoxia promotes the recovery of motor function in rats with cerebral ischemia by regulating mitochondrial function

Yue Su et al. Exp Biol Med (Maywood). 2022 Aug.

Abstract

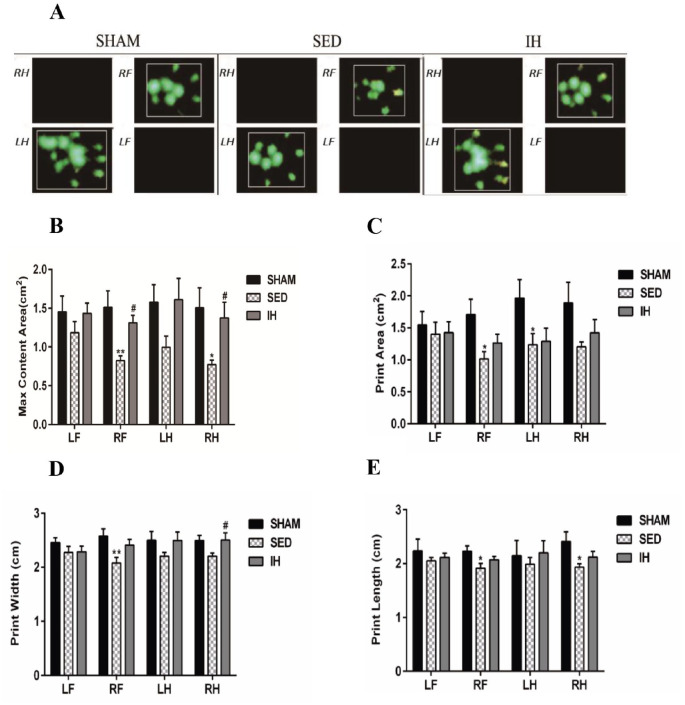
Hypoxia preconditioning is neuroprotective, but the therapeutic effects of intermittent hypoxia were not fully considered. The present study investigated the neuroprotective effect and mechanism of intermittent hypoxia on motor function after cerebral ischemia and explored alternative clinical treatment options. In total, 36 8-week-old male Sprague-Dawley rats were subjected to 60 min of transient middle cerebral artery occlusion (tMCAO) and then randomly divided into a sham-operated group (SHAM), tMCAO-sedentary group (SED), and tMCAO-intermittent hypoxia group (IH). The intervention was performed 1 week after tMCAO and lasted 4 weeks. Rats in the IH group were placed in an animal hypoxic chamber (altitude 5000 m and oxygen concentration of 13%) for 4 h/day and 7 days/week, and rats in the SED group were placed in a normoxic environment for 4 weeks. Body weights, neurological deficit scores, cerebral infarction volume ratios, gait analyses, mitochondrial structure, adenosine triphosphate (ATP) content and AMO-activated protein kinase (AMPK), peroxisome proliferator-activated receptor γ co-activator-1α (PGC-1α), and silencing regulatory protein 3 (Sirt3) expression in the peri-ischemic region brain tissues were detected during the intervention. Compared with the SED group, the body weight of the IH group gradually recovered, and the neurological deficit scores were significantly reduced (P < 0.05). The gait analysis results showed that the pressure of the affected paw and the maximum content area, swing speed, stride length, and other parameters were significantly restored (P < 0.05). The cerebral infarction volume ratio was significantly reduced (P < 0.01). Mitochondrial morphological structure damage in the peri-ischemic region brain tissues recovered, the number was significantly increased (P < 0.05), and the expression of AMPK, PGC-1α, and Sirt3 proteins (P < 0.05), and ATP content were significantly increased (P < 0.05). Intermittent hypoxia may activate the AMPK-PGC-1α-Sirt3 signaling pathway, promote mitochondrial biogenesis, repair mitochondrial ultrastructural damage, and improve mitochondrial function to reduce brain damage and promote motor function recovery in rats with cerebral ischemia.

Keywords: Intermittent hypoxia; cerebral ischemia; mitochondria; motor function.


Conflict of interest statement

Declaration of Conflicting Interests: The author(s) declared no potential conflicts of interest with respect to the research, authorship, and/or publication of this article.

Figures

Figure 1.
Figure 1.
The body weights of rats during and after tMCAO surgery (x ± s, n = 6). tMCAO: transient middle cerebral artery occlusion; SHAM: sham-operated group; SED: tMCAO-sedentary group; IH: tMCAO-intermittent hypoxia group. *P < 0.05; **P < 0.01 versus SHAM; #P < 0.05; ##P < 0.01; ###P < 0.001 versus SHAM.
Figure 2.
Figure 2.
(a, c) mNSS scores and (b, d) beam-walking test scores of the tMCAO rats during each week of intervention. mNSS: modified neurological severity score; tMCAO: transient middle cerebral artery occlusion; SHAM: sham-operated group; SED: tMCAO-sedentary group; IH: tMCAO-intermittent hypoxia group. (a, b): Comparison of the results between the SHAM, SED, and IH groups. *P < 0.05; **P < 0.01 versus IH. (c, d): Comparison of the results at different time points within the SED and IH groups. *P < 0.05; **P < 0.01; ***P < 0.001.
Figure 3.
Figure 3.
(a) Run duration and (b) average speed ( x¯ ±s, n = 6) of rats in each group after 4 weeks of intervention. tMCAO: transient middle cerebral artery occlusion; SHAM: sham-operated group; SED: tMCAO-sedentary group; IH: tMCAO-intermittent hypoxia group. **P < 0.01 versus SHAM; #P < 0.05 versus SED.
Figure 4.
Figure 4.
Foot pressure and maximum intensity of rats in each group after 4 weeks of intervention ( x¯ ±s, n = 6). (a) Three-dimensional graph of the footprint (the vertical axis is intensity) and (b) max intensity. LF: left forepaw; RF: right forepaw; LH: left hind paw; RH: right hind paw (R is the affected side); tMCAO: transient middle cerebral artery occlusion; SHAM: sham-operated group; SED: tMCAO-sedentary group; IH: tMCAO-intermittent hypoxia group. *P < 0.05; **P < 0.01 versus SHAM; #P < 0.05; ##P < 0.01 versus SED. (A color version of this figure is available in the online journal.)
Figure 5.
Figure 5.
CatWalk static parameters of rats in each group after 4 weeks of intervention ( x¯ ±s, n = 6). (a) Representative paw prints of each group; (b) maximum content area; (c) print area; (d) print width; (e) print length. LF: left forepaw; RF: right forepaw; LH: left hind paw; RH: right hind paw (R is the affected side); tMCAO: transient middle cerebral artery occlusion; SHAM: sham-operated group; SED: tMCAO-sedentary group; IH: tMCAO-intermittent hypoxia group. *P < 0.05; **P < 0.01 versus SHAM; #P < 0.05 versus SED. (A color version of this figure is available in the online journal.)
Figure 6.
Figure 6.
CatWalk dynamic parameters of rats in each group after 4 weeks of intervention ( x¯ ±s, n = 6). (a) Plain view of the gait of each group; (b) stand; (c) swing; (d) swing speed; (e) representative paw prints of each group; (f) stride length; (g) base of support (BOS). tMCAO: transient middle cerebral artery occlusion; SHAM: sham-operated group; SED: tMCAO-sedentary group; IH: tMCAO-intermittent hypoxia group; LF: left forepaw; RF: right forepaw; LH: left hind paw; RH: right hind paw (R is the affected side). *P < 0.05; **P < 0.01 versus SHAM; #P < 0.05 versus SED. (A color version of this figure is available in the online journal.)
Figure 7.
Figure 7.
CatWalk balance coordination parameters of rats in each group after 4 weeks of intervention ( x¯ ±s, n = 6). (a) Step cycle; (b) step sequence; (c) support; (d) regularity index. Step sequence: CA, right forepaw → left forepaw → right hind paw → left hind paw; CB, left forepaw → right forepaw → left hind paw → right hind paw; RA, right forepaw → left forepaw → left hind paw → right hind paw; RB, left forepaw → right forepaw → right hind paw → left hind paw; AA, right forepaw → right hind paw → left forepaw → left hind paw; AB, left forepaw → right hind paw → right forepaw → left hind paw. Support: single, one paw supported; diagonal, two diagonal paws supported; girdle, two forepaws or hind paws supported; lateral, two paws on the same side supported; three, three paws supported; four, four paws supported. tMCAO: transient middle cerebral artery occlusion; SHAM: sham-operated group; SED: tMCAO-sedentary group; IH: tMCAO-intermittent hypoxia group; LF: left forepaw; RF: right forepaw; LH: left hind paw; RH: right hind paw (R is the affected side). *P < 0.05; **P < 0.01 versus SHAM; #P < 0.05 versus SED.
Figure 8.
Figure 8.
The cerebral infarction volume ratio of rats in each group before and 4 weeks after intervention ( x¯ ±s, n = 6). (a) Representative coronal T2 images of each group. Abnormal T2 high signals are observed in the left hemisphere. (b) Quantitative analysis of the cerebral infarction volume ratio detected by MRI. MRI: magnetic resonance imaging; tMCAO: transient middle cerebral artery occlusion; SHAM: sham-operated group; SED: tMCAO-sedentary group; IH: tMCAO-intermittent hypoxia group. **P < 0.01; ***P < 0.001.
Figure 9.
Figure 9.
The ultrastructure and number of mitochondria in the peri-infarct subfield of the cortex of rats in each group after 4 weeks of intervention ( x¯ ±s, n = 6). (a) Mitochondrial ultrastructure image. N represents neuronal nuclei, and the arrow points to mitochondria (bar = 1.0 μm). (b) Quantification of the number of mitochondria in each field of transmission electron microscopy. tMCAO: transient middle cerebral artery occlusion; SHAM: sham-operated group; SED: tMCAO-sedentary group; IH: tMCAO-intermittent hypoxia group. ***P < 0.001 versus SHAM; #P < 0.05 versus SED. (A color version of this figure is available in the online journal.)
Figure 10.
Figure 10.
The expression levels of mitochondrial biogenesis proteins in the peri-infarct subfield of the cortex of rats in each group after 4 weeks of intervention ( x¯ ±s, n = 6). (a, c, e) Representative Western blot bands of AMPK, PGC-1α, and Sirt3 proteins, respectively. (b, d, f) Quantitative analysis corresponding to AMPK, PGC-1α, and Sirt3 proteins, respectively. tMCAO: transient middle cerebral artery occlusion; SHAM: sham-operated group; SED: tMCAO-sedentary group; IH: tMCAO-intermittent hypoxia group. *P < 0.05; **P < 0.01 versus SHAM; #P < 0.05; ##P < 0.01 versus SED.
Figure 11.
Figure 11.
Mitochondrial ATP levels of rats in each group after 4 weeks of intervention ( x¯ ±s, n = 6). ATP: adenosine triphosphate; tMCAO: transient middle cerebral artery occlusion; SHAM: sham-operated group; SED: tMCAO-sedentary group; IH: tMCAO-intermittent hypoxia group. **P < 0.01 versus SHAM; #P < 0.05 versus SED.

Similar articles

Cited by

References

    1. Liu L, Chen W, Zhou H, Duan W, Li S, Huo X, Xu W, Huang L, Zheng H, Liu J, Liu H, Wei Y, Xu J, Wang Y, Chinese Stroke Association Stroke Council Guideline Writing Committee. Chinese Stroke Association guidelines for clinical management of cerebrovascular disorders: executive summary and 2019 update of clinical management of ischaemic cerebrovascular diseases. Stroke Vasc Neurol 2020;5:159–76 - PMC - PubMed
    1. Expert Panel on Neurologic I, Salmela MB, Mortazavi S, Jagadeesan BD, Broderick DF, Burns J, Deshmukh TK, Harvey HB, Hoang J, Hunt CH, Kennedy TA, Khalessi AA, Mack W, Patel ND, Perlmutter JS, Policeni B, Schroeder JW, Setzen G, Whitehead MT, Cornelius RS, Corey AS. ACR appropriateness criteria((R)) cerebrovascular disease. J Am Coll Radiol 2017;14:S34–61 - PubMed
    1. MacKay-Lyons M, Billinger SA, Eng JJ, Dromerick A, Giacomantonio N, Hafer-Macko C, Macko R, Nguyen E, Prior P, Suskin N, Tang A, Thornton M, Unsworth K. Aerobic exercise recommendations to optimize best practices in care after stroke: AEROBICS 2019 update. Phys Ther 2020;100:149–56 - PMC - PubMed
    1. Manukhina EB, Downey HF, Shi X, Mallet RT. Intermittent hypoxia training protects cerebrovascular function in Alzheimer’s disease. Exp Biol Med 2016;241:1351–63 - PMC - PubMed
    1. Tantingco G, Ryou MG. Normobaric intermittent hypoxic training regulates microglia phenotype and enhances phagocytic activity. Exp Biol Med 2020;245:740–7 - PMC - PubMed

Publication types