. 2022 Jul:81:104090.
doi: 10.1016/j.ebiom.2022.104090. Epub 2022 Jun 2.

Antiretroviral therapy duration and immunometabolic state determine efficacy of ex vivo dendritic cell-based treatment restoring functional HIV-specific CD8+ T cells in people living with HIV

Affiliations

Antiretroviral therapy duration and immunometabolic state determine efficacy of ex vivo dendritic cell-based treatment restoring functional HIV-specific CD8+ T cells in people living with HIV

Marta Calvet-Mirabent et al. EBioMedicine. 2022 Jul.

Abstract

Background: Dysfunction of CD8+ T cells in people living with HIV-1 (PLWH) receiving anti-retroviral therapy (ART) has restricted the efficacy of dendritic cell (DC)-based immunotherapies against HIV-1. Heterogeneous immune exhaustion and metabolic states of CD8+ T cells might differentially associate with dysfunction. However, specific parameters associated to functional restoration of CD8+ T cells after DC treatment have not been investigated.

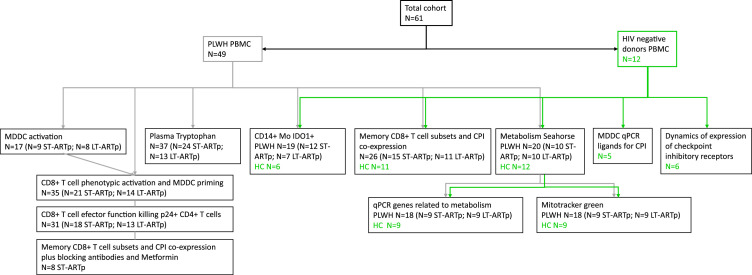
Methods: We studied association of restoration of functional HIV-1-specific CD8+ T cell responses after stimulation with Gag-adjuvant-primed DC with ART duration, exhaustion, metabolic and memory cell subsets profiles.

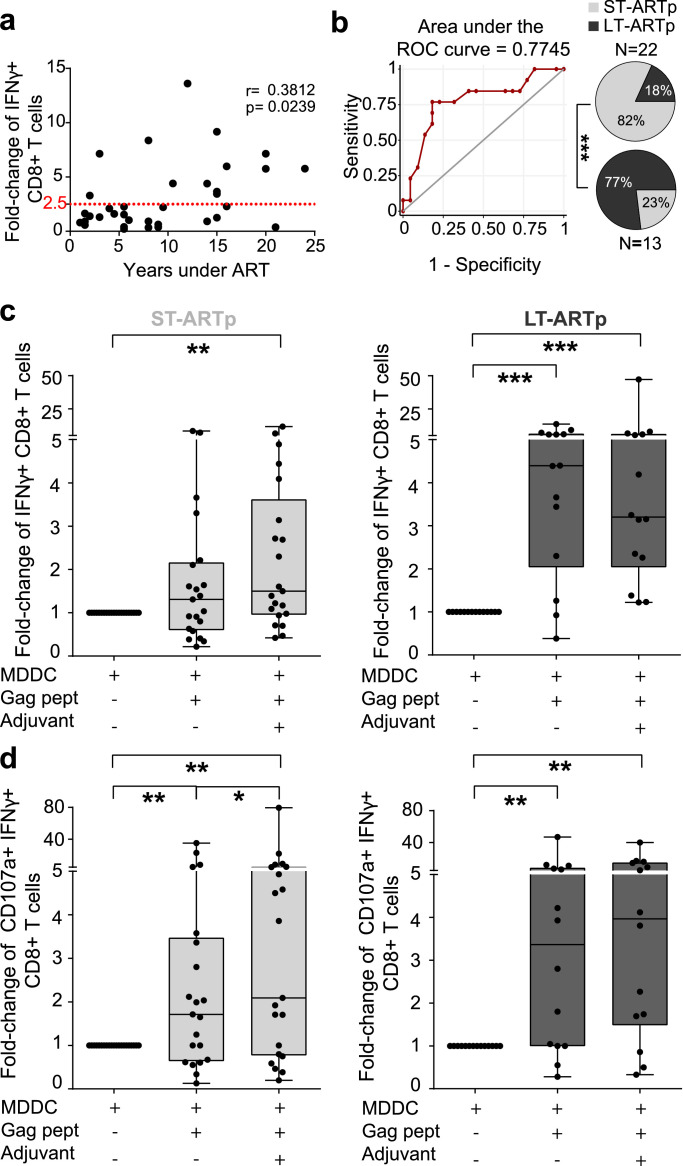
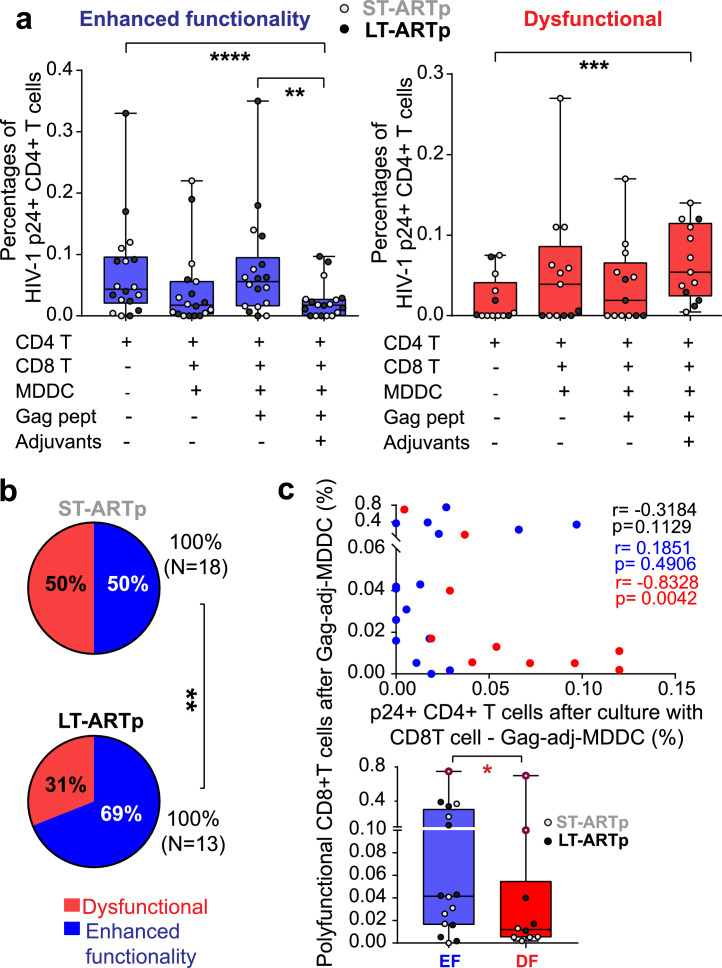
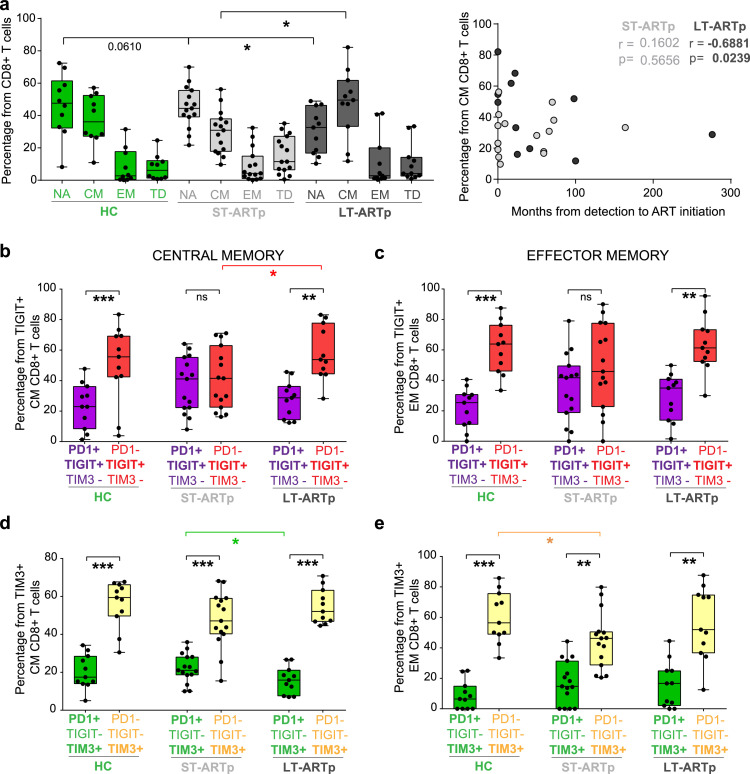
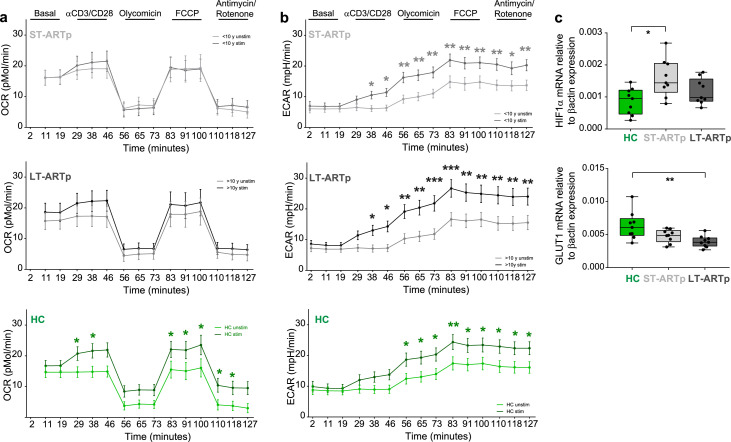
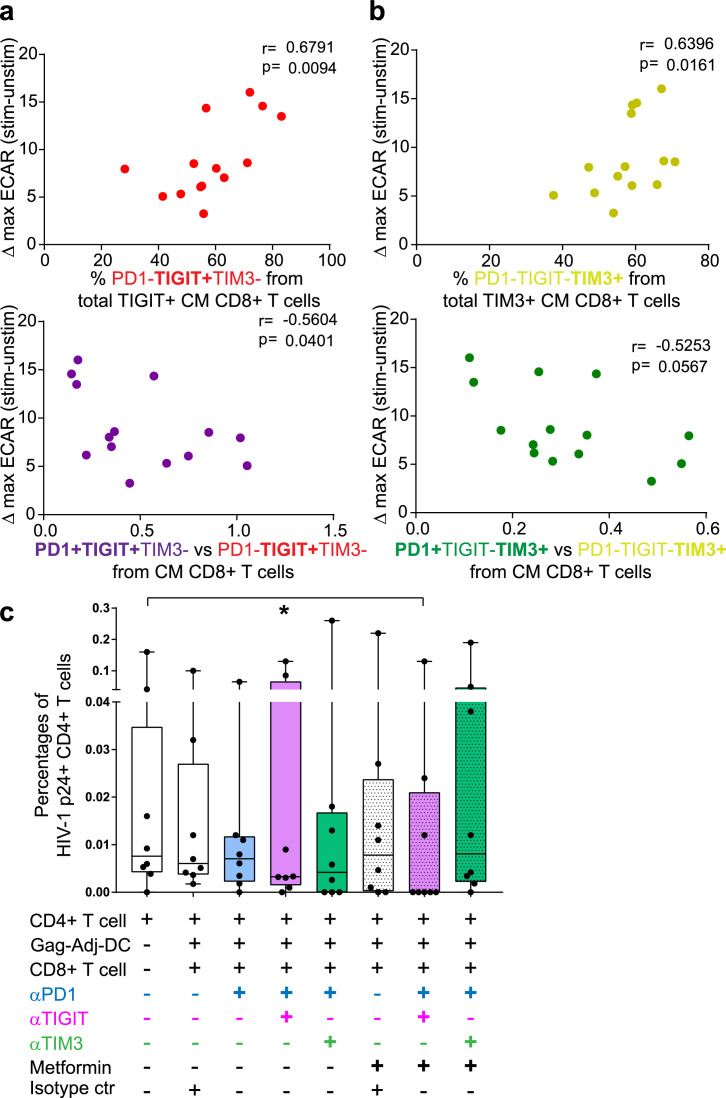
Findings: HIV-1-specific CD8+ T cell responses from a larger proportion of PLWH on long-term ART (more than 10 years; LT-ARTp) improved polyfunctionality and capacity to eliminate autologous p24+ infected CD4+ T cells in vitro. In contrast, functional improvement of CD8+ T cells from PLWH on short-term ART (less than a decade; ST-ARTp) after DC treatment was limited. This was associated with lower frequencies of central memory CD8+ T cells, increased co-expression of PD1 and TIGIT and reduced mitochondrial respiration and glycolysis induction upon TCR activation. In contrast, CD8+ T cells from LT-ARTp showed increased frequencies of TIM3+ PD1- cells and preserved induction of glycolysis. Treatment of dysfunctional CD8+ T cells from ST-ARTp with combined anti-PD1 and anti-TIGIT antibodies plus a glycolysis promoting drug restored their ability to eliminate infected CD4+ T cells.

Interpretation: Together, our study identifies specific immunometabolic parameters for different PLWH subgroups potentially useful for future personalized DC-based HIV-1 vaccines.

Funding: NIH (R21AI140930), MINECO/FEDER RETOS (RTI2018-097485-A-I00) and CIBERINF grants.

Keywords: CD8(+) T cell; Dendritic cell; HIV; Immune exhaustion; Immunotherapy; Metabolism.


Conflict of interest statement

Declaration of interests The authors have declared that no conflict of interest exists.

Figures

Fig 1
Figure 1
STROBE flow chart. Flow chart indicating the number of donors used for each assay. PLWH are indicated in dark grey and HIV negative controls in green.
Fig 2
Figure 2
Magnitude and polyfunctionality of HIV-specific CD8+T cell responses in PLWH on ART. N=35 PLWH (a) Spearman correlation of fold-change in IFNγ expression from total live CD8+ T cells after Gag-peptide presentation by MDDCs, highlighting optimal response established as a minimum of 2.5 fold-change in IFNγ from baseline. Spearman r and p values are shown on the left for each correlation. (b) Left panel showing ROC curve for classification of our cohort based on CD8+ T cell IFNγ response to Gag-loaded MDDC and years under treatment of each individual; and right panel showing pie-charts of the stratification of PLWH based on less than 10 years (ST-ARTp, light grey), or equal or more than 10 years (LT-ARTp, dark grey) of ART duration. ROC curve was calculated with SPSS v20 and statistical significances of pie charts was calculated using a Chi-square test with Yates’ correction (***p<0.001). (c-d) Fold-change in IFNγ expression (c) and fold-change in polyfunctional responses (CD107a+ IFNγ+ cells) (d) from total live CD8+ T cells after stimulation of MDDCs in ST-ARTp (left plots, in light grey) and LT-ARTp (right plots, in dark gray). Statistical significance was calculated using two-tailed Wilcoxon test (*p<0.05; **p<0.01; ***p<0.001; ****p<0.0001).
Fig 3
Figure 3
Cytotoxic function of CD8+T cells from PLWH after DC-treatment. N=31 (N=18 ST-ARTp; N=13 LT-ARTp). (a) Proportions of intracellular HIV-1 p24+ cells from CD4+ T cells cultured in media supplemented with Raltegavir and Romidepsin alone or in the presence of autologous CD8+ T cells and primed with MDDC pre-cultured under the indicated conditions. PLWH were stratified by enhanced (in blue) or dysfunctional (in red) cytotoxic activity of CD8+ T cells eliminating p24+ CD4+ T cell detection after DC treatment. ST-ARTp (light grey) and LT-ARTp (dark grey) PLWH are highlighted within each functional profile. Statistical significance was calculated using two-tailed Wilcoxon test (*p<0.05; **p<0.01; ****p<0.0001). (b) Pie-charts showing percentage of dysfunctional (red) and enhanced functionality (blue) profiles contained within the ST-ARTp and LT-ARTp subgroups. Statistical significance was calculated using a Chi-square test with Yates’ correction (**p<0.01). (c) Spearman correlation of proportions of IFNγ+ CD107a+ (polyfunctional) CD8+ T cells after priming with adjuvant-activated Gag-loaded MDDC vs p24+ T cells present in co-culture with these CD8+ T cells activated with adjuvant-primed Gag-loaded MDDC (N=14 enhanced functionality, and N=12 dysfunctional; Upper panel). P and r values are shown on the right, in black for total values, in red for dysfunctional, and in blue for enhanced functionality. Proportions of IFNγ+ CD107a+ (polyfunctional) CD8+ T cells after priming with adjuvant-activated Gag-loaded MDDC comparing enhanced functionality (EF) and dysfunctional (DF). Statistical significance was calculated using two-tailed Mann-Whitney U test after outlier removal using the ROUT method (*p<0.05).
Fig 4
Figure 4
Memory subset distribution and co-expression of checkpoint inhibitor receptors in CD8+T cells from different PLWH subgroups. N=11 HIV-1 negative controls (HC); N=15 ST-ARTp; N=11 LT-ARTp. (a) Percentage of naïve, NA (CCR7+ CD45Ro); central memory, CM (CCR7+ CD45Ro+); effector memory, EM (CCR7 CD45Ro+); and terminally differentiated, TD (CCR7 CD45Ro) CD8+ T cells from HIV negative controls (HC; green bars), ST-ARTp (light grey bars) and LT-ARTp (dark grey bars). Statistical significance was calculated using two-tailed Mann-Whitney U test (*p<0.05). On the right, Spearman correlations between the percentage of CM CD8+ T cells and months since HIV-1 infection diagnosis to ART initiation for ST-ARTp (light grey) and LT-ARTp (dark grey dots). Spearman r and p values are shown on the left for each correlation. (b-e) Proportion of PD1+TIGIT+TIM3 (b-c; purple) or PD1+TIGITTIM3+ (d-e; green) populations from total TIGIT+ or TIM3+ cells, compared to PD1TIGIT+TIM3 (B-C; red) or PD1-TIGITTIM3+ (D-E; yellow) population from total TIGIT+ or TIM3+ populations. Statistical significance between the mentioned double and single positive populations was calculated using two-tailed matched pairs Wilcoxon test (**p<0.01; ***p<0.001) within each participant group and using two-tailed Mann-Whitney U test (*p<0.05) between different individuals.
Fig 5
Figure 5
CD8+T cell oxidative and glycolytic metabolism in PLWH. (a-b) Oxygen consumption rate (a; OCR) and extracellular acidification rate (b; ECAR) in CD8+ T cells from PLWH comparing basal (light line) and TCR activated (dark line) cells from ST-ARTp (N=10; upper plots; light grey), LT-ARTp (N=10; middle plots; dark grey), and HIV-1 negative controls (HC; N=12; lower plots; green). Statistical significance per each timepoint was calculated with a multiple t test analysis. (c) RT-qPCR analysis of HIF1α (upper) and GLUT1 (lower) transcriptional expression normalized to β−actin mRNA levels in memory CD45RA CD8+ T cells isolated from total PBMCs from HIV negative controls (HC; N=9; green) and PLWH (ST-ARTp; N=9; light grey, and LT-ARTp; N=9; dark grey). Statistical significance between double and single positive populations was calculated using two-tailed Wilcoxon test (*p<0.05).
Fig 6
Fig. 6
Correlation and fine-tuning of glycolytic metabolism and memory exhaustion in CD8+T cell from PLWH. (a-b) Spearman correlations between ΔECAR at maximal activation after TCR stimulation (73 minutes) and proportions of PD1TIGIT+TIM3 (a, upper panel; N=14; red) or PD1-TIGITTIM3+ (b, upper panel; N=14; yellow) to total TIGIT+ or TIM3+ cells or ratios of the indicated populations (lower plots; PD1 vs TIGIT purple and red; PD1 vs TIM3 green and yellow; N=14 each) within central memory CD8+ T cells. Spearman r and p values are shown on the upper left area of each plot. (c) Proportions of p24+ cells from total live CD4+ T cells to basal CD4+ T cells p24+ detection to the different MDDC and CD8+ T cell treated conditions (N=8). Light purple bars indicate the use of anti-PD1 and anti-TIGIT blocking antibodies in combination; light green bars indicate the use of anti-PD1 and anti-TIM3 blocking antibodies combination. Stripped bars indicate the use of 5 mM Metformin, either alone or in combination with the blocking antibodies. Statistical significance to the CD4+ T cell basal condition was calculated using two-tailed Wilcoxon test (*p<0.05).

References

    1. Pallikkuth S, Sharkey M, Babic DZ, et al. Peripheral T follicular helper cells are the major HIV reservoir within central memory CD4 T cells in peripheral blood from chronically HIV-infected individuals on combination antiretroviral therapy. J Virol. 2015;90(6):2718–2728. - PMC - PubMed
    1. Henderson LJ, Reoma LB, Kovacs JA, Nath A. Advances toward curing HIV-1 infection in tissue reservoirs. J Virol. 2020;94(3) - PMC - PubMed
    1. Banga R, Munoz O, Perreau M. HIV persistence in lymph nodes. Curr Opin HIV AIDS. 2021;16(4):209–214. - PubMed
    1. Cohn LB, Chomont N, Deeks SG. The biology of the HIV-1 latent reservoir and implications for cure strategies. Cell HostMicrobe. 2020;27(4):519–530. - PMC - PubMed
    1. Mohamed H, Miller V, Jennings SR, Wigdahl B, Krebs FC. The evolution of dendritic cell immunotherapy against HIV-1 infection: improvements and outlook. J ImmunolRes. 2020;2020 - PMC - PubMed

Substances