. 2022 Jun 6:11:e72123.
doi: 10.7554/eLife.72123.

Predictors of human-infective RNA virus discovery in the United States, China, and Africa, an ecological study

Affiliations

Predictors of human-infective RNA virus discovery in the United States, China, and Africa, an ecological study

Feifei Zhang et al. Elife. .

Abstract

Background: The variation in the pathogen type as well as the spatial heterogeneity of predictors make the generality of any associations with pathogen discovery debatable. Our previous work confirmed that the association of a group of predictors differed across different types of RNA viruses, yet there have been no previous comparisons of the specific predictors for RNA virus discovery in different regions. The aim of the current study was to close the gap by investigating whether predictors of discovery rates within three regions-the United States, China, and Africa-differ from one another and from those at the global level.

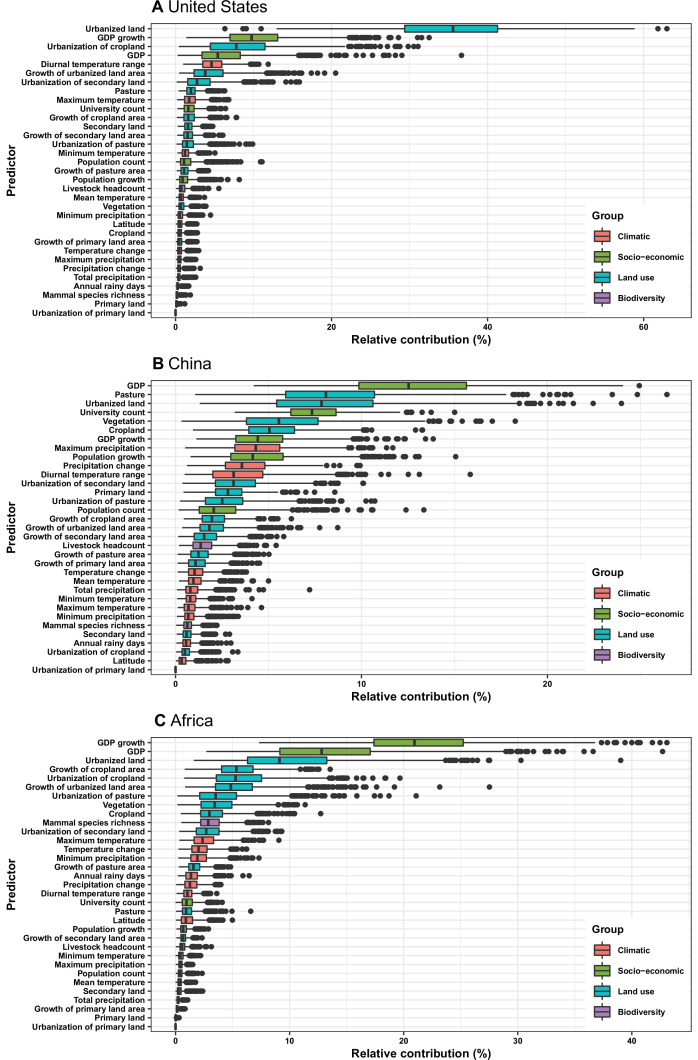
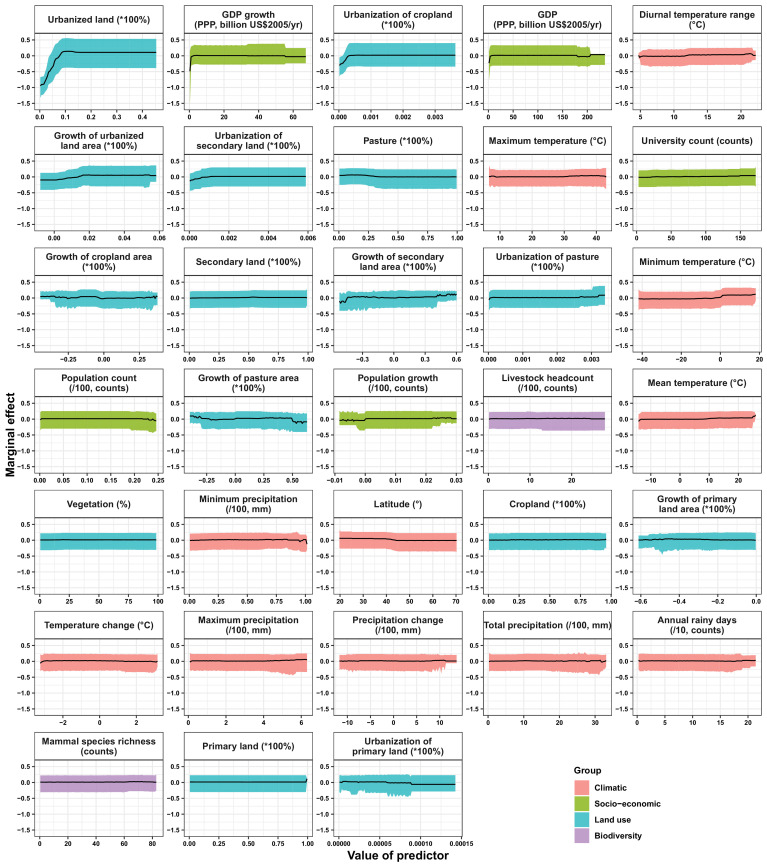
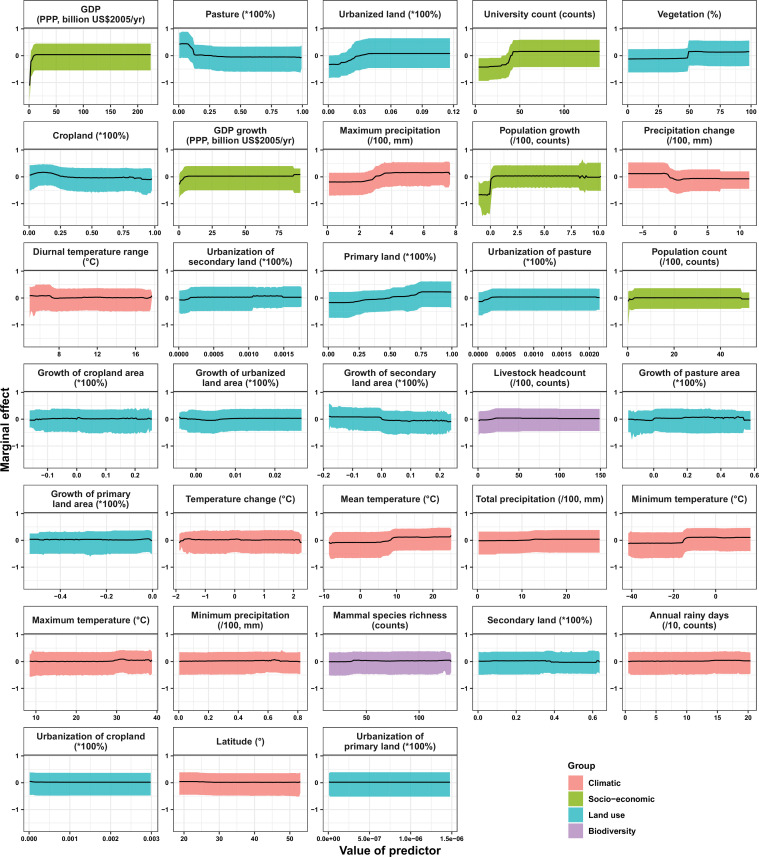
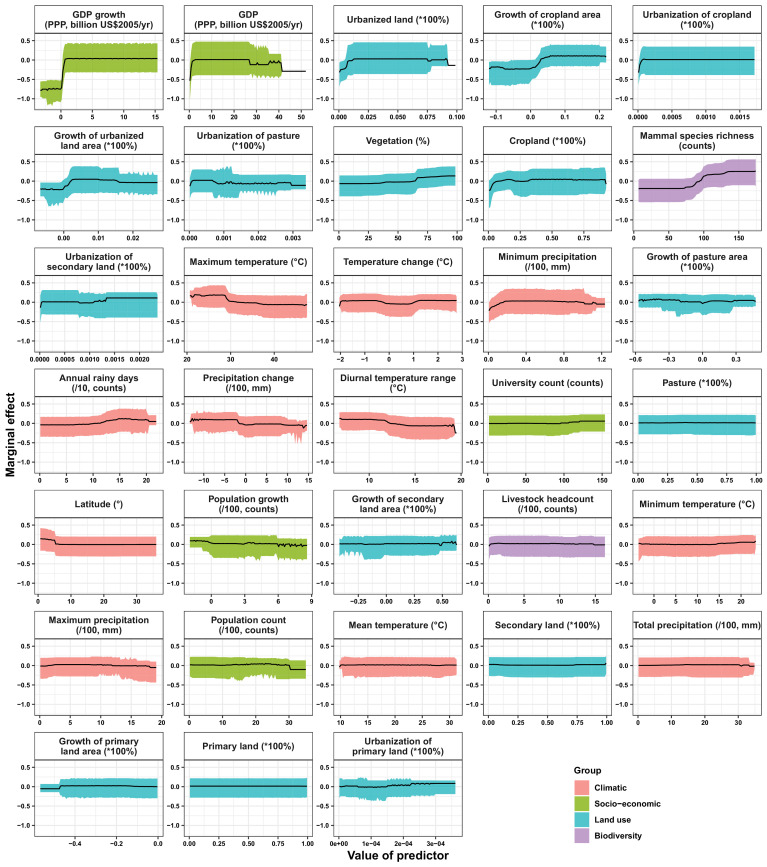
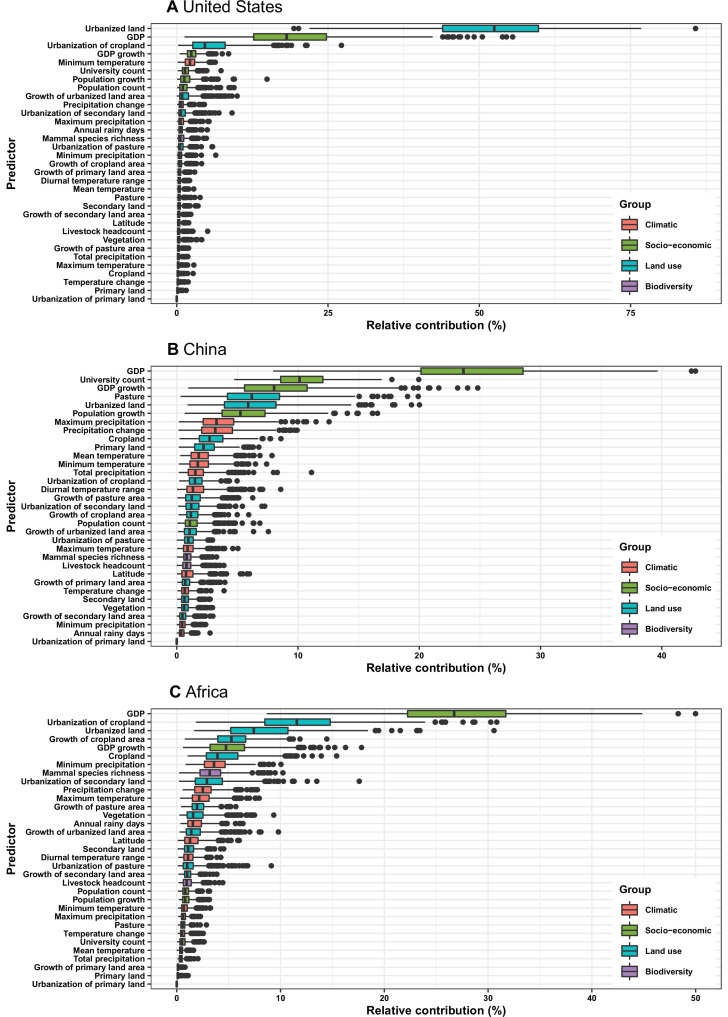
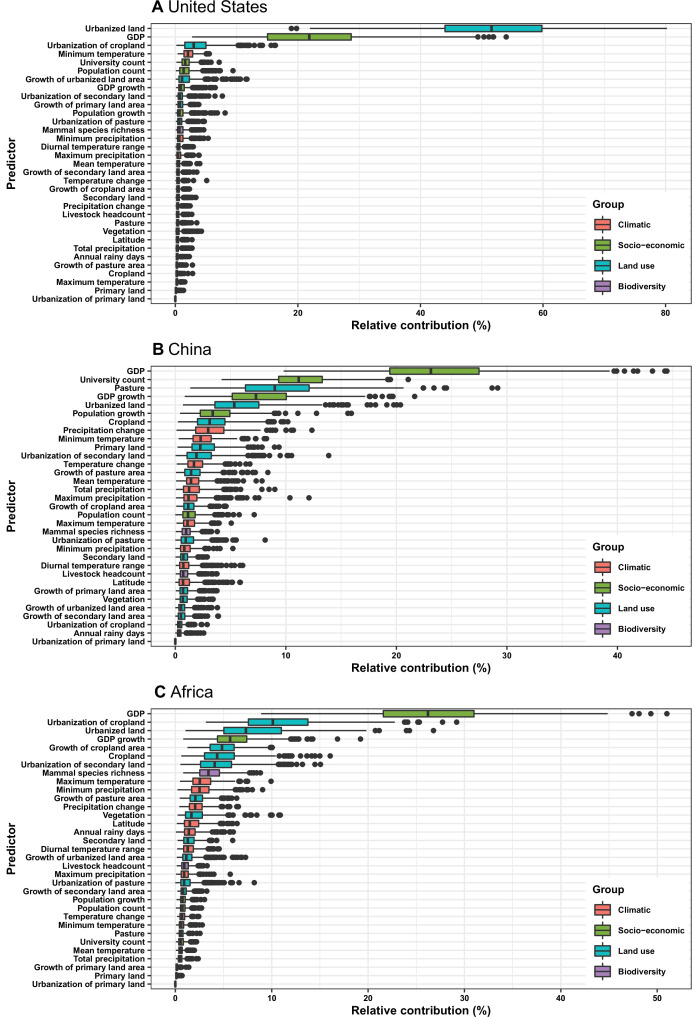
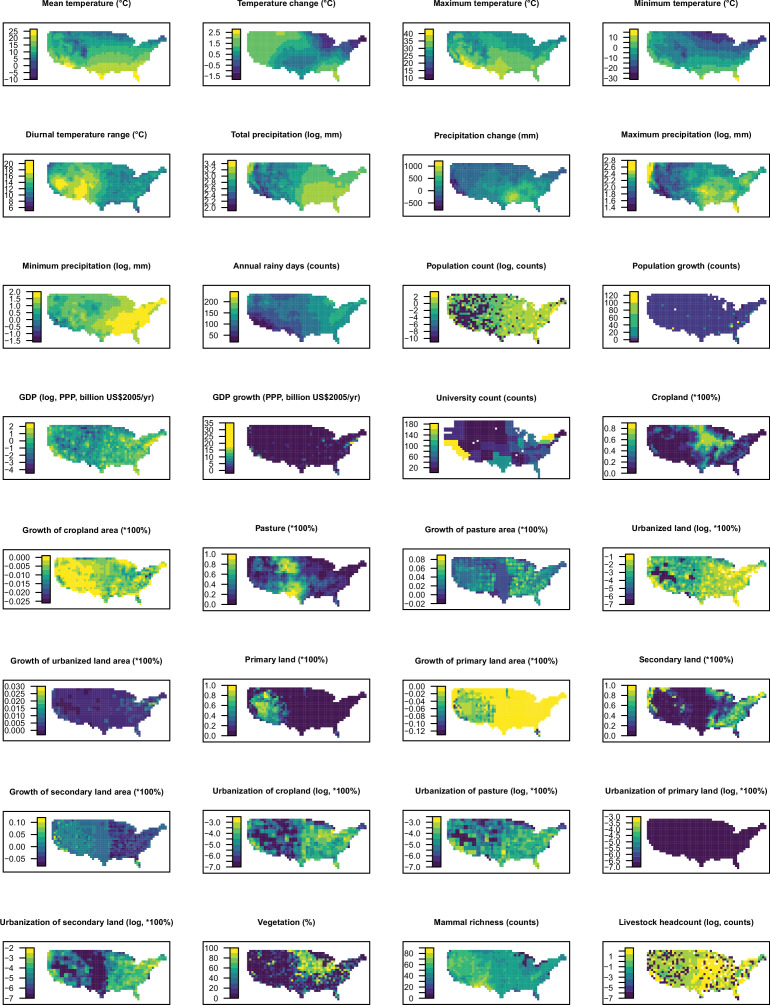
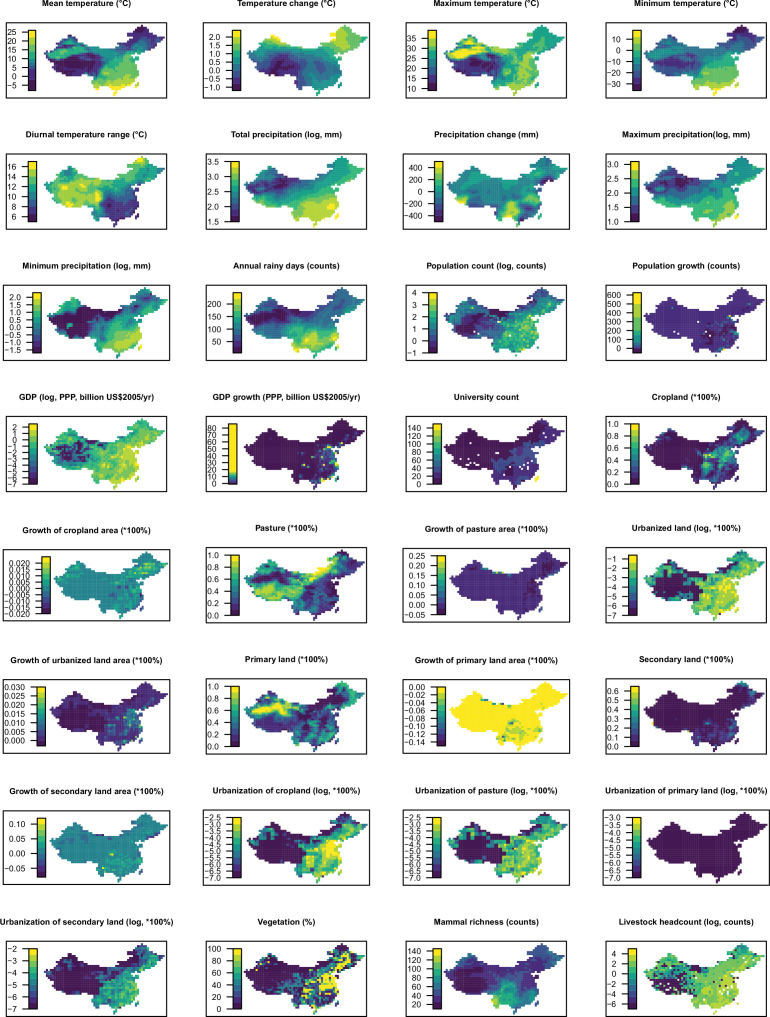
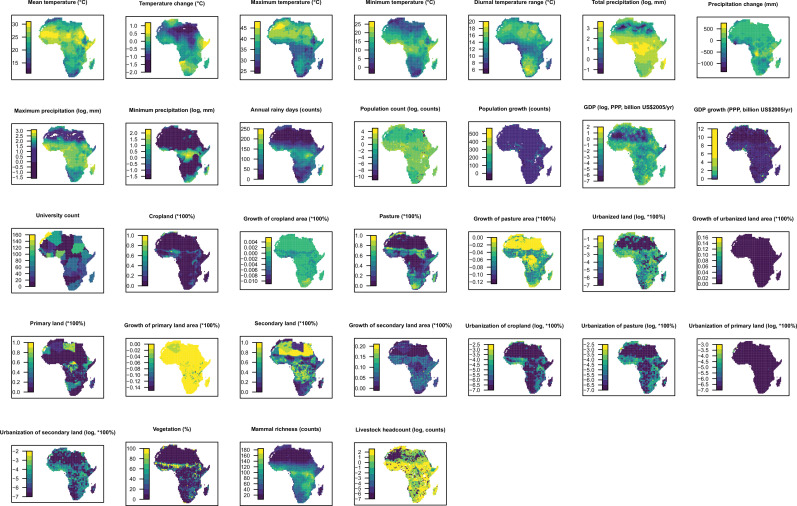
Methods: Based on a comprehensive list of human-infective RNA viruses, we collated published data on first discovery of each species in each region. We used a Poisson boosted regression tree (BRT) model to examine the relationship between virus discovery and 33 predictors representing climate, socio-economics, land use, and biodiversity across each region separately. The discovery probability in three regions in 2010-2019 was mapped using the fitted models and historical predictors.

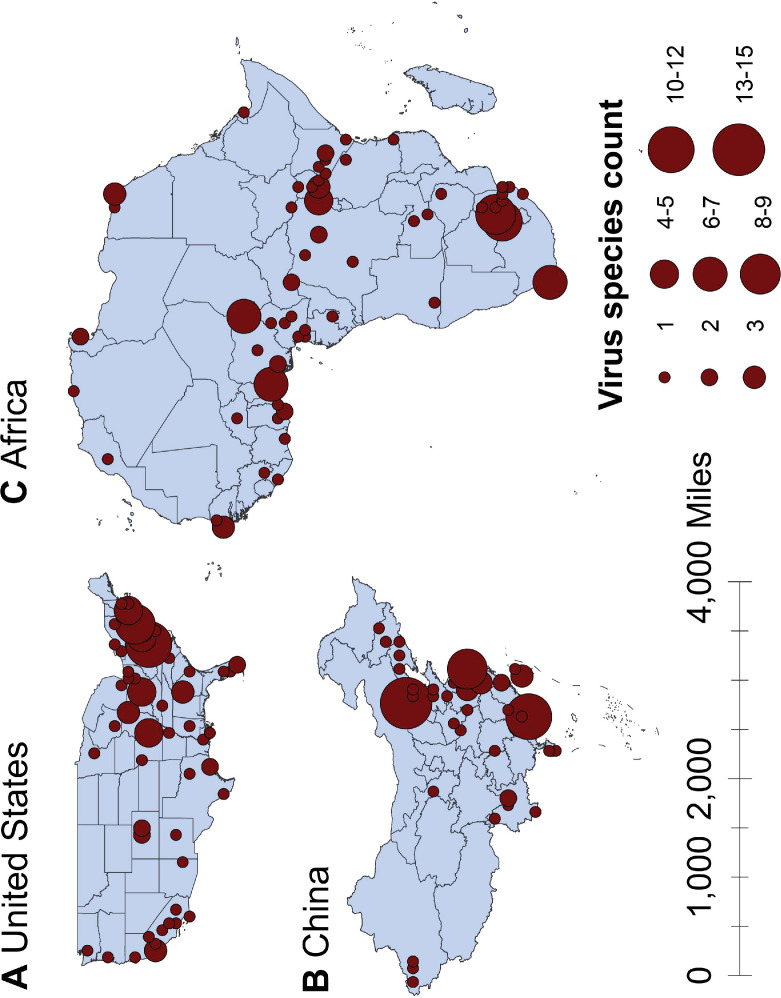
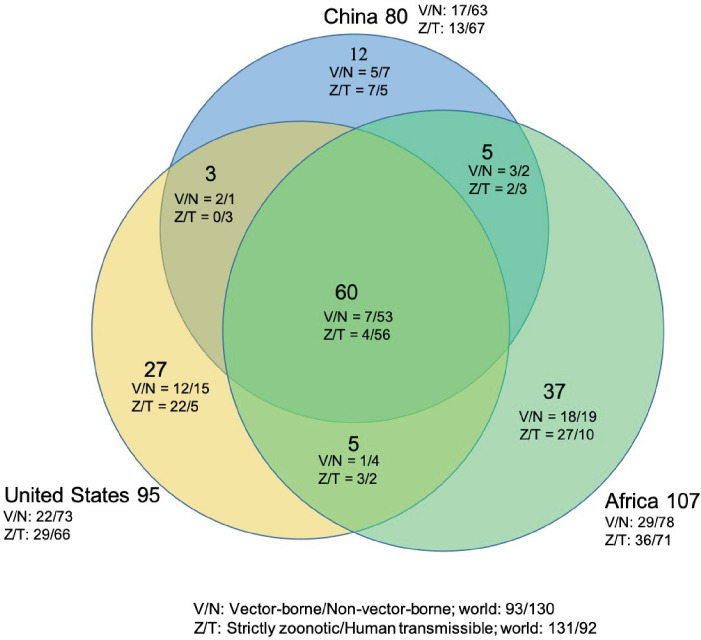
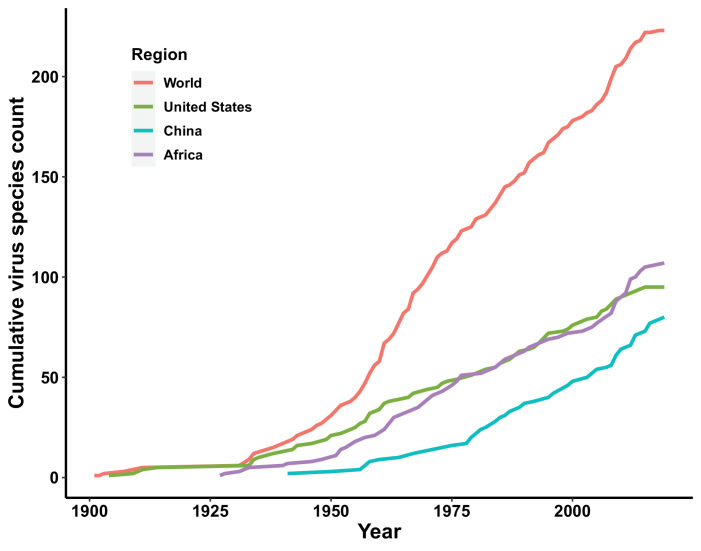
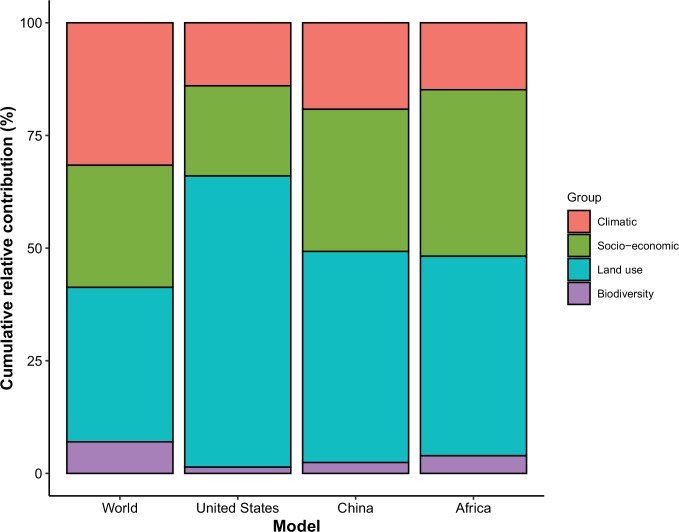
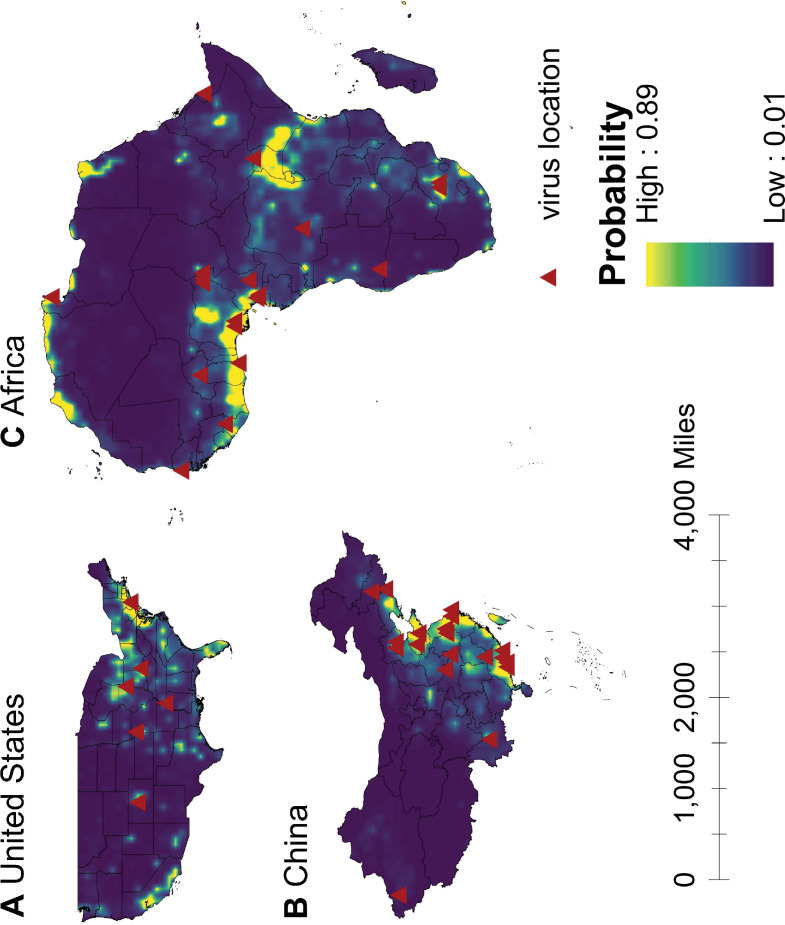
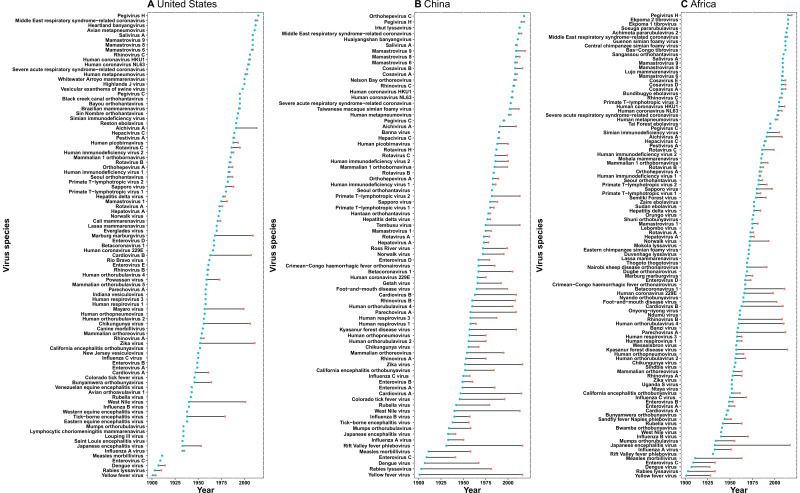
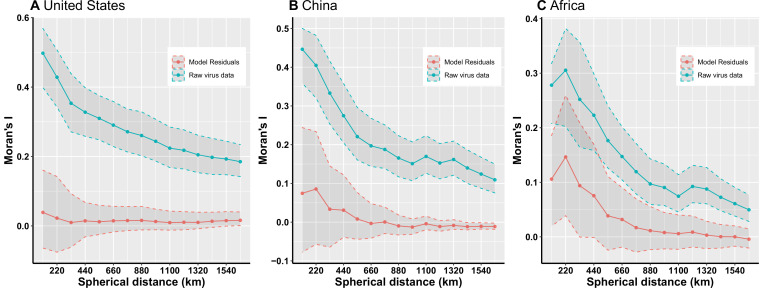
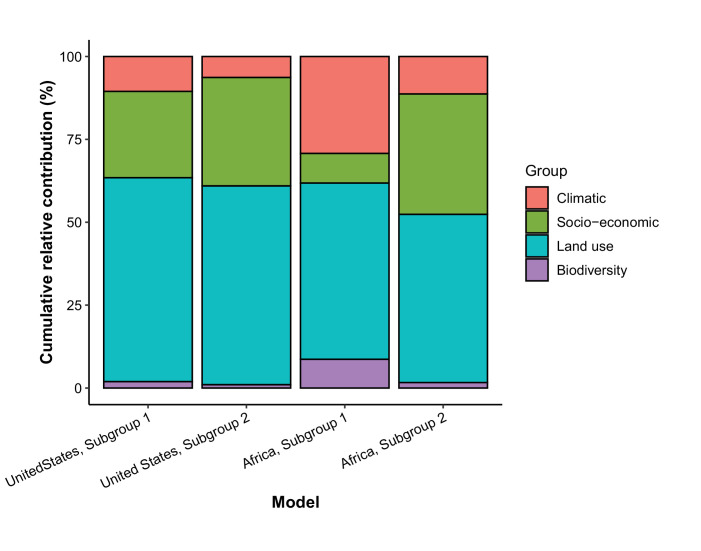
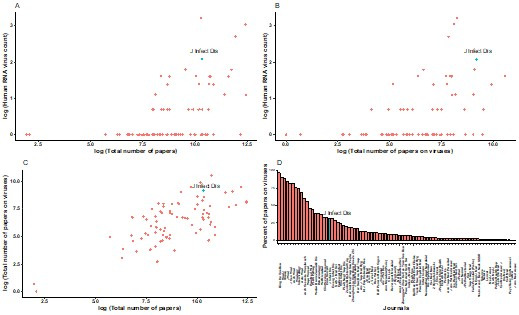
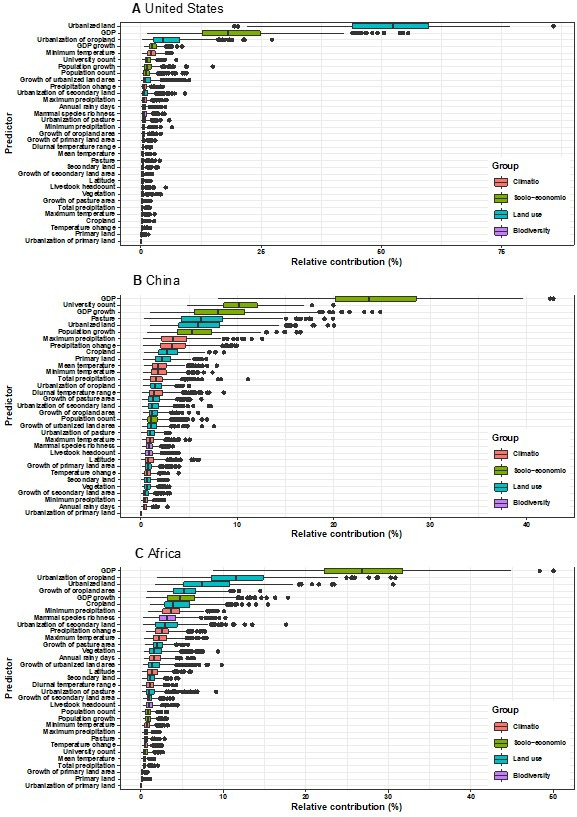
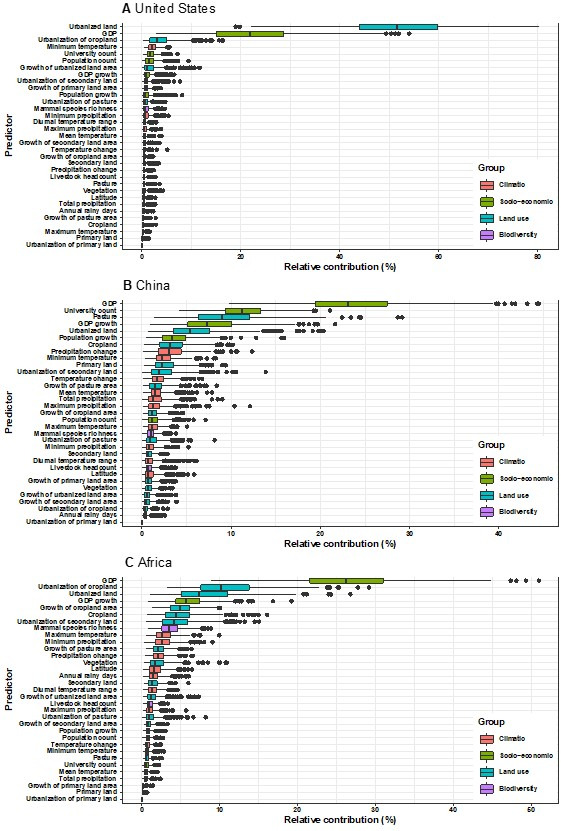
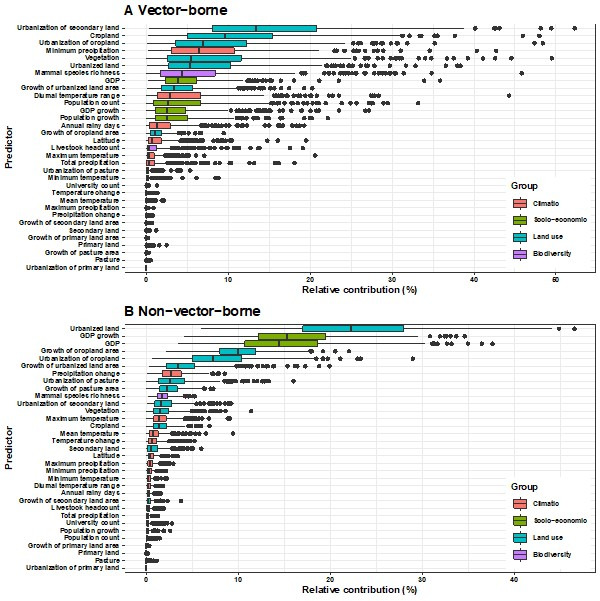
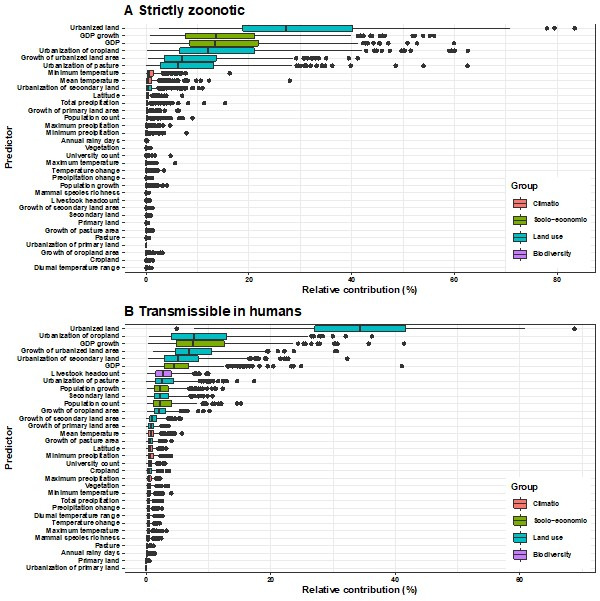
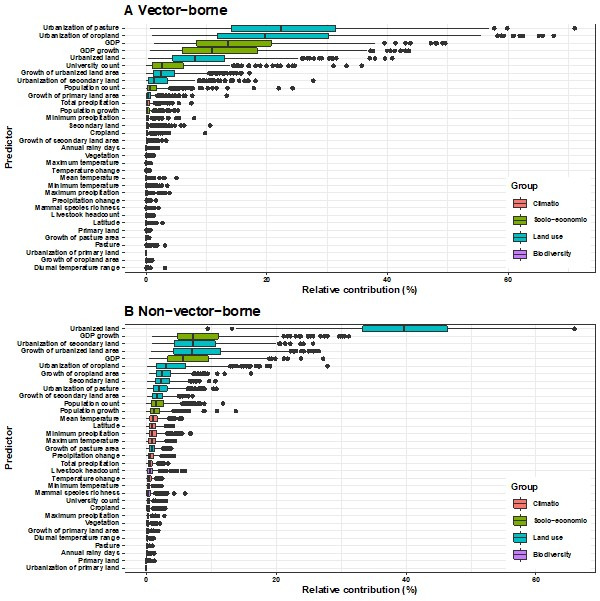
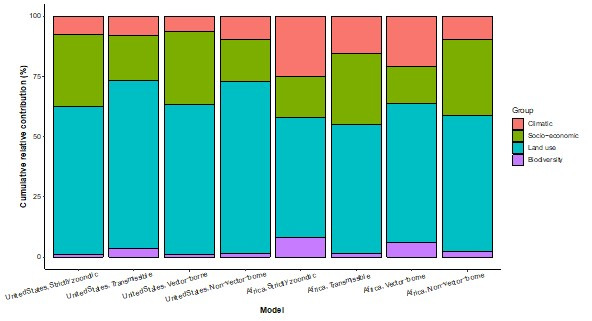
Results: The numbers of human-infective virus species discovered in the United States, China, and Africa up to 2019 were 95, 80, and 107 respectively, with China lagging behind the other two regions. In each region, discoveries were clustered in hotspots. BRT modelling suggested that in all three regions RNA virus discovery was better predicted by land use and socio-economic variables than climatic variables and biodiversity, although the relative importance of these predictors varied by region. Map of virus discovery probability in 2010-2019 indicated several new hotspots outside historical high-risk areas. Most new virus species since 2010 in each region (6/6 in the United States, 19/19 in China, 12/19 in Africa) were discovered in high-risk areas as predicted by our model.

Conclusions: The drivers of spatiotemporal variation in virus discovery rates vary in different regions of the world. Within regions virus discovery is driven mainly by land-use and socio-economic variables; climate and biodiversity variables are consistently less important predictors than at a global scale. Potential new discovery hotspots in 2010-2019 are identified. Results from the study could guide active surveillance for new human-infective viruses in local high-risk areas.

Funding: FFZ is funded by the Darwin Trust of Edinburgh (https://darwintrust.bio.ed.ac.uk/). MEJW has received funding from the European Union's Horizon 2020 research and innovation programme under grant agreement No. 874735 (VEO) (https://www.veo-europe.eu/).

Keywords: ecology; emerging virus; epidemiology; global health; machine learning; risk factor; viruses.


Conflict of interest statement

FZ, MC, CG, MW No competing interests declared

Figures

Figure 1.
Figure 1.. Spatial distribution of human-infective RNA virus discovery in three regions, 1901–2019.
(A) United States. (B) China. (C) Africa. Red dots represent discovery points or centroids of polygons, with the size representing the cumulative virus species count.
Figure 2.
Figure 2.. Shared human-infective RNA virus species count in three regions.
Under/By the species count the ratios of vector-borne (V) to non-vector-borne (N) viruses and strictly zoonotic (Z) to human transmissible (T) viruses were shown.
Figure 3.
Figure 3.. Discovery curve of human-infective RNA virus species in three regions and the world.
Figure 4.
Figure 4.. Relative contribution of predictors to human-infective RNA virus discovery in three regions.
(A) United States. (B) China. (C) Africa. The boxplots show the median (black bar) and interquartile range (box) of the relative contribution across 1000 replicate boosted regression tree models, with whiskers indicating minimum and maximum and black dots indicating outliers.
Figure 5.
Figure 5.. Cumulative relative contribution of predictors to human-infective RNA virus discovery by group in each model of different regions.
The relative contributions of all explanatory factors sum to 100% in each model, and each colour represents the cumulative relative contribution of all explanatory factors within each group.
Figure 6.
Figure 6.. Predicted probability of human-infective RNA virus discovery in three regions in 2010–2019.
(A) United States. (B) China. (C) Africa. The triangles represented the actual discovery sites from 2010 to 2019, and the background colour represented the predicted discovery probability.
Appendix 3—figure 1.
Appendix 3—figure 1.. Relationship between published human-infective RNA virus count and total number of papers from the journals which published all human-infective RNA viruses in Web of Science.
(A) Total number of papers vs. published human virus count; (B) Total number of papers on viruses vs. published human virus count; (C) Total number of papers vs. total number of papers on viruses; (D) Percent of papers on viruses in each journal. Journal of Infectious Diseases (JID) is highlighted in blue.
Appendix 3—figure 2.
Appendix 3—figure 2.. Time lag of human-infective RNA virus discovery between the three regions and the world.
(A) United States. (B) China. (C) Africa. The blue dots represent the original discovery year of each virus in the world; the red dots represent the discovery year of each virus in three regions; and the segments between them represent the time lag.
Appendix 3—figure 3.
Appendix 3—figure 3.. Partial dependence plots showing the influence on human-infective RNA virus discovery for all predictors in the Unites States.
Partial dependence plots show the effect of an individual predictor over its range on the response after factoring out other predictors. Fitted lines represent the median (black) and 95% quantiles (coloured) based on 1000 replicated boosted regression tree models. Y axes are centred around the mean without scaling. X axes show the range of sampled values of predictors.
Appendix 3—figure 4.
Appendix 3—figure 4.. Partial dependence plots showing the influence on human-infective RNA virus discovery for predictors in China.
Partial dependence plots show the effect of an individual predictor over its range on the response after factoring out other predictors. Fitted lines represent the median (black) and 95% quantiles (coloured) based on 1000 replicated boosted regression tree models. Y axes are centred around the mean without scaling. X axes show the range of sampled values of predictors.
Appendix 3—figure 5.
Appendix 3—figure 5.. Partial dependence plots showing the influence on human-infective RNA virus discovery for all predictors in Africa.
Partial dependence plots show the effect of an individual predictor over its range on the response after factoring out other predictors. Fitted lines represent the median (black) and 95% quantiles (coloured) based on 1000 replicated boosted regression tree models. Y axes are centred around the mean without scaling. X axes show the range of sampled values of predictors.
Appendix 3—figure 6.
Appendix 3—figure 6.. Moran’s I across different spherical distances.
(A) United States; (B) China; (C) Africa. The solid line and dots represented the median Moran’s I value, and the grey area represented its 95% quantiles generated from 1000 samples (Blue: Raw virus data) or replicate boosted regression tree (BRT) models (Red: Model residuals). We used the fixed spherical distance as the neighbourhood weights—as there is no general consensus for selecting cut-off values, we chose spherical distances ranging from one time to fifteen times of distance of 1° grid cell at the equator, i.e. 110km to 1650km, considering the area of three regions. Our BRT models reduced Moran’s I value from a range of 0.19–0.50 for the raw virus data to 0.009–0.04 for the model residuals in the United States (A), 0.11–0.45 to –0.01–0.09 in China (B), 0.05–0.31 to –0.004–0.15 in Africa (C), suggesting that BRT models with 33 predictors have adequately accounted for spatial autocorrelations in the raw virus data in all three regions.
Appendix 3—figure 7.
Appendix 3—figure 7.. Relative contribution of predictors to human-infective RNA virus discovery in three regions.
Virus discovery data were matched to time-varying covariate data by year. (A) United States. (B) China. (C) Africa. The boxplots show the median (black bar) and interquartile range (box) of the relative contribution across 1000 replicate boosted regression tree models, with whiskers indicating minimum and maximum and black dots indicating outliers.
Appendix 3—figure 8.
Appendix 3—figure 8.. Relative contribution of predictors to human-infective RNA virus discovery in three regions.
Virus discovery data at year t were matched to time-varying covariate data at year t-1. (A) United States. (B) China. (C) Africa. The boxplots show the median (black bar) and interquartile range (box) of the relative contribution across 1000 replicate boosted regression tree models, with whiskers indicating minimum and maximum and black dots indicating outliers.
Appendix 3—figure 9.
Appendix 3—figure 9.. Distribution maps for 32 predictors in 2015 in the United States.
The values of these explanatory variables and latitude in each grid cell were used to predict the virus discovery in the corresponding grid cell in the Unites States in 2010–2019. Explanatory variables were log transformed where necessary to get better visualization, not meaning they entered the model by logged values.
Appendix 3—figure 10.
Appendix 3—figure 10.. Distribution maps for 32 predictors in 2015 in China.
The values of these explanatory variables and latitude in each grid cell were used to predict the virus discovery in the corresponding grid cell in China in 2010–2019. Explanatory variables were log transformed where necessary to get better visualization, not meaning they entered the model by logged values.
Appendix 3—figure 11.
Appendix 3—figure 11.. Distribution maps for 32 predictors in 2015 in Africa.
The values of these explanatory variables and latitude in each grid cell were used to predict the virus discovery in the corresponding grid cell in Africa in 2010–2019. Explanatory variables were log transformed where necessary to get better visualization, not meaning they entered the model by logged values.
Appendix 3—figure 12.
Appendix 3—figure 12.. Cumulative relative contribution of predictors to human-infective RNA virus discovery by group in each model of subgroups.
Subgroup 1 represents viruses firstly discovered from the region (United States or Africa); Subgroup 2 represents viruses firstly discovered elsewhere in the world. In the United States, virus count of Subgroup 1 and Subgroup 2 were 52 and 43, respectively. In Africa, virus count of Subgroup 1 and Subgroup 2 were 39 and 68, respectively. The relative contributions of all explanatory factors sum to 100% in each model, and each colour represents the cumulative relative contribution of all explanatory factors within each group.
Author response image 1.
Author response image 1.. Relationship between published human-infective RNA virus count and total number of papers from the journals which published all human-infective RNA viruses in Web of Science.
A, total number of papers vs. published human virus count; B, total number of papers on viruses vs. published human virus count; C, total number of papers vs. total number of papers on viruses; D, Percent of papers on viruses in each journal. (J) Infect Dis (JID) is highlighted in blue.
Author response image 2.
Author response image 2.. Relative contribution of predictors to human-infective RNA virus discovery in three regions.
Virus discovery data were matched to time-varying covariate data by year. (A) United States. (B) China. (C) Africa. The boxplots show the median (black bar) and interquartile range (box) of the relative contribution across 1000 replicate models, with whiskers indicating minimum and maximum and black dots indicating outliers.
Author response image 3.
Author response image 3.. Relative contribution of predictors to human-infective RNA virus discovery in three regions.
Virus discovery data at year t were matched to time-varying covariate data at year t-1. (A) United States. (B) China. (C) Africa. The boxplots show the median (black bar) and interquartile range (box) of the relative contribution across 1000 replicate models, with whiskers indicating minimum and maximum and black dots indicating outliers.
Author response image 4.
Author response image 4.. Correlation matrix for predictors.
Positive correlations are displayed in blue and negative correlations in red colour. Spearman’s rank correlation test was used. Colour intensity is proportional to the correlation coefficients.
Author response image 5.
Author response image 5.. Relative contribution of predictors to human-infective RNA virus discovery in the United States by removing high-correlated predictors.
The boxplots show the median (black bar) and interquartile range (box) of the relative contribution across 1000 replicate models, with whiskers indicating minimum and maximum and black dots indicating outliers.
Author response image 6.
Author response image 6.. Relative contribution of explanatory factors to human RNA virus discovery in the stratified model by transmissibility in Africa.
(A) Strictly zoonotic, (B) Transmissible in humans. The boxplots show the median (black bar) and interquartile range (box) of the relative contribution across 1000 replicate models, with whiskers indicating minimum and maximum and black dots indicating outliers.
Author response image 7.
Author response image 7.. Relative contribution of explanatory factors to human RNA virus discovery in the stratified model by transmission mode in Africa.
(A) Vector-borne, (B) Non-vector- borne. The boxplots show the median (black bar) and interquartile range (box) of the relative contribution across 1000 replicate models, with whiskers indicating minimum and maximum and black dots indicating outliers.
Author response image 8.
Author response image 8.. Relative contribution of explanatory factors to human RNA virus discovery in the stratified model by transmissibility in the United States.
(A) Strictly zoonotic, (B) Transmissible in humans. The boxplots show the median (black bar) and interquartile range (box) of the relative contribution across 1000 replicate models, with whiskers indicating minimum and maximum and black dots indicating outliers..
Author response image 9.
Author response image 9.. Relative contribution of explanatory factors to human RNA virus discovery in the stratified model by transmission mode in the United States.
(A) Vector-borne, (B) Non-vector- borne. The boxplots show the median (black bar) and interquartile range (box) of the relative contribution across 1000 replicate models, with whiskers indicating minimum and maximum and black dots indicating outliers.
Author response image 10.
Author response image 10.. Cumulative relative contribution of predictors to human-infective RNA virus discovery by group in each model of different regions.
The relative contributions of all explanatory factors sum to 100% in each model, and each colour represents the cumulative relative contribution of all explanatory factors within each group.

Similar articles

References

    1. Abroug F, Slim A, Ouanes-Besbes L, Hadj Kacem M-A, Dachraoui F, Ouanes I, Lu X, Tao Y, Paden C, Caidi H, Miao C, Al-Hajri MM, Zorraga M, Ghaouar W, BenSalah A, Gerber SI, World Health Organization Global Outbreak Alert and Response Network Middle East Respiratory Syndrome Coronavirus International Investigation Team Family cluster of Middle East respiratory syndrome coronavirus infections, Tunisia, 2013. Emerging Infectious Diseases. 2014;20:1527–1530. doi: 10.3201/eid2009.140378. - DOI - PMC - PubMed
    1. Achong BG, Mansell PW, Epstein MA. A new human virus in cultures from A nasopharyngeal carcinoma. The Journal of Pathology. 1971;103:P18. - PubMed
    1. Albariño CG, Shoemaker T, Khristova ML, Wamala JF, Muyembe JJ, Balinandi S, Tumusiime A, Campbell S, Cannon D, Gibbons A, Bergeron E, Bird B, Dodd K, Spiropoulou C, Erickson BR, Guerrero L, Knust B, Nichol ST, Rollin PE, Ströher U. Genomic analysis of filoviruses associated with four viral hemorrhagic fever outbreaks in Uganda and the Democratic Republic of the Congo in 2012. Virology. 2013;442:97–100. doi: 10.1016/j.virol.2013.04.014. - DOI - PMC - PubMed
    1. Albariño CG, Foltzer M, Towner JS, Rowe LA, Campbell S, Jaramillo CM, Bird BH, Reeder DM, Vodzak ME, Rota P, Metcalfe MG, Spiropoulou CF, Knust B, Vincent JP, Frace MA, Nichol ST, Rollin PE, Ströher U. Novel paramyxovirus associated with severe acute febrile disease, South Sudan and Uganda, 2012. Emerging Infectious Diseases. 2014;20:211–216. doi: 10.3201/eid2002.131620. - DOI - PMC - PubMed
    1. Allen T, Murray KA, Zambrana-Torrelio C, Morse SS, Rondinini C, Di Marco M, Breit N, Olival KJ, Daszak P. Global hotspots and correlates of emerging zoonotic diseases. Nature Communications. 2017;8:1124. doi: 10.1038/s41467-017-00923-8. - DOI - PMC - PubMed

Publication types