

Visualization of the location and level of pain in common wrist pathologies using color-coded heatmaps
- PMID: 35666312
- PMCID: PMC9925519
- DOI: 10.1007/s00402-022-04479-1
Visualization of the location and level of pain in common wrist pathologies using color-coded heatmaps
Abstract
Background: Pain of the hand and wrist affects a large patient population. If the onset is unrelated to recent trauma, the first medical contact is rarely established with a specialized hand surgeon.
Objective: The objective of this investigation was to (1) visualize the localization of hand pain using pain-related heatmaps in common wrist pathologies, (2) to test whether differences between these pathologies exist with regard to sociodemographic and pain-related aspects, and (3) to evaluate the major patient-reported complaints associated with the pathologies.
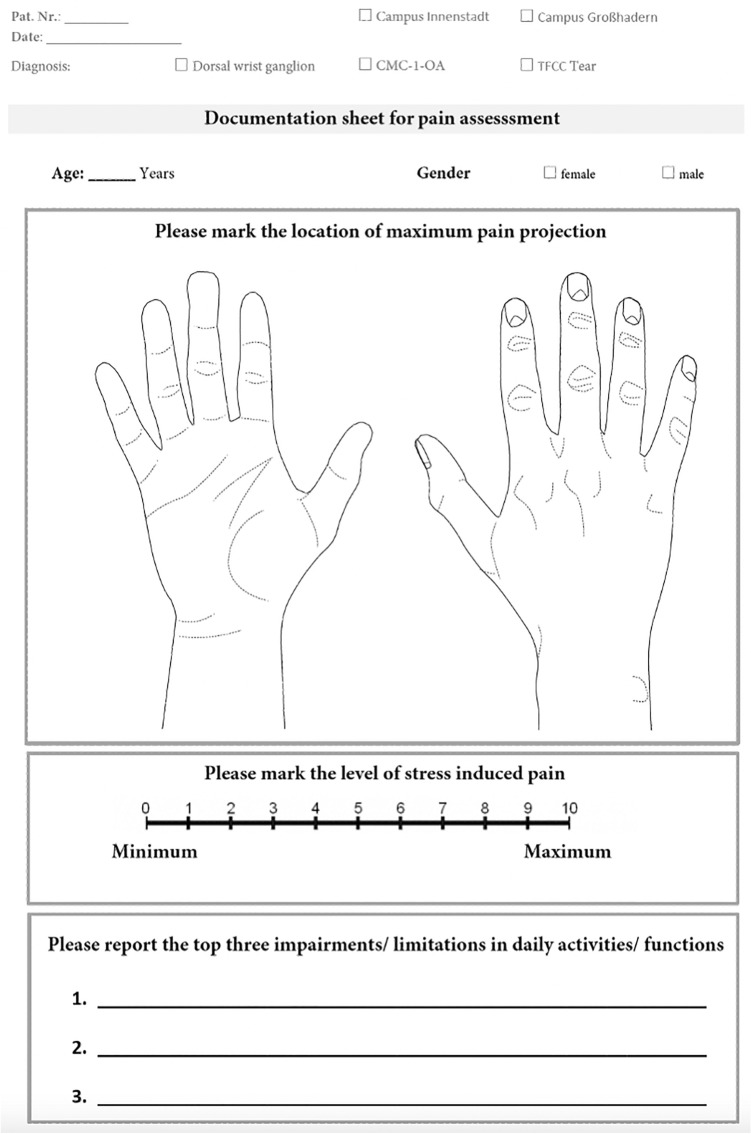
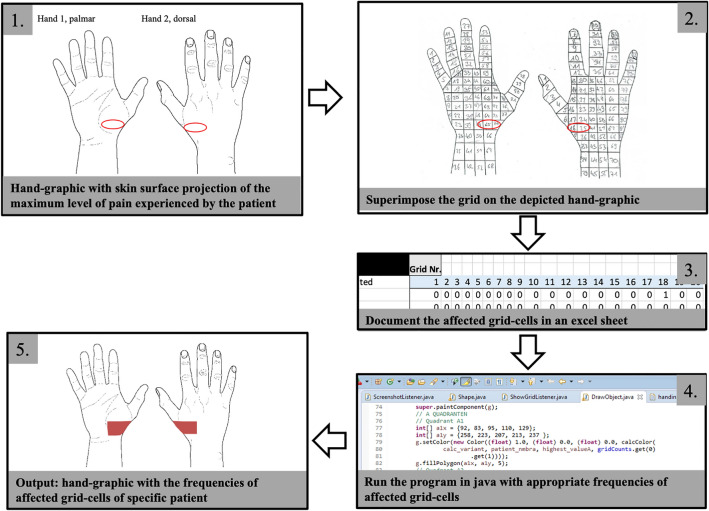
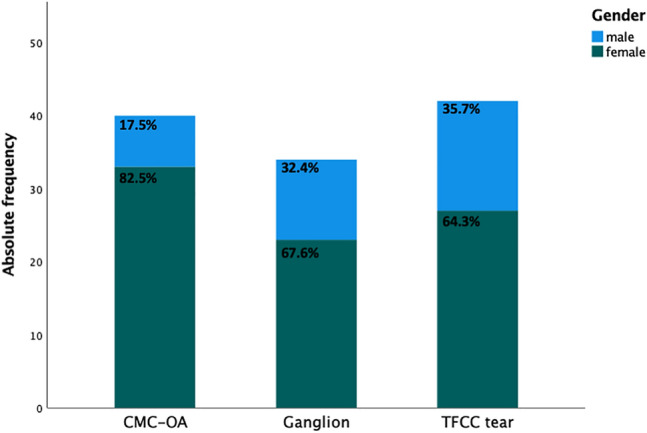
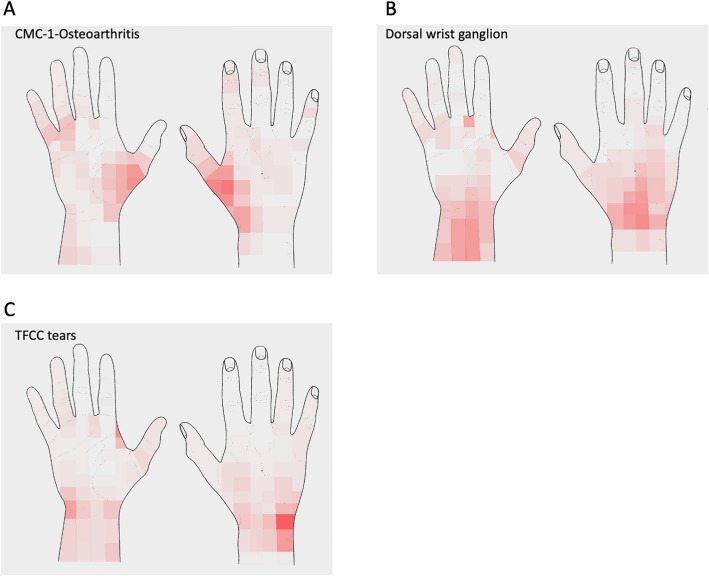
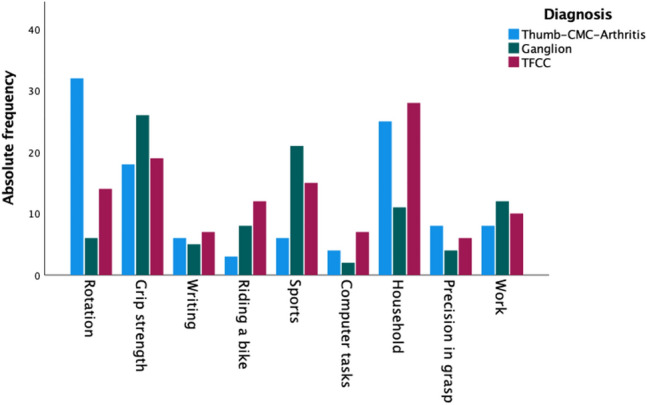
Methods: This observational cross-sectional study included patients suffering from: thumb basal joint arthritis (CMC-1-OA), dorsal wrist ganglions, and TFCC tears. Patients marked the location of maximum pain projection on hand graphics depicting the outline of the palmar and dorsal hand. Color-graded frequency heat maps were generated for the wrist pathologies investigated. Daily life impairments were assessed and clustered into groups of functions/activities.
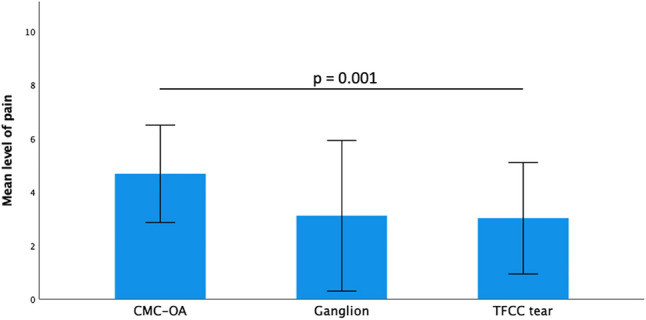
Results: 120 patients with a mean age of 44.3 years were investigated. The diagnostic groups showed significant differences regarding the level and location of pain, as well as daily life impairments. Patients with CMC-1-OA presented with increased pain levels compared to patients with dorsal wrist ganglions and TFCC tears. Daily life impairment was rated highest when household chores were adversely affected, and sport activities were symptomatic/painful. All groups showed significant skin surface pain projection, which was visualized in heatmaps. While general trends in pain localization were visible, pain levels were also reported distal/proximal and palmar/dorsal to the pathology.
Conclusions: Knowledge of main demographic parameters, pain projection, and degree of impairment in daily activities can help physicians to narrow differential diagnosis of wrist pain during first patient contact. Patients should then be referred to hand surgeons for specialist examination, to further differentiate the origin of the pain.
Keywords: CMC-1-Osteoarthritis; Ganglion; Hand surgery; TFCC tear; Trauma surgery; Wrist pain.
© 2022. The Author(s).
Conflict of interest statement
The authors have no commercial associations or financial disclosures that might pose or create a conflict of interest with the methods applied or the results presented in this article.
Figures
Similar articles
-
Ganglions of the wrist and associated triangular fibrocartilage lesions: a prospective study in arthroscopically-treated patients.J Hand Surg Am. 2012 Aug;37(8):1561-7. doi: 10.1016/j.jhsa.2012.04.042. Epub 2012 Jun 30. J Hand Surg Am. 2012. PMID: 22749480
-
Ulnar-sided wrist pain due to isolated disk tear of triangular fibrocartilage complex within the distal radioulnar joint: two case reports.Hand Surg. 2011;16(2):177-80. doi: 10.1142/S0218810411005308. Hand Surg. 2011. PMID: 21548155
-
Minimally invasive approaches to ulnar-sided wrist disorders.Hand Clin. 2014 Feb;30(1):77-89. doi: 10.1016/j.hcl.2013.09.001. Hand Clin. 2014. PMID: 24286746 Review.
-
What Is the Effect of the Ulnar-Plus Variance on the Outcomes of Arthroscopic Repair of the Peripheral Ulnar-Side Triangular Fibrocartilage Complex Tear?Arthroscopy. 2020 Sep;36(9):2415-2422. doi: 10.1016/j.arthro.2020.05.012. Epub 2020 May 20. Arthroscopy. 2020. PMID: 32442714
-
Arthroscopic-Assisted Triangular Fibrocartilage Complex Reconstruction.Hand Clin. 2017 Nov;33(4):625-637. doi: 10.1016/j.hcl.2017.07.014. Hand Clin. 2017. PMID: 28991575 Review.
Cited by
-
A scoping review to map evidence regarding key domains and questions in the management of non-traumatic wrist disorders.Hand Ther. 2024 Mar;29(1):3-20. doi: 10.1177/17589983231219595. Epub 2023 Dec 12. Hand Ther. 2024. PMID: 38425437 Free PMC article.
-
Bilateral ST-coalition with thumb hypoplasia and scaphoid synchondrosis.Arch Orthop Trauma Surg. 2024 Sep;144(9):4303-4308. doi: 10.1007/s00402-024-05529-6. Epub 2024 Sep 17. Arch Orthop Trauma Surg. 2024. PMID: 39287786
-
Epidemiology of hand injuries that presented to a tertiary care facility in Germany: a study including 435 patients.Arch Orthop Trauma Surg. 2023 Mar;143(3):1715-1724. doi: 10.1007/s00402-022-04617-9. Epub 2022 Sep 22. Arch Orthop Trauma Surg. 2023. PMID: 36138241 Free PMC article.
References
Publication types
MeSH terms
LinkOut - more resources
Full Text Sources
Medical
