. 2022 Jun 6;18(6):e1010212.
doi: 10.1371/journal.pgen.1010212. eCollection 2022 Jun.

Regulation of HLA class I expression by non-coding gene variations

Affiliations

Regulation of HLA class I expression by non-coding gene variations

Florence Bettens et al. PLoS Genet. .

Abstract

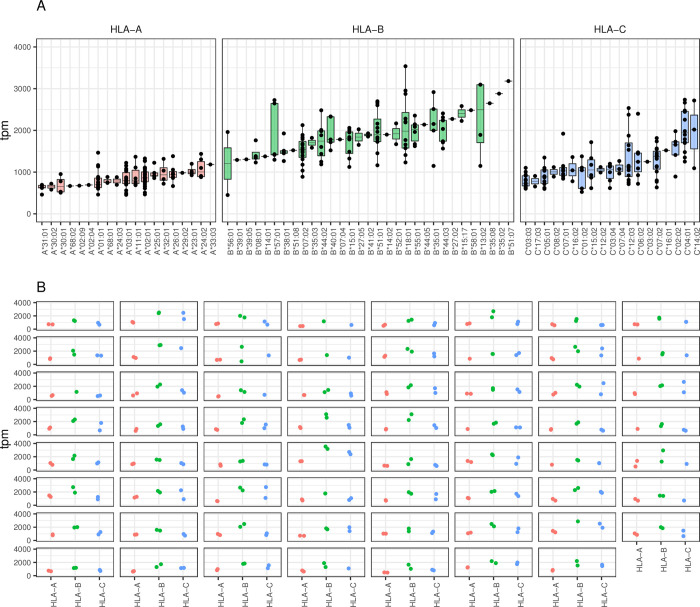
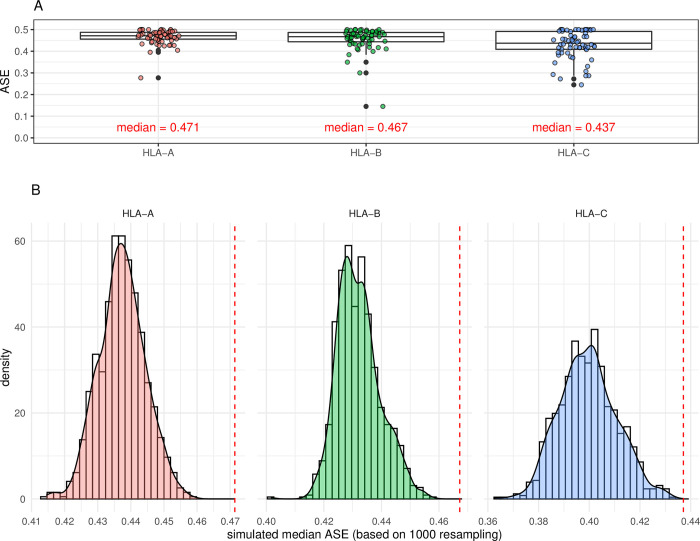
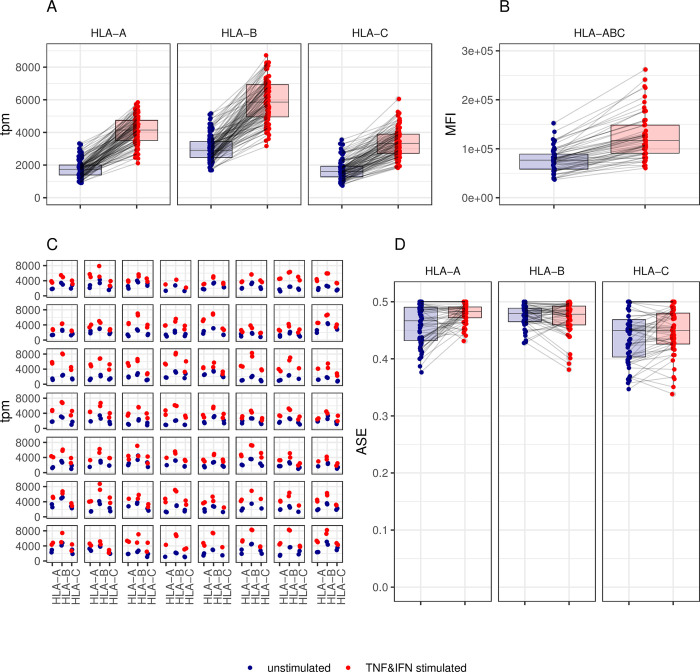
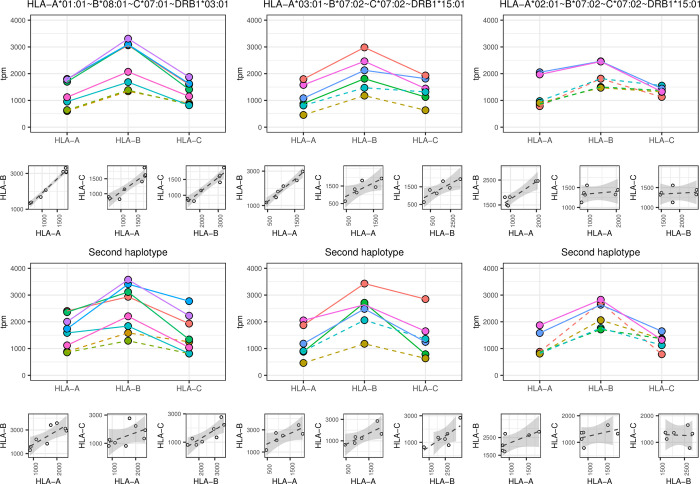
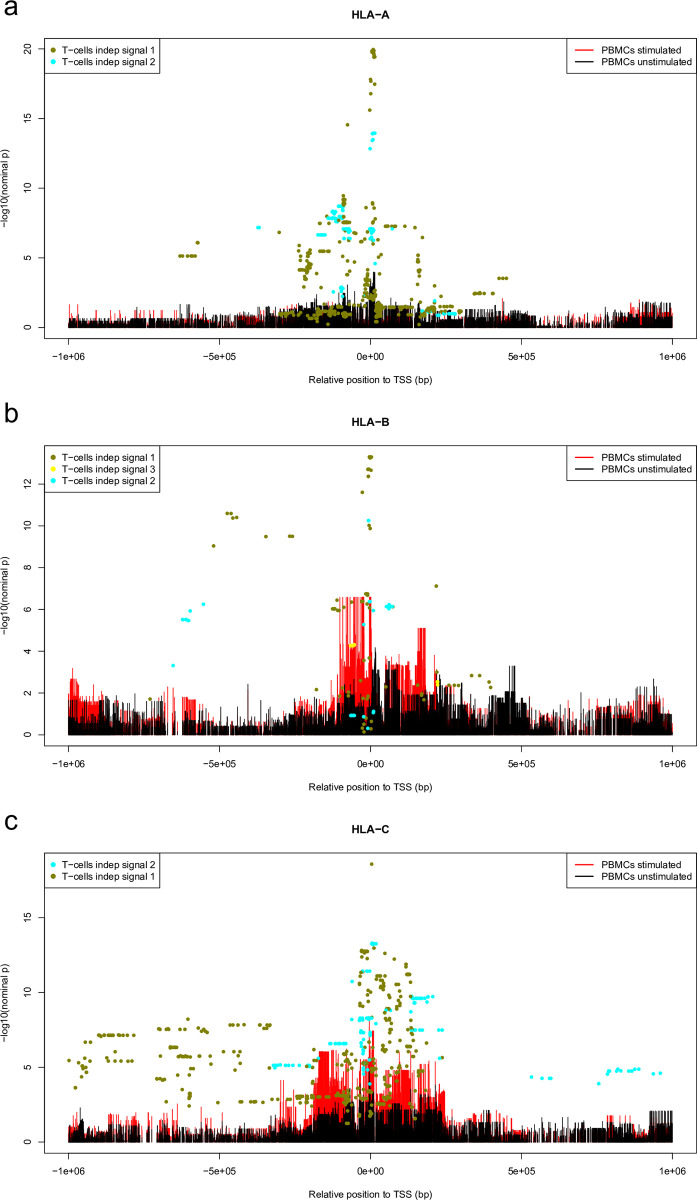
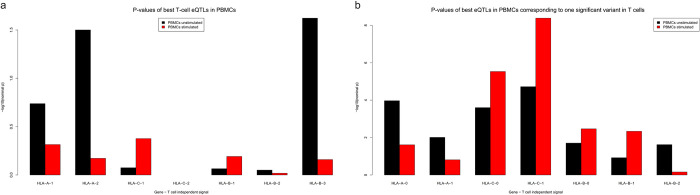
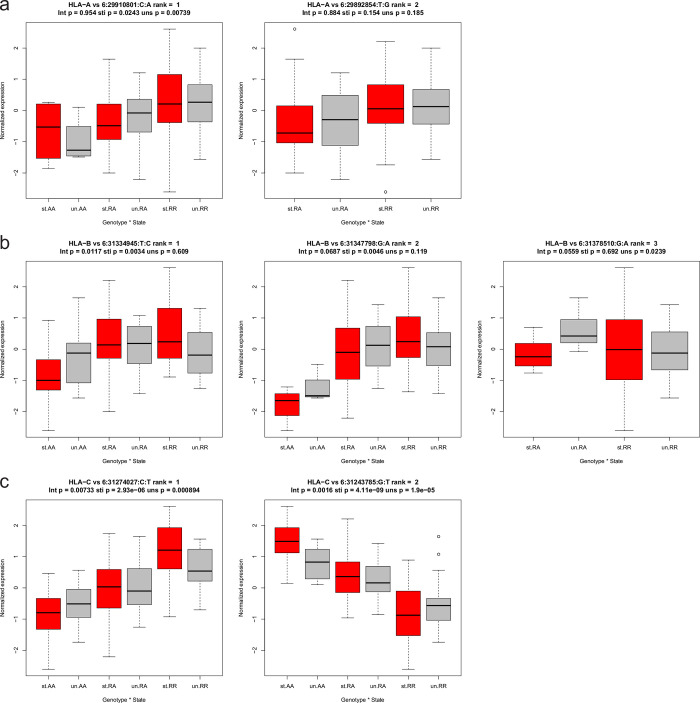
The Human Leukocyte Antigen (HLA) is a critical genetic system for different outcomes after solid organ and hematopoietic cell transplantation. Its polymorphism is usually determined by molecular technologies at the DNA level. A potential role of HLA allelic expression remains under investigation in the context of the allogenic immune response between donors and recipients. In this study, we quantified the allelic expression of all three HLA class I loci (HLA-A, B and C) by RNA sequencing and conducted an analysis of expression quantitative traits loci (eQTL) to investigate whether HLA expression regulation could be associated with non-coding gene variations. HLA-B alleles exhibited the highest expression levels followed by HLA-C and HLA-A alleles. The max fold expression variation was observed for HLA-C alleles. The expression of HLA class I loci of distinct individuals demonstrated a coordinated and paired expression of both alleles of the same locus. Expression of conserved HLA-A~B~C haplotypes differed in distinct PBMC's suggesting an individual regulated expression of both HLA class I alleles and haplotypes. Cytokines TNFα /IFNβ, which induced a very similar upregulation of HLA class I RNA and cell surface expression across alleles did not modify the individually coordinated expression at the three HLA class I loci. By identifying cis eQTLs for the HLA class I genes, we show that the non-coding eQTLs explain 29%, 13%, and 31% of the respective HLA-A, B, C expression variance in unstimulated cells, and 9%, 23%, and 50% of the variance in cytokine-stimulated cells. The eQTLs have significantly higher effect sizes in stimulated cells compared to unstimulated cells for HLA-B and HLA-C genes expression. Our data also suggest that the identified eQTLs are independent from the coding variation which defines HLA alleles and thus may be influential on intra-allele expression variability although they might not represent the causal eQTLs.


Conflict of interest statement

The authors have declared that no competing interests exist.

Figures

Fig 1
Fig 1. Gradient HLA class I expression at the allelic level.
Panel (A) HLA class I RNA expression measured in samples of PBMCs obtained from 63 individuals is plotted as tpm (transcript per million) per allele (indicated on the horizontal axis) for HLA-A, B and C. Nine-teen HLA-A, 31 HLA-B and 19 HLA-C unique alleles are detected. Mean expressions are 866±224, 1870±541and 1238±532 tpm for HLA-A, B and C, respectively. Each dot represents the expression of an allele in one individual. Note that the HLA typing inferred from RNA sequencing corresponded to the available high-resolution typing performed on DNA. Panel (B) Allelic expression is plotted per locus (horizontal axis) and per individual. Each facet represents one individual and each dot one allele.
Fig 2
Fig 2. ASE and permutations.
Panel (A) Allele specific expression (ASE) of the lowest expressed allele in relation to the expression of both alleles for the three HLA class I genes is plotted. Each dot represents one individual. The observed median is also shown for each locus. Panel (B) Empirical distributions of simulated ASE following a permutation procedure. In this approach, tpm values were shifted randomly among individuals if belonging to the same allele (i.e., permuting the observed tpm values among all carriers of a given allele and doing so for the whole cohort simultaneously). The procedure was replicated 1000 times and for each replicate ASE was computed in every individual for the three loci. The simulated median ASE was computed at each locus and plotted along a density curve and according to a discrete histogram distribution. The dotted red line represents the observed median ASE at a given locus (see panel (A) in comparison to the empirical distribution obtained through the resampling process.
Fig 3
Fig 3. Upregulation of expression induced by TNFα and IFNβ.
Panel (A) RNA expression of HLA class I alleles (given as tpm) is plotted in 56 PBMC samples stimulated overnight with (red dots) or without (blue dots) pro-inflammatory cytokines TNFα and IFNβ Each dot represents one allele of one PBMC sample. Panel (B) Cell surface expression of HLA-ABC as determined by flow cytometry is plotted and expressed as MFI for the same PBMCs tested just prior to RNA extraction. Panel (C) Allelic expression is plotted per locus (horizontal axis) and per individual. Each facet represents one individual, each dot one allele. The dots are colored according to the same code as in Panel (A). Panel (D) Allele specific expression (ASE) at the three HLA class I genes is plotted according to both stimulation conditions.
Fig 4
Fig 4. Allelic expression in PBMC carrying common HLA haplotypes.
The upper panels represent the RNA expression (in tpm) of alleles segregating on three common HLA haplotypes as indicated. In the lower panels, the RNA expression (in tpm) of the alleles belonging to the second haplotype is shown. Each individual carrying a given haplotype is shown with a different color code. Straight and dotted lines correspond to RNAs of cells kept in culture without stimulation overnight or of freshly isolated PBMCs, respectively. The HLA-typing of the second haplotype differ between samples sharing a common haplotype. Small facets represent the pairwise linear regression of expression between loci. The standard error of the regression is indicated as grey shedding.
Fig 5
Fig 5. The genomic locations of the eQTLs.
The genomic locations of the eQTL associations in the cis regions (± 1 Mb from the transcription start site) of HLA-A (a), HLA-B (b), and HLA-C (c). The x-axes are the relative position of the variants to the TSS, and the y-axes represent the significance of the eQTL association (-log10 nominal p-value). The colored bars show all the variants in the region and their eQTL p-values in stimulated and unstimulated PBMC cells. The colored points represent all the variants for each of the genome-wide significant independent eQTL signals in Blueprint T cells.
Fig 6
Fig 6. Comparison of best SNPs between T cells, unstimulated PBMCs and stimulated PBMCs.
(a) The -log10 nominal p-values of the best variant for a T-cell independent signal in PBMCs. (b) The -log10 nominal p-values of the best PBMC variant amongst all the significant variants for each of T-cell independent signals.
Fig 7
Fig 7. Association between eQTL genotypes and HLA expression in unstimulated versus stimulated PBMCs.
Interaction analysis boxplots showing the association between the independent eQTL genotypes (AA = homozygous alternative, RA = heterozygous, RR = homozygous reference) and normalized expression for HLA-A (a), HLA-B (b), and HLA-C (c). The stimulated cells are shown in red, and the unstimulated cells are in grey. The interaction p-value and the p-values in stimulated and unstimulated cells are provided in the titles of the boxplots.

References

    1. Klein J, Sato A. The HLA system. First of two parts. N Engl J Med. 2000;343(10):702–9. Epub 2000/09/07. doi: 10.1056/NEJM200009073431006 . - DOI - PubMed
    1. Parham P. MHC class I molecules and KIRs in human history, health and survival. NatRevImmunol. 2005;5(3):201–14. doi: 10.1038/nri1570 - DOI - PubMed
    1. Petersdorf EW. Genetics of graft-versus-host disease: the major histocompatibility complex. Blood Rev. 2013;27(1):1–12. Epub 2012/11/28. doi: 10.1016/j.blre.2012.10.001 ; PubMed Central PMCID: PMC3626414. - DOI - PMC - PubMed
    1. Apps R, Qi Y, Carlson JM, Chen H, Gao X, Thomas R, et al.. Influence of HLA-C expression level on HIV control. Science. 2013;340(6128):87–91. Epub 2013/04/06. doi: 10.1126/science.1232685 ; PubMed Central PMCID: PMC3784322. - DOI - PMC - PubMed
    1. Ramsuran V, Hernandez-Sanchez PG, O’HUigin C, Sharma G, Spence N, Augusto DG, et al.. Sequence and Phylogenetic Analysis of the Untranslated Promoter Regions for HLA Class I Genes. J Immunol. 2017;198(6):2320–9. doi: 10.4049/jimmunol.1601679 ; PubMed Central PMCID: PMC5340644. - DOI - PMC - PubMed

Publication types