. 2022 Jun 6;18(6):e1010577.
doi: 10.1371/journal.ppat.1010577. eCollection 2022 Jun.

Pertussis toxin suppresses dendritic cell-mediated delivery of B. pertussis into lung-draining lymph nodes

Affiliations

Pertussis toxin suppresses dendritic cell-mediated delivery of B. pertussis into lung-draining lymph nodes

Nela Klimova et al. PLoS Pathog. .

Abstract

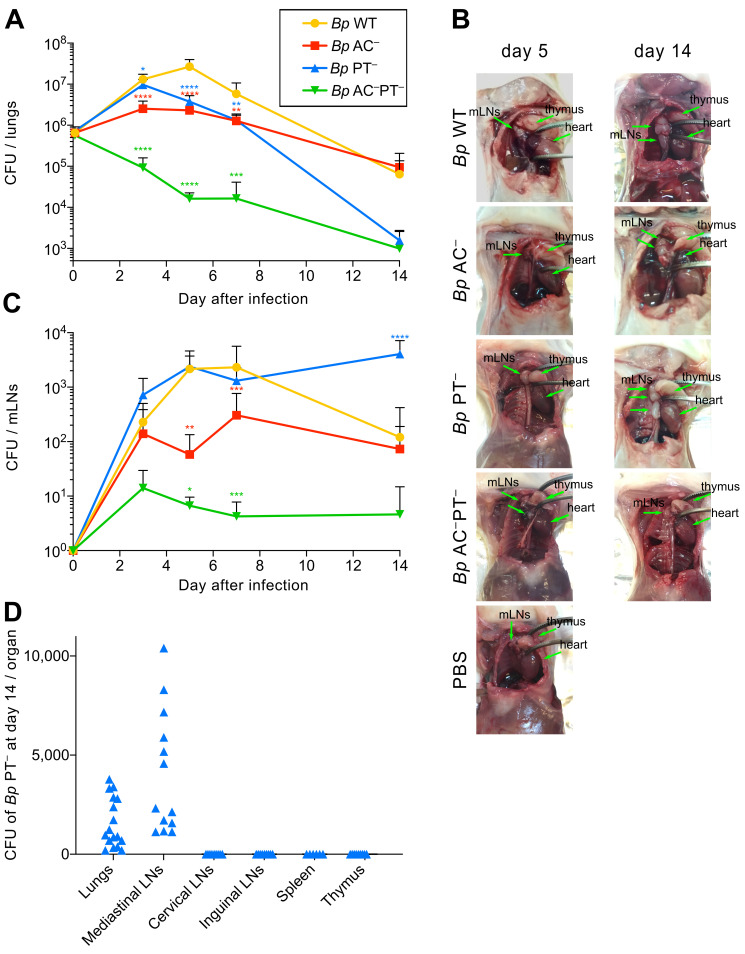
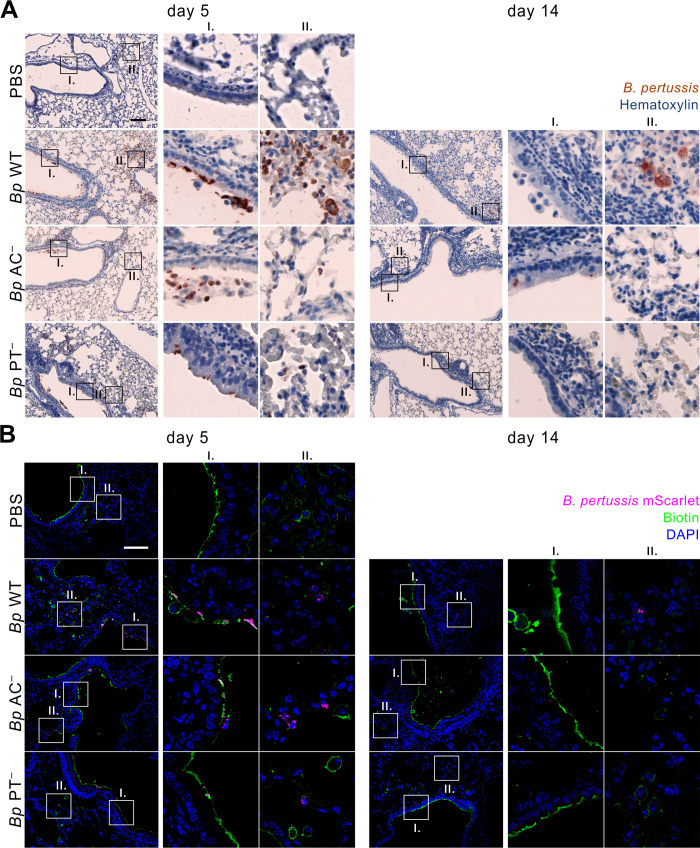
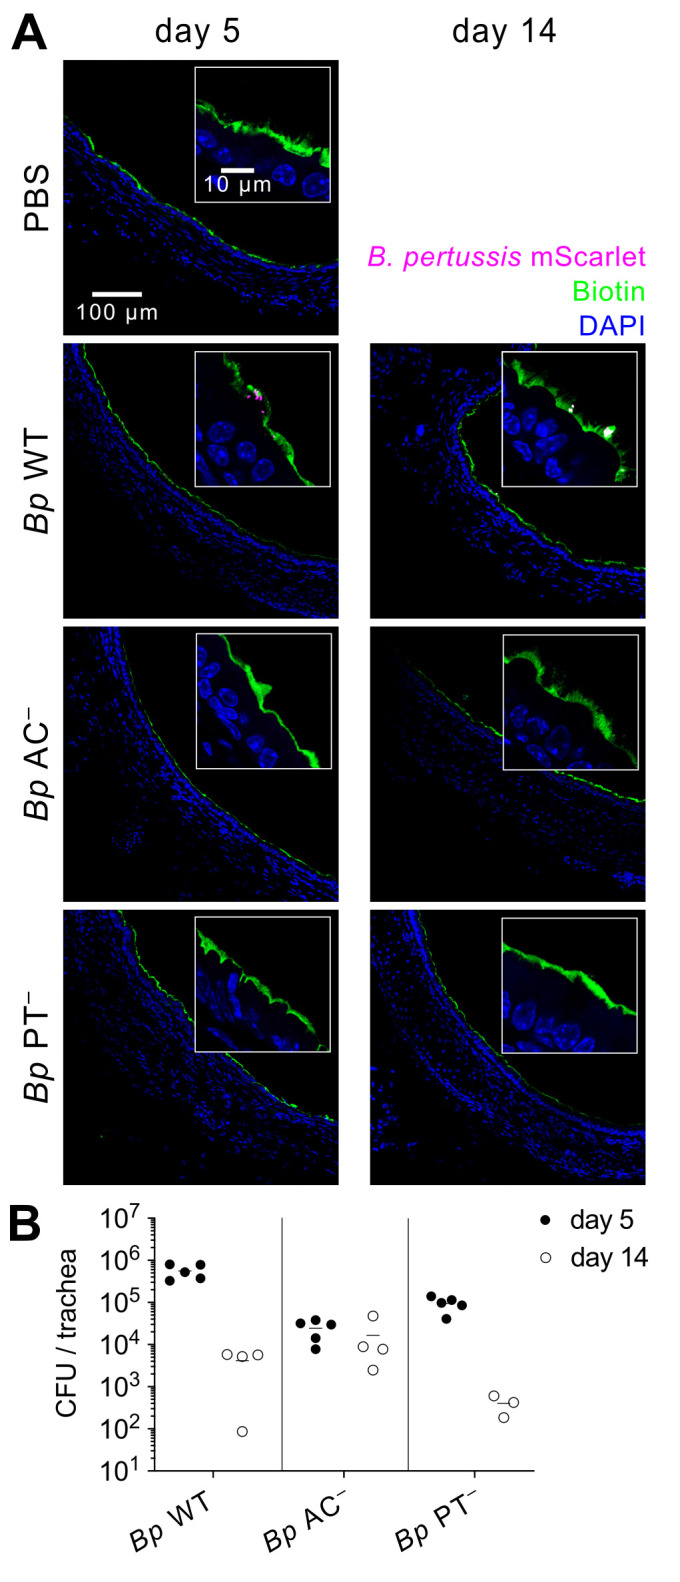
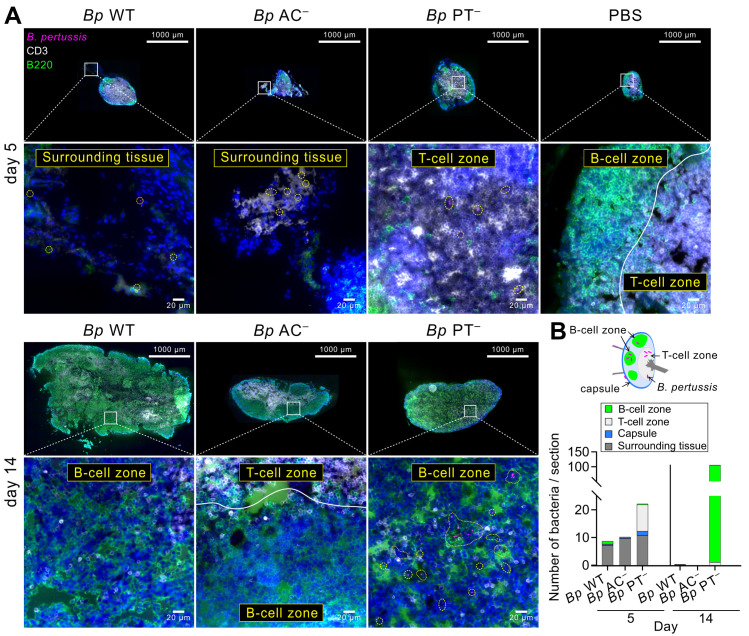
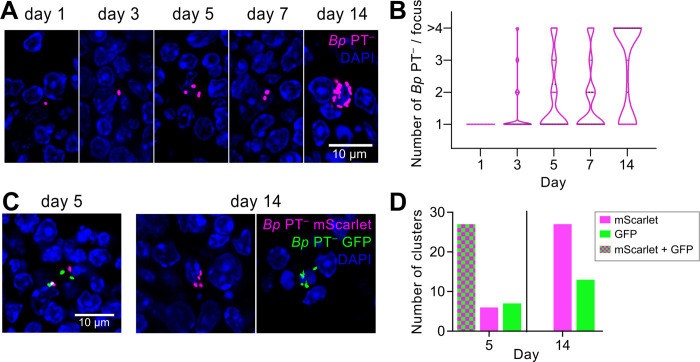
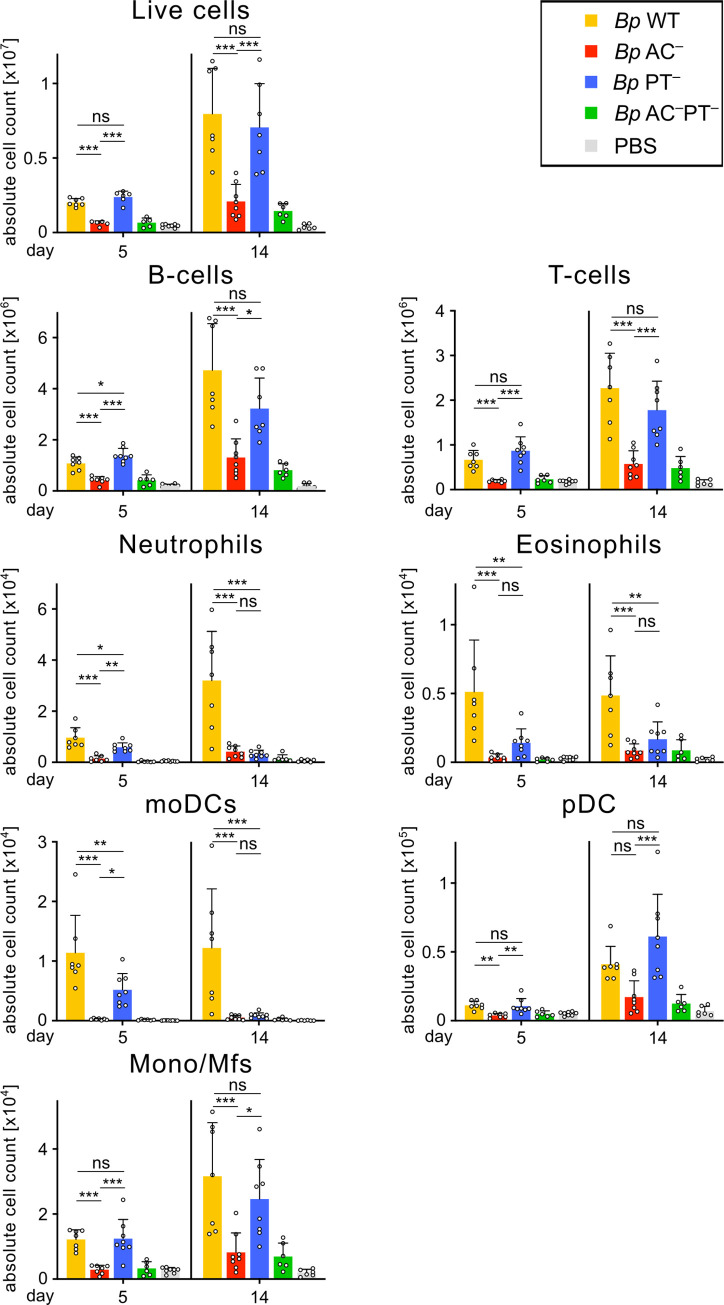
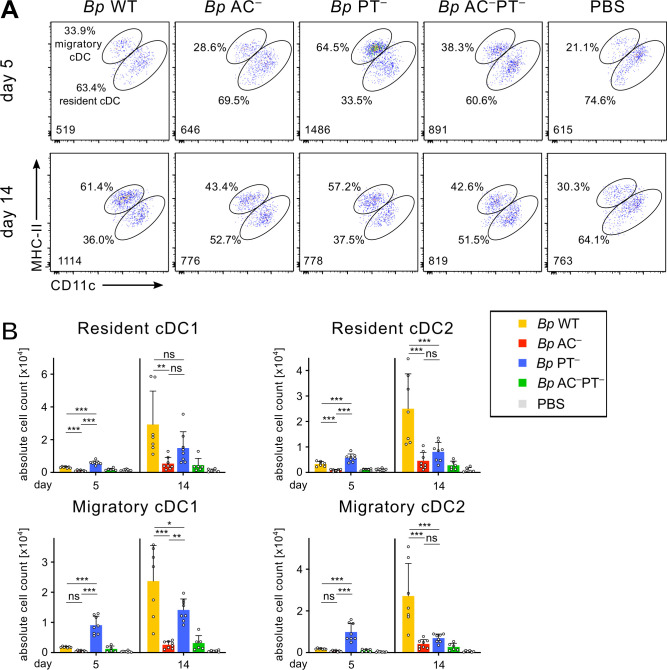
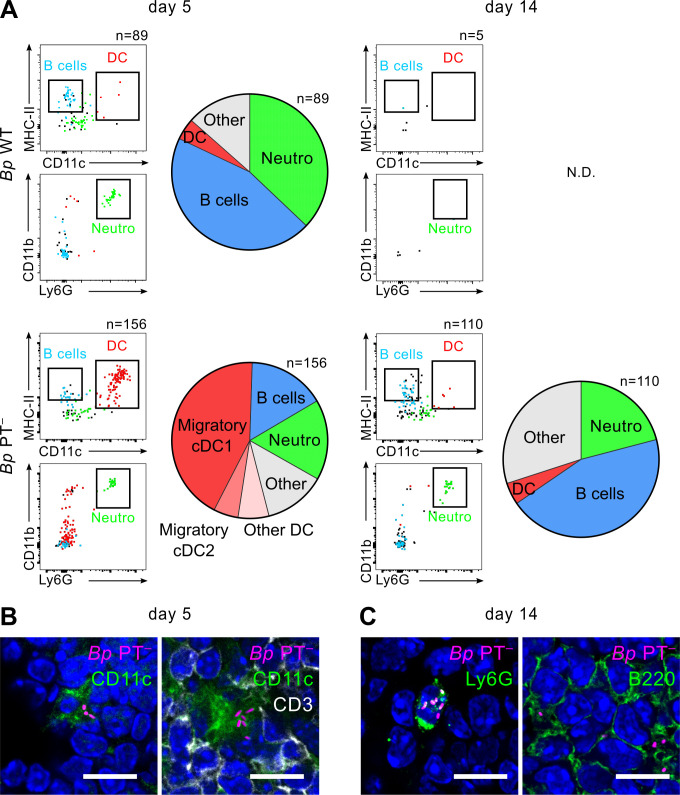
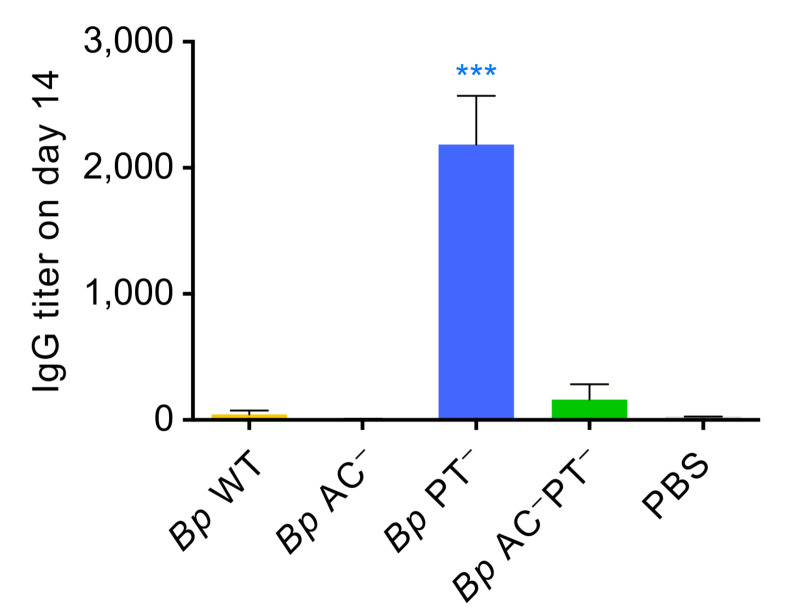
The adenylate cyclase (ACT) and the pertussis (PT) toxins of Bordetella pertussis exert potent immunomodulatory activities that synergize to suppress host defense in the course of whooping cough pathogenesis. We compared the mouse lung infection capacities of B. pertussis (Bp) mutants (Bp AC- or Bp PT-) producing enzymatically inactive toxoids and confirm that ACT action is required for maximal bacterial proliferation in the first days of infection, whereas PT action is crucial for persistence of B. pertussis in mouse lungs. Despite accelerated and near complete clearance from the lungs by day 14 of infection, the PT- bacteria accumulated within the lymphoid tissue of lung-draining mediastinal lymph nodes (mLNs). In contrast, the wild type or AC- bacteria colonized the lungs but did not enter into mLNs. Lung infection by the PT- mutant triggered an early arrival of migratory conventional dendritic cells with associated bacteria into mLNs, where the PT- bacteria entered the T cell-rich paracortex of mLNs by day 5 and proliferated in clusters within the B-cell zone (cortex) of mLNs by day 14, being eventually phagocytosed by infiltrating neutrophils. Finally, only infection by the PT- bacteria triggered an early production of anti-B. pertussis serum IgG antibodies already within 14 days of infection. These results reveal that action of the pertussis toxin blocks DC-mediated delivery of B. pertussis bacteria into mLNs and prevents bacterial colonization of mLNs, thus hampering early adaptive immune response to B. pertussis infection.


Conflict of interest statement

The authors have declared that no competing interests exist.

Figures

Fig 1
Fig 1. PT-deficient B. pertussis is cleared from lungs but persists in mediastinal lymph nodes.
(A) B. pertussis colonization of lungs after intranasal administration of the wild-type (Bp WT) and mutant B. pertussis strains producing the catalytically-inactive pertussis toxin (PT), the catalytically-inactive adenylate cyclase toxin (AC) or a combination of both toxoids (ACPT). Four-week-old BALB/c mice were intranasally challenged with 8 × 10⁵ CFU (in 50 μl) of the bacteria expressing the mScarlet fluorescent protein. The total number of bacteria in the lungs at the indicated time points was determined by CFU counting upon plating of lung homogenates on BG blood agar plates. Data represent the mean values with standard deviation obtained from groups of at least three mice per time point in three independent experiments. Two-way ANOVA followed by Dunnett’s multiple comparisons test was used to analyze statistical significance between groups. * (p < 0.05), ** (p < 0.01), *** p (< 0.001), **** (p < 0.0001). (B) Examination of mediastinal lymph nodes (mLNs) on day 5 and 14 post infection. The location of the mLNs, thymus, and heart is indicated by arrows. (C) B. pertussis colonization of mLNs. The mLNs of a mouse sacrificed at the indicated time point were pooled and the homogenate was plated on BG blood agar for subsequent CFU counting. Data represent the means with standard deviations obtained from at least three mice per group and time point in three independent experiments. Two-way ANOVA followed by Dunnett’s multiple comparisons test was used to analyze statistical significance between groups. * (p < 0.05), ** (p < 0.01), *** p (< 0.001), **** (p < 0.0001). (D) B. pertussis colonization of lungs and lymphoid organs on day 14 after intranasal administration of the B. pertussis PT strain. The number of bacteria in the lungs and lymphoid organs on day 14 postinfection was determined by plating of organ homogenates on BG blood agar. LNs from each mouse were pooled.
Fig 2
Fig 2. Enhanced Bp PT accumulation in mLNs is not due to enhanced penetration of Bp PT bacteria into lung parenchyma.
(A) Immunohistochemistry of longitudinal lung sections from infected mice on day 5 (left panel) and day 14 (right panel) after intranasal administration of PBS (control) or 8 × 10⁵ CFU of the indicated B. pertussis mScarlet-producing strains. Lungs were fixed with 4% PFA, embedded in paraffin and examined upon immunohistochemical staining of 2 μm sections with polyclonal rabbit anti-B. pertussis serum. Details of bronchial epithelium (I.) and lung parenchyma (II.) are indicated. Data represent representative images of groups of three mice analyzed in two independent experiments. Scale bar 100 μm. (B) Epithelial lining of infected mouse lungs on day 5 (left panel) and day 14 (right panel). At indicated time points, the epithelial lining of the airways of mice was labeled in vivo by intranasal administration of 50 μl NHS biotin (1 mg/ml) for 5 minutes before the animals were euthanized. Lungs were fixed with 4% PFA, snap frozen and 10 μm longitudinal cryosections of the left lobes were labeled with Alexa Fluor 488 streptavidin conjugate. Images were acquired using a Leica TCS SPE confocal microscope. Nuclei were visualized by DAPI staining. Details of bronchial epithelium (I.) and lung parenchyma (II.) are indicated. Biotin, nuclei and bacteria are rendered in green, blue, and magenta colors, respectively. The images are representative of one experiment performed in groups of three mice. Scale bar 100 μm.
Fig 3
Fig 3. Bp PT does not cause enhanced disintegration of airway epithelial lining.
(A) Tracheal epithelial lining of infected mouse lungs on day 5 (left panel) and day 14 (right panel). At indicated time points, the epithelial lining of the airways of mice was labeled in vivo by intranasal administration of 50 μl NHS biotin (1 mg/ml) for 5 minutes before the animals were euthanized. Respiratory tracts were fixed with 4% PFA, snap frozen and 10 μm transversal cryosections of tracheas were labeled with Alexa Fluor 488 streptavidin conjugate. Nuclei were visualized by DAPI staining. Images were acquired using a Leica TCS SPE confocal microscope. Biotin, nuclei and bacteria are rendered in green, blue, and magenta colors, respectively. The images are representative of one experiment performed in groups of three mice. Scale bar 100 μm. (B) Bacterial load in the trachea of infected mice on day 5 (full circles) and day 14 (open circles). Each symbol represents an individual animal, and the lines indicate the means. Data were pooled from two independent experiments.
Fig 4
Fig 4. PT-producing B. pertussis does not enter the lymphoid tissue of mLNs, whereas Bp PT bacteria enter the T-cell zone and expand in the B-cell zone of mLNs.
(A) Immunofluorescence microscopy of cryosections of mLNs of infected mice on days 5 (upper panel) and 14 (lower panel). mLNs were fixed with 4% PFA, snap frozen and 10 μm longitudinal cryosections were first labeled with rat anti-mouse CD45R (B220), followed by goat anti-rat Alexa Fluor 488 secondary antibody conjugate and finally by Alexa Fluor 647 rat anti-mouse CD3 antibody conjugate. Nuclei were labeled with DAPI. Stitched images were acquired at 40x magnification using an Olympus IX83 motorized automated microscope. Upper panels show representative images of entire mLN sections (scale bar 1000 μm). The white squares locate the zoomed-in areas shown in lower panels (see S6, S7, S8 and S9 Figs for high resolution images). Lower panels depict the details of the indicated areas (scale bar 20 μm). The mScarlet-expressing bacteria are encircled by yellow dotted lines. T cells, B cells, nuclei and bacteria are rendered in white, green, blue and magenta colors, respectively. In total 8 mLNs from three mice per infection group were examined and representative images are shown. (B) Location of bacteria on mLN sections. Individual bacteria were counted across entire mLN sections and location of bacteria in the indicated mLN zones (schematic drawing) was recorded. Mean bacterial counts of 6 mLN sections from 3 mice per infection group are shown.
Fig 5
Fig 5. PT-deficient B. pertussis bacteria proliferate in mLNs.
(A) Accumulation of mScarlet-producing Bp PT bacteria in the mLNs of infected mice. 30 μm cryosections of mLNs were examined by confocal microscopy. Scale bar 10 μm. (B) Quantification of bacterial clustering in the mLNs. Violin plots of the number of detected bacteria per site at the indicated time points. 30 randomly selected fluorescent foci containing at least one bacterium were examined per time point. Clusters containing more than 4 individual bacteria were categorized as > 4. Data were obtained from serial cryosections of at least three mLNs in one experiment. (C) Representative mLN cryosections (30 μm) from day 5 and 14 of mice infected with a 1:1 mixture of Bp PT strains producing mScarlet (magenta) and GFP (green) fluorescent proteins. Images were acquired at 63x magnification using a Leica TCS SPE confocal microscope. (D) Quantification of unicolor and multicolor clusters in mLNs of mice challenged with a 1:1 mixture of Bp PT strains producing mScarlet and GFP fluorescent proteins. 40 randomly selected bacterial clusters containing at least 2 individual bacterial cells were analyzed per time point. The predominance of mScarlet- over GFP-labeled unicolor clusters was not due to enhanced fitness but rather reflected easier microscopic detection of the brighter mScarlet-producing bacteria. Comparable numbers of magenta and green fluorescent colonies were recovered by plating of mLN homogenates on BG blood agar plates. Data were obtained from serial cryosections of at least six mLNs derived from groups of at least two mice from three independent experiments.
Fig 6
Fig 6. ACT activity drives immune cell accumulation in mLNs.
Total counts of cells per mLN pool per infected mouse on day 5 and 14. Mice were intranasally infected with 8 × 10⁵ CFU of the indicated B. pertussis strains expressing mScarlet fluorescent protein. Collected mLNs were pooled, enzymatically disrupted and the cell suspensions were analyzed by flow cytometry using a panel of monoclonal antibodies and cell counting beads. Each symbol represents the value for an individual animal. Data represent mean values and standard deviations for groups of four mice per time point (or 2 mice in Bp ACPT group) from two independent experiments. Statistical significance between groups was analyzed by one-way ANOVA followed by Tukey’s multiple comparisons test. * (p < 0.05), ** (p < 0.01), *** p (< 0.001). moDCs, monocyte-derived dendritic cells; pDCs, plasmacytoid dendritic cells; Mono/Mfs, monocytes/macrophages.
Fig 7
Fig 7. PT activity blocks early arrival of migratory cDCs from infected lungs to mLNs.
Mice were intranasally infected with 8 × 10⁵ CFU of the indicated B. pertussis strains expressing mScarlet fluorescent protein. Collected mLNs were pooled, enzymatically disrupted and the cell suspensions were analyzed by flow cytometry using a panel of monoclonal antibodies and cell counting beads. (A) Representative dot plots of the migratory cDCs (MHC-IIhighCD11cint) and resident cDCs (MHC-IIintCD11chigh) detected in mLNs of infected mice on day 5 (upper panel) and 14 (lower panel). The indicated conventional dendritic cell (cDC) numbers (lower left corners) were gated-out from 100,000 viable singlets per sample as described in S12 Fig. The percentage (%) of cDC subpopulations are indicated. (B) Total counts of migratory and resident cDC1 (CD11b) and cDC2 (CD11b+) cells in mLNs of infected mice on days 5 and 14. Each symbol represents the value for an individual animal. Data represent mean values and standard deviations for groups of four mice per time point (or 2 mice in Bp ACPT group) from two independent experiments. Statistical significance between groups was analyzed by one-way ANOVA followed by Tukey’s multiple comparisons test. * (p < 0.05), ** (p < 0.01), *** p (< 0.001).
Fig 8
Fig 8. Bp PT bacteria are delivered into mLNs by migratory cDC1 cells.
mLNs of mice infected with 50 μL of bacterial suspension containing 8 x 10⁵ CFU of the mScarlet+ B. pertussis strains were collected and pooled on days 5 and 14 using 4 mice per condition. (A) Cellular suspensions of mLNs were prepared by enzymatic disruption and cellular subpopulations were stained with a panel of fluorescently-labeled antibodies and analyzed by flow cytometry. The indicated numbers represent mScarlet+ cells detected per 2 x 10⁶ events on day 5 and 14, except for day 14 of the mLN sample of mice infected by Bp PT, where the sample of analyzed cells was increased to 6 x 10⁶ events. mScarlet+ cells associated with Bp bacteria were detected using 585/15 nm emission filter and the gate was set using cellular suspension of mLNs from mice infected with the non-fluorescent control bacteria (S14 Fig). Bp-associated cells were visualized in simple dot plots from down-sampled live mScarlet+ events (left panels): MHC-II+ CD11c+ dendritic cells (DC, red dots), CD19+CD3 B cells (blue dots, S14 Fig) and CD11b+Ly6G+ neutrophils (green dots). Pie charts on the right-hand panels show the distribution of subpopulations of mScarlet+ cells determined by in depth phenotyping (see S12 Fig for gating strategy). Data from one representative experiment out of 3 (Bp WT) or 4 (Bp PT) performed are shown. (B) and (C) In parallel to cytometric analysis, cryosections of mLNs from Bp PT-infected mice were prepared on days 5 and 14 and mScarlet+ cells were visualized by immunofluorescence microscopy. (B) CD11c+ dendritic cells were detected on day 5 with biotin-conjugated anti-CD11c followed by AF488-conjugated streptavidin (green). T cells were detected with AF647-labeled anti-CD3 (white). (C) on day 14, neutrophils were detected with biotin-conjugated rat Ly6G antibody followed by AF488-conjugated streptavidin (green) and B cells were detected with rat anti-B220 antibody followed by goat anti-rat AF488-labeled secondary antibody (green). Images were acquired at 63x magnification using Leica TCS SPE confocal microscope. Scale bar 10 μm.
Fig 9
Fig 9. PT action prevents early adaptive immune response to B. pertussis infection.
Sera of mice were collected 14 days after infection with 8 x 10⁵ CFU of the indicated B. pertussis strains (mScarlet+). Total anti-B. pertussis IgG antibody titters were determined by whole bacterial cell ELISA using plates coated with heat-killed B. pertussis (Tohama I). Mean antibody titers were determined as the inflection points of titration curves +/- SD. Pools of sera from 2 mice from two independent experiments (total n = 4 mice/group) were analyzed in technical triplicates. Groups were compared to Bp WT using one-way ANOVA with Dunnett’s multiple comparisons test. * p < 0.05, ** p < 0.01, *** p < 0.001, **** p < 0.0001.

References

    1. Melvin JA, Scheller E V., Miller JF, Cotter PA. Bordetella pertussis pathogenesis: current and future challenges. Nat Rev Microbiol 2014 124. 2014;12: 274–288. doi: 10.1038/nrmicro3235 - DOI - PMC - PubMed
    1. Mattoo S, Cherry JD. Molecular pathogenesis, epidemiology, and clinical manifestations of respiratory infections due to Bordetella pertussis and other Bordetella subspecies. Clinical Microbiology Reviews. 2005. pp. 326–382. doi: 10.1128/CMR.18.2.326-382.2005 - DOI - PMC - PubMed
    1. Belcher T, Dubois V, Rivera-Millot A, Locht C, Jacob-Dubuisson F. Pathogenicity and virulence of Bordetella pertussis and its adaptation to its strictly human host. Virulence. 2021;12: 2608–2632. doi: 10.1080/21505594.2021.1980987 - DOI - PMC - PubMed
    1. Yeung KHT, Duclos P, Nelson EAS, Hutubessy RCW. An update of the global burden of pertussis in children younger than 5 years: a modelling study. Lancet Infect Dis. 2017;17: 974–980. doi: 10.1016/S1473-3099(17)30390-0 - DOI - PubMed
    1. Althouse BM, Scarpino S V. Asymptomatic transmission and the resurgence of Bordetella pertussis. BMC Med. 2015;13. doi: 10.1186/s12916-015-0382-8 - DOI - PMC - PubMed

Publication types

Substances