. 2022 Aug 3;82(15):2761-2776.
doi: 10.1158/0008-5472.CAN-21-4009.

A Programmable In Vivo CRISPR Activation Model Elucidates the Oncogenic and Immunosuppressive Functions of MYC in Lung Adenocarcinoma

Affiliations

A Programmable In Vivo CRISPR Activation Model Elucidates the Oncogenic and Immunosuppressive Functions of MYC in Lung Adenocarcinoma

Fredrik I Thege et al. Cancer Res. .

Abstract

Conventional genetically engineered mouse models (GEMM) are time-consuming, laborious, and offer limited spatiotemporal control. Here, we describe the development of a streamlined platform for in vivo gene activation using CRISPR activation (CRISPRa) technology. Unlike conventional GEMMs, this model system allows for flexible, sustained, and timed activation of one or more target genes using single or pooled lentiviral guides. Myc and Yap1 were used as model oncogenes to demonstrate gene activation in primary pancreatic organoid cultures in vitro and enhanced tumorigenic potential in Myc-activated organoids when transplanted orthotopically in vivo. Implementation of this model as an autochthonous lung cancer model showed that transduction-mediated activation of Myc led to accelerated tumor progression and significantly reduced overall survival relative to nontargeted tumor controls. Furthermore, Myc activation led to the acquisition of an immune suppressive, "cold" tumor microenvironment. Cross-species validation of these results using publicly available RNA/DNA-seq datasets linked MYC to a previously described immunosuppressive molecular subtype in patient tumors, thus identifying a patient cohort that may benefit from combined MYC- and immune-targeted therapies. Overall, this work demonstrates how CRISPRa can be used for rapid functional validation of putative oncogenes and may allow for the identification and evaluation of potential metastatic and oncogenic drivers through competitive screening.

Significance: A streamlined platform for programmable CRISPR gene activation enables rapid evaluation and functional validation of putative oncogenes in vivo.


Conflict of interest statement

Conflict of interest disclosure statement:

A.M. receives royalties from Cosmos Wisdom Biotechnology and Thrive Earlier Detection, an Exact Sciences Company. A.M. is also a consultant for Freenome and Tezcat Biotechnology.

Figures
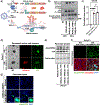
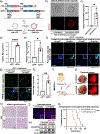
Figure 1
Figure 1. Development and validation of the LSL-SAM mouse model.
(a) Schematic of the CRISPR activation/SAM platform. (b) PCR of R26 knock-in (right and left homology arms), intact LSL cassette, and LSL-SAM genotyping. (c) LSL-SAM copy number determination, One-way ANOVA with Tukey’s multiple comparison test. (d) Fluorescent pancreatic acinar clusters from CSY and CY mice, scale bar 200 μm. (e) IB of dCas9VP64 and YFP in pancreatic tissues from CSY and CY mice and total protein loading control, (f) IF for dCas9VP64 in pancreas tissues from CSY and CY mice, dCas9VP64 (green), α-amylase (red), DAPI (blue), scale bar 20 μm. (g) Sporadic nuclear expression of dCas9VP64 in pancreas tissues from R26(LSL-SAM/+) mice transduced with CMV-Cre lentivirus 10 days post transduction, and untreated control, dCas9VP64 (green), DAPI (blue), scale bar 20 μm.
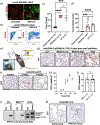
Figure 2
Figure 2. Ex vivo gene activation in pancreatic organoids enhanced tumorigenic potential following Myc-activation.
(a) (top) Schematic of the CMV-Cre-U6-sgRNA(MS2) and CMV-CreERT2-P2A-puroR/zeoR/hygR-U6-sgRNA(MS2) lentiviral vectors, (bottom) ex vivo gene activation in LSL-SAM pancreatic organoids. (b) SAM construct activation pancreatic organoids. mCherry (red), scale bar 100 μm. (c) qPCR of dCas9VP64 in induced pancreas organoids (4OHT+), relative to controls (4OHT-). (d) qPCR in organoids transduced with Myc-targeted (sgMyc) and non-targeted (sgNT) lentivirus, n = 3. (e) qPCR in LSL-SAM pancreatic organoids transduced with Yap1-targeted (sgYap) and non-targeted (sgNT) lentivirus, n = 3. (f) Wholemount IF for MYC (left) and YAP1 (right) in sgMyc, sgYap and sgNT LSL-SAM pancreatic organoids, MYC/YAP1 (green), DAPI (blue), scale bar 100 μm. (g) Wholemount IF for MYC in PPKS/M and PPKS/NT pancreatic organoids, MYC (green), DAPI (blue), scale bar 100 μm. (h) qPCR for Myc in PPKS/M and PPKS/NT pancreatic organoids, n = 3. (i) Schematic of orthotopic transplantation of oncogene activated PPKS pancreatic organoids. (j) Organoid-derived Myc-activated (TX PPKS/M) and non-targeted (TX PPKS/NT) pancreas tumors, color image (left), macroscopic mCherry fluorescence image (right), scale bar 1 cm. (k) H&E staining of TX PPKS/M and TX PPKS/NT tumors. Scale bars 100 μm (left) and 20 μm (right). (l) IF of MYC in TX PPKS/M and TX PPKS/NT tumors. MYC (red), DAPI (blue). Scale bar 20 μm. (m) IB of dCas9VP64, MYC and β-actin in TX PPKS/M and TX PPKS/NT tumors. (n) Kaplan-Meier survival graph of TX PPKS/M and TX PPKS/NT transplanted mice. Mantel-Cox (logrank) test. (c), (d), (e), (h) Significance tested with unpaired two-tailed Student’s t-test.
Figure 3
Figure 3. Optimization of lentiviral production, quantification and transduction for in vivo gene activation.
(a) DsRed to GFP color-switching Cre-reporter cell line (LRLG), scale bar 100 μm. (b) Lenti Cre-titer quantification, untransduced (left) and CMV-Cre transduced LRLG cells (right). (c) Comparison of PEG/NaCl-precipitation and ultracentrifugation (UC) of Cre lentivirus. (d) Precipitation and ultracentrifugation concentration factor. (e) Schematic of nasal instillation of Cre lentivirus in R26(LSL-YFP) mice. (f) IHC for GFP in mouse lung parenchyma 10 days (middle) and 4 weeks (right) following CMV-GFP lentivirus treatment, and control (left), scale bars 100 μm. (g) LSL-YFP recombination in R26(LSL-YFP) reporter mouse lung parenchyma 10 days following CMV-Cre lentivirus treatment, scale bar 100 μm. (h) qIHC of YFP 10 days following CMV-Cre lentivirus treatment, n = 4 – 6 per concentration. (i) CMV-Cre and Ef1a-Cre driven YFP recombination, unpaired two-tailed Student’s t-test. (j) PCR showing retained viral payload (Cre sequence, left), and YFP (middle) and Kras (right) recombination in PPKY/LV tumors, somatic (tail) DNA as control. (k) IHC of Cre in lung parenchymal 10 days after CMV-Cre lentivirus transduction (left) and in PPKY/LV tumors (right), scale bar 100 μm. (c), (d) Significance tested with one-way ANOVA with Tukey’s multiple comparison test.
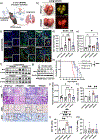
Figure 4
Figure 4. Tumor-initiation and in vivo oncogene activation through lentiviral transduction in the CRISPRa/SAM lung tumor model.
(a) Schematic of the autochthonous CRISPRa/SAM gene activation lung tumor model. (b) Macroscopic and fluorescent images of PPKY/LV (top), and PPKS/M lung tumors (bottom), scale bar 1cm. (c) IF of PPKS/M and PPKS/Y lung tumors, with PPKY/LV and PPKS/NT controls. dCas9VP64 (green), MYC/YAP1 (red), DAPI (blue), scale bar 40 μm. (d) Myc transcript expression (rlog) in PPKY/LV, PPKS/NT, PPKS/M and PPKS/Y tumors. (e) Yap1 transcript expression (rlog). (f) IB of MYC, YAP1 and β-actin in PPKS/M, PPKS/Y and PPKS/NT control lung tumors. (g) IB of MYC and β-actin in MYCi361-treated PPKS/M tumor-derived cells. (h) Kaplan-Meier survival analysis of PPKS/M, PPKS/Y, PPKY/LV and PPKS/NT lung tumor mice. Pairwise Mantel-Cox (log rank) test. (i) Representative tumor histology (H&E), ki67 and cleaved Caspase 3 (CC3) staining in PPKS/M, PPKS/Y, PPKY/LV and PPKS/NT lung tumors, scale bar 100 μm. (j) Relative tumor growth for each cohort. (k) Quantification of relative lung tumor area. (l) qIHC of ki67 in lung tumors. (m) qIHC of cleaved Caspase 3 (CC3) in lung tumors. (d), (e), (j) significance tested with one-way ANOVA with Tukey’s multiple comparison test. (k), (l), (m) significance tested with unpaired two-tailed Student’s t-test
Figure 5
Figure 5. Transcriptomic reprogramming in Myc-activated lung tumors from the CRISPRa/SAM model.
(a) Heatmap of differentially expressed (DE) MYC network members in PPKS/M relative to PPKS/NT tumors, Myc/Mycn/Mycl marked in red. (b) Heatmap of 107 DE MYC-signature genes in PPKS/M relative to PPKS/NT tumors. (c) Dot-plot of normalized enrichment score (NES) and false discovery rate (FDR) of MYC-associated gene sets in PPKS/M relative to PPKS/NT tumors. (d) GSEA categories enriched in PPKS/M relative to PPKS/NT tumors. (e) Dot-plot of immune response associated gene sets negatively enriched in PPKS/M relative to PPKS/NT tumors. (f) IHC analysis of CD45+ immune cells, F4/80+ macrophages, CD8+ T cells, CD4+ T cells and CD19+ B cells in PPKS/M and control (PPKY/LV and PPKS/NT) tumors, scale bar 100 μm. (g) qIHC of CD45+ immune cells. (h) qIHC of F4/80+ macrophages. (i) qIHC of CD8+ T cells. (j) qIHC analysis of CD4+ T. (k) qIHC of CD19+ B cells. (l) Heatmap and unsupervised hierarchical clustering of tumors. (m) CMScaller subtype by tumor cohort. (g), (h), (i), (j), (k) significance tested with two-tailed Student’s t-test.
Figure 6
Figure 6. Transcriptomic subtyping of lung adenocarcinoma tumors reveals enrichment of MYC signature in LuAd2 patient tumors.
(a) Heatmap of subtype-specific gene expression in TCGA-LUAD patient tumors by CMScaller subtype (LuAd1/LuAd2/LuAd3), and selected immune regulatory genes, MHC molecules, MYC signaling network members, maximum MYC/N/L, MYC signature, IR signature, and MYC, MYCN and MYCL copy number variation. (b) GSEA of MYC-associated gene sets in LuAd2 relative to all other TCGA-LUAD tumors. (c) Dot-plot showing NES and FDR of MYC-associated gene sets in LuAd2 tumors. (d) Normalized MYC expression in LuAd1, LuAd2 and LuAd3 tumors. (e) LUAD subtype distribution as function of MYC copy number status, chi-squared test. (f) Maximum normalized expression of MYC, MYCN or MYCL from each tumor by subtype. (g) Kaplan-Meier survival plot of the TCGA-LUAD data set by MYC-signature; LOW (<25 percentile, n=146), MED (25–75 percentile, n=292), HIGH (>75 percentile, n=147), pairwise Mantel-Cox (log rank) test. (h) MYC signature score by subtype. (d), (f), (h) significance tested using one-way ANOVA with Tukey’s multiple comparison test.
Figure 7
Figure 7. MYC signature and immune response.
(a) Normalized expression of immune regulatory factors by subtype in the TCGA-LUAD data set. (b) MHC factor expression by subtype. (c) IR-signature by subtype. (d) Kaplan-Meier survival plot of the TCGA-LUAD data set, by subtype. Pairwise Mantel-Cox (log rank) test. (e) Correlation plot of IR signature and MYC signature in the TCGA-LUAD data set, Pearson’s correlation coefficient r= −0.42, p<0.0001. (a), (b), (c) significance tested using one-way ANOVA with Tukey’s multiple comparison test.

References

    1. Jinek M, Chylinski K, Fonfara I, Hauer M, Doudna JA, Charpentier E. A programmable dual-RNA-guided DNA endonuclease in adaptive bacterial immunity. Science 2012;337:816–21 - PMC - PubMed
    1. Cong L, Ran FA, Cox D, Lin S, Barretto R, Habib N, et al. Multiplex genome engineering using CRISPR/Cas systems. Science 2013;339:819–23 - PMC - PubMed
    1. Mali P, Yang L, Esvelt KM, Aach J, Guell M, DiCarlo JE, et al. RNA-guided human genome engineering via Cas9. Science 2013;339:823–6 - PMC - PubMed
    1. Platt RJ, Chen S, Zhou Y, Yim MJ, Swiech L, Kempton HR, et al. CRISPR-Cas9 knockin mice for genome editing and cancer modeling. Cell 2014;159:440–55 - PMC - PubMed
    1. Chiou SH, Winters IP, Wang J, Naranjo S, Dudgeon C, Tamburini FB, et al. Pancreatic cancer modeling using retrograde viral vector delivery and in vivo CRISPR/Cas9-mediated somatic genome editing. Genes Dev 2015;29:1576–85 - PMC - PubMed

Publication types

Substances