. 2022 Sep 27;6(18):5379-5394.
doi: 10.1182/bloodadvances.2021006920.

Upregulated SPAG6 promotes acute myeloid leukemia progression through MYO1D that regulates the EGFR family expression

Affiliations

Upregulated SPAG6 promotes acute myeloid leukemia progression through MYO1D that regulates the EGFR family expression

Jiao Mu et al. Blood Adv. .

Abstract

Chromosomal aberrations and gene mutations have been considered to be the major reasons for high recurrence rates and poor survival among acute myeloid leukemia (AML) patients. However, the underlying molecular mechanism of AML gene mutation remains largely unclear. Here, we show that SPAG6 (sperm-associated antigen 6), one of the most markedly increased SPAG genes in AML, significantly contributed to the proliferation and migration of leukemic cells. SPAG6 was highly expressed in AML, and its upregulation was negatively correlated with the prognosis of the disease. In vitro, SPAG6 promoted the proliferation and migration of leukemia cells and promoted cell cycle progression from the G1 phase to the S phase. In vivo, low expression of SPAG6 reduced the proliferation and infiltration of leukemia cells and prolonged the survival of xenograft tumor mice. Furthermore, immunoprecipitation and mass spectrometry analysis showed that SPAG6 interacts with MYO1D (myosin 1D). Specifically, overexpression of SPAG6 promoted the translocation of MYO1D into the cell membrane, thus upgrading the expression level of the EGFR family and thereby promoting the progression of AML. Overall, our study found that SPAG6 combined with MYO1D and translocated MYO1D from the cytosol to the cytomembrane, which induced the PI3K (phosphoinositide 3-kinase)/AKT (protein kinase B) signaling and ERK (extracellular signal-regulated kinase) signaling pathway to regulate the growth and prognosis of AML. SPAG6 may become a new target gene for the treatment of AML.


Figures

None
Graphical abstract
Figure 1.
Figure 1.
Upregulation of SPAG6 is a frequent event in AML patients and indicates a poor prognosis in human AML. (A) The public data on AML were obtained from GEO (Gene Expression Omnibus) databases, and the mRNA expression levels of SPAG6 in AML and control samples were statistically analyzed. (B) The mRNA level of SPAG6 in 3 independent datasets GSE9476, GSE138702, and GSE13159. (C) SPAG6 expression in tumor and normal tissues was analyzed on the website https://www.oncomine.org/. (D) Real-time polymerase chain reaction analysis of SPAG6 mRNA expression in AML patients (n = 28) and control samples (n = 10). (E) SPAG6 expression in CD34+ leukemia stem cells from AML patients (n = 7) and control samples (n = 6). (F) Western blot analysis of SPAG6 protein expression in AML patients (n = 18) and control samples (n = 8). (G) The mRNA and protein level of SPAG6 in normal hematopoietic cells and K562, THP-1, HL-60, and HEL cells. (H) Overall survival analyses between patients with high or low SPAG6 expression in TCGA and GSE37642 dataset. (I) SPAG6 expression from AML patients (n = 35) with various cytogenetic aberrations. (J) The correlation between SPAG6 expression and AML CALGB cytogenetics risk category in TCGA database. (K) SPAG6 expression from AML patients with various cytogenetic aberrations (GSE13159). (L) SPAG6 expression from AML patients with different risk status in Vizome-ELN2017. *P < .05; **P < .01. LCSs, leukemia stem cells.
Figure 1.
Figure 1.
Upregulation of SPAG6 is a frequent event in AML patients and indicates a poor prognosis in human AML. (A) The public data on AML were obtained from GEO (Gene Expression Omnibus) databases, and the mRNA expression levels of SPAG6 in AML and control samples were statistically analyzed. (B) The mRNA level of SPAG6 in 3 independent datasets GSE9476, GSE138702, and GSE13159. (C) SPAG6 expression in tumor and normal tissues was analyzed on the website https://www.oncomine.org/. (D) Real-time polymerase chain reaction analysis of SPAG6 mRNA expression in AML patients (n = 28) and control samples (n = 10). (E) SPAG6 expression in CD34+ leukemia stem cells from AML patients (n = 7) and control samples (n = 6). (F) Western blot analysis of SPAG6 protein expression in AML patients (n = 18) and control samples (n = 8). (G) The mRNA and protein level of SPAG6 in normal hematopoietic cells and K562, THP-1, HL-60, and HEL cells. (H) Overall survival analyses between patients with high or low SPAG6 expression in TCGA and GSE37642 dataset. (I) SPAG6 expression from AML patients (n = 35) with various cytogenetic aberrations. (J) The correlation between SPAG6 expression and AML CALGB cytogenetics risk category in TCGA database. (K) SPAG6 expression from AML patients with various cytogenetic aberrations (GSE13159). (L) SPAG6 expression from AML patients with different risk status in Vizome-ELN2017. *P < .05; **P < .01. LCSs, leukemia stem cells.
Figure 2.
Figure 2.
SPAG6 promoted proliferation and G1 to S phase transition in leukemic cells. (A-B,E). K562 and HEL cells were transduced with lentiviral particles expressing different shRNA clones directed against SPAG6 (shSPAG6-1 and shSPAG6-2). The cell lines HL-60 and THP-1 were transduced with lentiviral particles expressing SPAG6 or EV. The cell proliferative capacities were detected by CCK-8, colony formation, and EdU assays in K562, HEL, HL-60, and THP-1 cells with treatment as indicated. (C-D) Proliferation and colony formation of CD34+ cells from a patient with favorable risk (Patient 1) and a patient with poor risk (Patient 2) when SPAG6 was knocked down. (F) Western blot detection for expression levels of Ki67 and PCNA. (G) AML cell migration was determined by Transwell assay. (H) Flow cytometry analysis showing cell cycle distribution in K562, HEL, THP-1, and HL-60 cells with treatment as indicated. (I) Western blot analysis showing the expression levels of cyclin D1, cyclin E1, CDK2, and CDK4 in AML cells with treatment as indicated. Scale bar, 50 μm. *P < .05; **P < .01. PCNA, proliferating cell nuclear antigen.
Figure 2.
Figure 2.
SPAG6 promoted proliferation and G1 to S phase transition in leukemic cells. (A-B,E). K562 and HEL cells were transduced with lentiviral particles expressing different shRNA clones directed against SPAG6 (shSPAG6-1 and shSPAG6-2). The cell lines HL-60 and THP-1 were transduced with lentiviral particles expressing SPAG6 or EV. The cell proliferative capacities were detected by CCK-8, colony formation, and EdU assays in K562, HEL, HL-60, and THP-1 cells with treatment as indicated. (C-D) Proliferation and colony formation of CD34+ cells from a patient with favorable risk (Patient 1) and a patient with poor risk (Patient 2) when SPAG6 was knocked down. (F) Western blot detection for expression levels of Ki67 and PCNA. (G) AML cell migration was determined by Transwell assay. (H) Flow cytometry analysis showing cell cycle distribution in K562, HEL, THP-1, and HL-60 cells with treatment as indicated. (I) Western blot analysis showing the expression levels of cyclin D1, cyclin E1, CDK2, and CDK4 in AML cells with treatment as indicated. Scale bar, 50 μm. *P < .05; **P < .01. PCNA, proliferating cell nuclear antigen.
Figure 3.
Figure 3.
Knockdown of SPAG6 inhibits the growth and dissemination of AML in vivo. (A) Kaplan-Meier curves showed the survival rate of mice injected with K562-shSPAG6 cells and HEL-shSPAG6 cells (n = 8 mice per group). (B-C) Representative examples of size and weight of spleens derived from leukemic mice with treatment as indicated. (D) White blood cell count in all the study groups. (E-F) Representative hematoxylin and eosin and immunohistochemical staining images of CD45 in BM, spleen, liver, and kidney, treated as indicated. Scale bar, 50 μm. **P < .01.
Figure 4.
Figure 4.
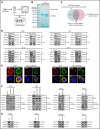
SPAG6 interacts with MYO1D and promotes the translocation of MYO1D to the plasma membrane. (A) A schematic representation of mass spectrometry detection. (B) Immunoprecipitation (IP) assay was carried out using SPAG6 antibody or IgG (negative control antibody). Samples were electrophoresed and Coomassie Brilliant Blue stained. Arrows indicate SPAG6 and the target bands. (C) Venn diagram of the protein strip and the protein lysate detected by LC-MS/MS analysis. (D) Interaction between SPAG6 and MYO1D was demonstrated via Co-IP in K562, HEL, HL-60, and THP-1 cells. (E) Representative images showing immunofluorescence staining of SPAG6 (red), MYO1D (green), and DAPI (blue) in K562 and HEL cells with treatment as indicated. Scale bar, 25 μm. (F) Western blot verified the different distribution of MYO1D in leukemia cells. (G) Western blot demonstrated SPAG6 expression with knockdown or overexpression of MYO1D in 4 AML cells. Co-IP, co-immunoprecipitation.
Figure 5.
Figure 5.
SPAG6 activates the PI3K/AKT and ERK signaling pathways in a MYO1D-dependent manner. (A) Western blot showing EGFR, ERBB2, ERBB3, and ERBB4 expression in K562 and HEL cells with MYO1D knockdown. (B-C) The proliferative capacities of K562 and HEL cells with MYO1D knockdown were detected by CCK-8 and EdU assays. (D) Migration of K562 and HEL cells when MYO1D was knocked down. (E-F) Western blot showing the concentrations of EGFR, ERBB2, ERBB3, ERBB4, AKT, p-AKT, ERK, and p-ERK in 4 AML cells treated as indicated. (G-H) Western blot showing the concentrations of AKT, p-AKT, ERK, and p-ERK in K562, HEL, HL-60, and THP-1 cells with treatment as indicated. *P < .05; **P < .01.
Figure 6.
Figure 6.
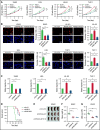
SPAG6, in association with MYO1D, promotes cell growth and migration of AML cells. (A-B) K562 and HEL cells with SPAG6 knockdown and HL-60 and THP-1 cells with SPAG6 overexpression were transfected with MYO1D forced expression vector or small interfering RNA as indicated. The cell proliferative capacities were detected by CCK-8 and EdU assays in K562, HEL, HL-60, and THP-1 cells with treatment as indicated. (C) Transwell assay in K562, HEL, HL-60, and THP-1 cells treated as indicated. (D) K562 cells with SPAG6 knockdown were transfected with MYO1D forced expression or control vector as indicated. Kaplan-Meier curves showed the survival of mice treated as indicated. (E-F) Size and weight of the spleen between different treatment groups. (G) White blood cells (WBCs) in mice were treated as indicated. *P < .05; **P < .01.

Similar articles

Cited by

References

    1. Tallman MS, Gilliland DG, Rowe JM. Drug therapy for acute myeloid leukemia. Blood. 2005;106(4):1154-1163. - PubMed
    1. Heuser M, Ofran Y, Boissel N, et al. ; ESMO Guidelines Committee. Electronic address: clinicalguidelines@esmo.org . Acute myeloid leukaemia in adult patients: ESMO Clinical Practice Guidelines for diagnosis, treatment and follow-up [published correction appears in Ann Oncol 2021;32(6):821]. Ann Oncol. 2020;31(6):697-712. - PubMed
    1. Döhner H, Weisdorf DJ, Bloomfield CD. Acute myeloid leukemia. N Engl J Med. 2015;373(12):1136-1152. - PubMed
    1. Liersch R, Müller-Tidow C, Berdel WE, Krug U. Prognostic factors for acute myeloid leukaemia in adults – biological significance and clinical use. Br J Haematol. 2014;165(1):17-38. - PubMed
    1. Papaemmanuil E, Gerstung M, Bullinger L, et al. . Genomic classification and prognosis in acute myeloid leukemia. N Engl J Med. 2016;374(23):2209-2221. - PMC - PubMed

Publication types

MeSH terms