. 2022 Aug:54:102358.
doi: 10.1016/j.redox.2022.102358. Epub 2022 Jun 2.

A CRISPR screen identifies redox vulnerabilities for KEAP1/NRF2 mutant non-small cell lung cancer

Affiliations

A CRISPR screen identifies redox vulnerabilities for KEAP1/NRF2 mutant non-small cell lung cancer

Chang Jiang et al. Redox Biol. 2022 Aug.

Erratum in

Abstract

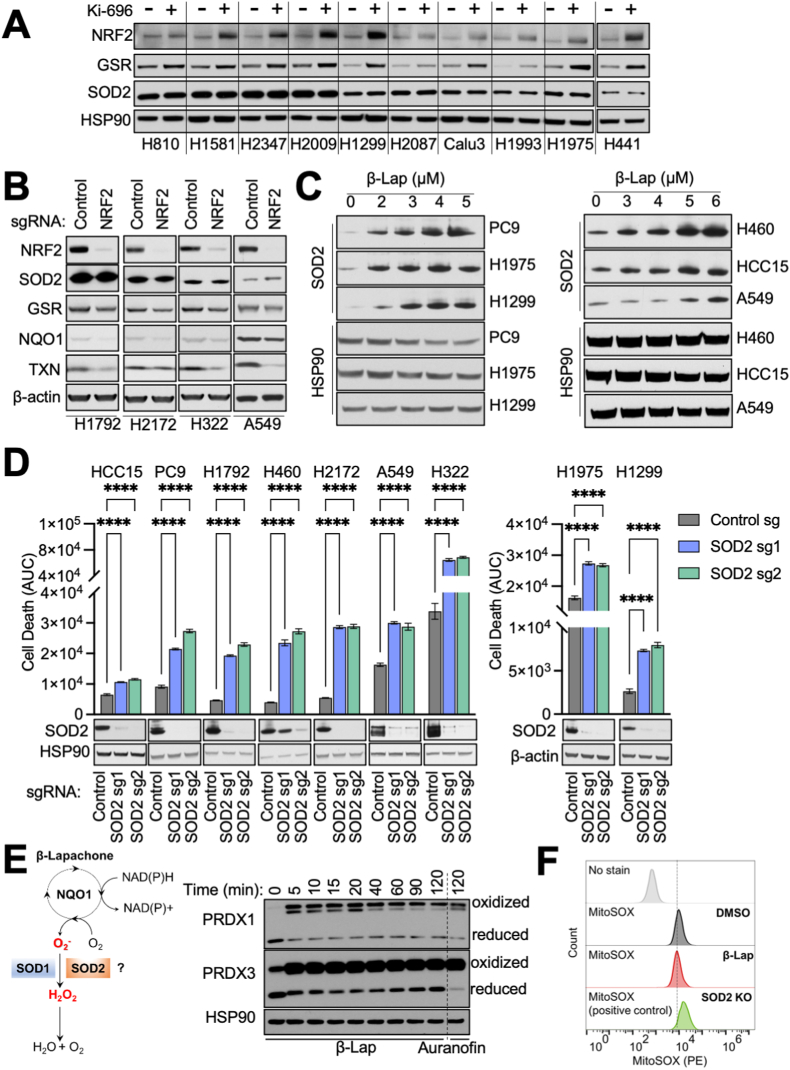
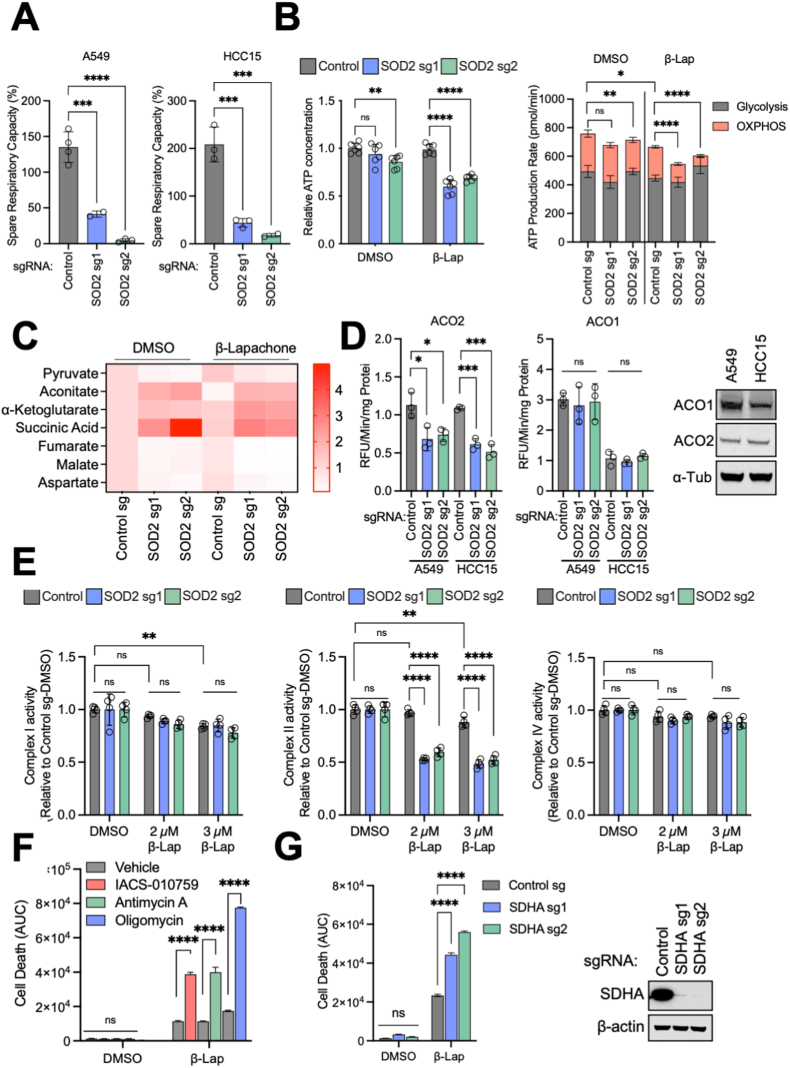
The redox regulator NRF2 is hyperactivated in a large percentage of non-small cell lung cancer (NSCLC) cases, which is associated with chemotherapy and radiation resistance. To identify redox vulnerabilities for KEAP1/NRF2 mutant NSCLC, we conducted a CRISPR-Cas9-based negative selection screen for antioxidant enzyme genes whose loss sensitized cells to sub-lethal concentrations of the superoxide (O2-) -generating drug β-Lapachone. While our screen identified expected hits in the pentose phosphate pathway, the thioredoxin-dependent antioxidant system, and glutathione reductase, we also identified the mitochondrial superoxide dismutase 2 (SOD2) as one of the top hits. Surprisingly, β-Lapachone did not generate mitochondrial O2- but rather SOD2 loss enhanced the efficacy of β-Lapachone due to loss of iron-sulfur protein function, loss of mitochondrial ATP maintenance and deficient NADPH production. Importantly, inhibition of mitochondrial electron transport activity sensitized cells to β-Lapachone, demonstrating that these effects may be translated to increase ROS sensitivity therapeutically.

Keywords: KEAP1; NADPH; NFE2L2; NSCLC; ROS; SOD2; β-Lapachone.


Conflict of interest statement

The authors declare that they have no known competing financial interests or personal relationships that could have appeared to influence the work reported in this paper.

Figures

Fig. 1
Fig. 1
CRISPR/Cas9 screens identify redox vulnerabilities of KEAP1 mutant NSCLC cells. (A) Schematic of the antioxidant enzyme gene focused pooled sgRNA library screen. KEAP1MUT A549 and HCC15 cells were infected with sgRNA library lentivirus at a MOI of ∼0.3. After selection with puromycin, cells were treated with either vehicle control (DMSO) or β-Lapachone for 2 h every other day for 3 sequential treatments, followed by collection for genomic DNA extraction. (B)–(C) Analysis and categorization of hits from the sensitization screen. (B) Volcano plots summarizing gene significances based on sgRNA abundance changes between β-Lapachone treatment versus DMSO treatment. Left, A549 cells were treated with either DMSO or 2.0 μM β-Lapachone. Right, HCC15 cells were treated with either DMSO or 4.0 μM β-Lapachone. Treatment strategy was as described in (A). p-values were calculated by MAGeCK. Selected screen hits are highlighted and categorized by color. (C) Selected screen hits organized by category and color coded to correspond to (B). (D) Validation of SOD2. A549 cells and HCC15 cells were infected with virus encoding for either a non-targeting control sgRNA or sgRNAs against SOD2. Left, cells were exposed to either DMSO or escalating concentrations of β-Lapachone for 2 h, after which medium was replaced and remaining cell quantity was assessed 48 h after treatment using crystal violet staining. Right, Western blot analyses of SOD2 and HSP90 (loading control). (For interpretation of the references to color in this figure legend, the reader is referred to the Web version of this article.)
Fig. 2
Fig. 2
β-Lapachone increases SOD2 expression and dependence in NSCLC cells. (A–B) NRF2 does not regulate SOD2 expression. (A) Immunoblot of NRF2, GSR, and SOD2 expression in a panel of KEAP1/NRF2WT cells pre-treated with 100 nM KI-696 or vehicle (DMSO) for 48 h. HSP90 was the loading control. (B) Immunoblot of NRF2, GSR, SOD2, NQO1 and TXN expression in a panel of KEAP1MUT cells with Cas9 expression infected with lentivirus encoding for either a non-targeting control sgRNA or sgRNA against NRF2. β-actin is used as the loading control. (C) β-Lapachone induces SOD2 expression. Immunoblot of SOD2 in a panel of KEAP1WT cells (Left) and a panel of KEAP1MUT cells (Right). Cells were treated with either DMSO or escalating concentrations of β-Lapachone for 2 h, after which medium was replaced and protein was extracted 24 h after treatment. HSP90 was used as the loading control. (D) SOD2 deletion increases β-Lapachone cytotoxicity. Top, control sgRNA or SOD2 sgRNA expressing cells were treated with DMSO or β-Lapachone for 2 h, after which the medium was replaced. Left, NRF2 hyperactive NSCLC cells (β-Lapachone = 4 μM). NRF2 amplified: PC9; KEAP1 mutant: HCC15, H1792, H460, H2172, A549, H322. Right, KEAP1/NRF2WT NSCLC cells: H1975, H1299 (β-Lapachone = 3 μM). Cell death was determined by Incucyte analysis of Sytox Green staining over 72 h, followed by normalization to cell density. Area under the curve (AUC) calculations are presented. Bottom, immunoblot analyses of SOD2 and HSP90 (loading control). Data are shown as mean ± SD. ****p < 0.0001. Two-way ANOVA with Dunnett's multiple comparison test was used for statistical analyses. (E) Left, schematic representation of the potential role of SOD1 and SOD2 in the detoxification of β-Lapachone-induced ROS. Right, redox immunoblot analysis of the oxidation state of PRDX1 and PRDX3 in A549 cells following treatment with DMSO or 2 μM β-Lapachone for the indicated time, or 6 μM Auranofin for 120 min. HSP90 was the loading control. Of note, the lower band corresponds to the monomeric form of peroxiredoxins (reduced state) and the upper band results from the dimerization of peroxiredoxins (oxidized). (F) β-Lapachone does not generate mitochondrial superoxide. A549 cells were treated with DMSO or 3 μM β-Lapachone for 10 min and mitochondrial superoxide assayed with MitoSOX Red. SOD2 KO A549 cells were used as a positive control. (For interpretation of the references to color in this figure legend, the reader is referred to the Web version of this article.)
Fig. 3
Fig. 3
SOD2 loss leads to a defect in mitochondrial ATP generation upon β-Lapachone treatment. (A) Average spare respiratory capacity of A549 and HCC15 cells. Cells were previously infected with lentivirus encoding either control sgRNA or sgRNAs against SOD2. Student's t-test was used for statistical analyses. (B) Left, effect of SOD2 deletion on total cellular ATP levels. A549 control sgRNA and SOD2 sgRNA expressing cells were subjected to either DMSO or 2 μM β-Lapachone for 2 h. ATP levels were then measured using CellTiter-Glo assay and normalized to that of control cells treated with DMSO. Right, determination of the ATP production rate. Control and SOD2 sgRNA expressing cells were treated with DMSO or 2 μM β-Lapachone for 2 h, and the ATP production rate was measured using Agilent Seahorse XF Real Time ATP rate assay. Two-way ANOVA with Dunnett's multiple comparison test was used for statistical analyses. *p < 0.05; **p < 0.01; ****p < 0.0001; ns, not significant. (C) Heatmap of relative abundances of TCA cycle metabolites in control and SOD2 sgRNA expressing A549 cells treated with DMSO or 2 μM β-Lapachone for 1.5 h. Data were normalized to the A549 control sgRNA DMSO group (n = 3). (D) Left, mitochondrial (ACO2, Left) and cytosolic (ACO1, Right) aconitase activity of A549 and HCC15 cells following SOD2 deletion. One-way ANOVA with Dunnett's multiple comparison test was used for statistical analyses. *p < 0.05; ***p < 0.01; ns, not significant. Right, representative Western blot analysis of ACO1, ACO2 and α-Tubulin (loading control) expression in HCC15 and A549 cells. (E) Analysis of ETC complex I, II and IV activity following β-Lapachone treatment using Seahorse analysis with permeabilization. A549 cells subject to SOD2 deletion were treated with DMSO or the indicated concentrations of β-Lapachone for 2 h. (F) Mitochondrial ETC inhibition enhances β-Lapachone-induced cell death. A549 cells were treated with DMSO or 4 μM β-Lapachone for 2 h in combination with vehicle (DMSO) or the indicated mitochondrial ETC inhibitors, after which time the medium was replaced. Cell death was determined by Incucyte analysis of Sytox Green staining over 72 h, followed by normalization to cell density. Area under the curve (AUC) calculations are presented. Two-way ANOVA with Dunnett's multiple comparison test was used for statistical analyses. Data are shown as mean ± SD. ****p < 0.0001. ns, not significant. (G) Left, control or SDHA sgRNA expressing A549 cells were treated with DMSO or 4 μM β-Lapachone for 2 h, after which the medium was replaced. Cell death was determined by Incucyte analysis of Sytox Green staining over 72 h, followed by normalization to cell density. Area under the curve (AUC) calculations are presented. Right, Western blot analyses of SDHA and HSP90 (loading control). Data are shown as mean ± SD. Two-way ANOVA with Dunnett's multiple comparison test was used for statistical analyses. ****p < 0.0001; ns, not significant. (For interpretation of the references to color in this figure legend, the reader is referred to the Web version of this article.)
Fig. 4
Fig. 4
SOD2 loss lowers the NADPH/NADP+ ratio following β-Lapachone treatment. (A) NADPH:NADP+ ratio measurement. A549 cells expressing control or SOD2 sgRNAs were treated with DMSO or the indicated concentration of β-Lapachone for 2 h prior to collection. The NADPH:NADP+ ratios were normalized to control DMSO treated cells. (B) Left, tracer strategy for the analysis of pentose phosphate pathway flux using [1,2–13C] glucose. Dark blue circles depict glycolytic metabolites produced exclusively by glycolysis (M+2 labeling); orange circles depict glycolytic intermediates arising from glucose that first passed through the oxPPP (M+1) (adapted from Ref. [65]). Right, M+0 (unlabeled), M+1 (PPP-derived) and M+2 (glycolysis derived) labeling of lactate from [1,2–13C] glucose (mean + SD; n = 3). A549 cells expressing either control or SOD2 sgRNAs were treated with DMSO or 2 μM β-Lapachone for 1.5 h before metabolite extraction. See also Fig. S4 (A–B). (C) Representative redox immunoblot analysis of the oxidation state of PRDX1 in A549 cells expressing either control sgRNA or sgRNAs targeting SOD2. Cells were treated with DMSO, 2 μM β-Lapachone or 6 μM Auranofin for 2 h. HSP90 was the loading control. (D) DNA damage assessment of A549 cells expressing either control sgRNA or sgRNAs targeting SOD2. Cells were exposed to escalating concentrations of β-Lapachone for 2 h. Protein levels of SOD2, HSP90 (loading control), total H2AX (loading control) and the DNA damage marker γ-H2AX (pS139) were assessed by Western blotting. (E) Model: SOD2 deficient cells have impaired mitochondrial function following β-Lapachone treatment, resulting in both depletion of NADPH and failure to maintain ATP levels. NADPH depletion impairs β-Lapachone-induced ROS detoxification, leading to more DNA damage and enhanced cytotoxicity. (For interpretation of the references to color in this figure legend, the reader is referred to the Web version of this article.)

Similar articles

Cited by

References

    1. Herbst R.S., Morgensztern D., Boshoff C. The biology and management of non-small cell lung cancer. Nature. 2018;553(7689):446–454. - PubMed
    1. Campbell J.D., et al. Distinct patterns of somatic genome alterations in lung adenocarcinomas and squamous cell carcinomas. Nat. Genet. 2016;48(6):607–616. - PMC - PubMed
    1. DeNicola G.M., et al. NRF2 regulates serine biosynthesis in non-small cell lung cancer. Nat. Genet. 2015;47(12):1475–1481. - PMC - PubMed
    1. DeNicola G.M., et al. Oncogene-induced Nrf2 transcription promotes ROS detoxification and tumorigenesis. Nature. 2011;475(7354):106–109. - PMC - PubMed
    1. Kankia I.H., et al. Oxid Med Cell Longev; 2017. (NRF2 Regulates HER1 Signaling Pathway to Modulate the Sensitivity of Ovarian Cancer Cells to Lapatinib and Erlotinib). 2017. - PMC - PubMed

Publication types

MeSH terms