Meta-Analysis
. 2022 Jun 6;13(1):3124.
doi: 10.1038/s41467-022-30875-7.

Comprehensive genetic analysis of the human lipidome identifies loci associated with lipid homeostasis with links to coronary artery disease

Affiliations
Meta-Analysis

Comprehensive genetic analysis of the human lipidome identifies loci associated with lipid homeostasis with links to coronary artery disease

Gemma Cadby et al. Nat Commun. .

Abstract

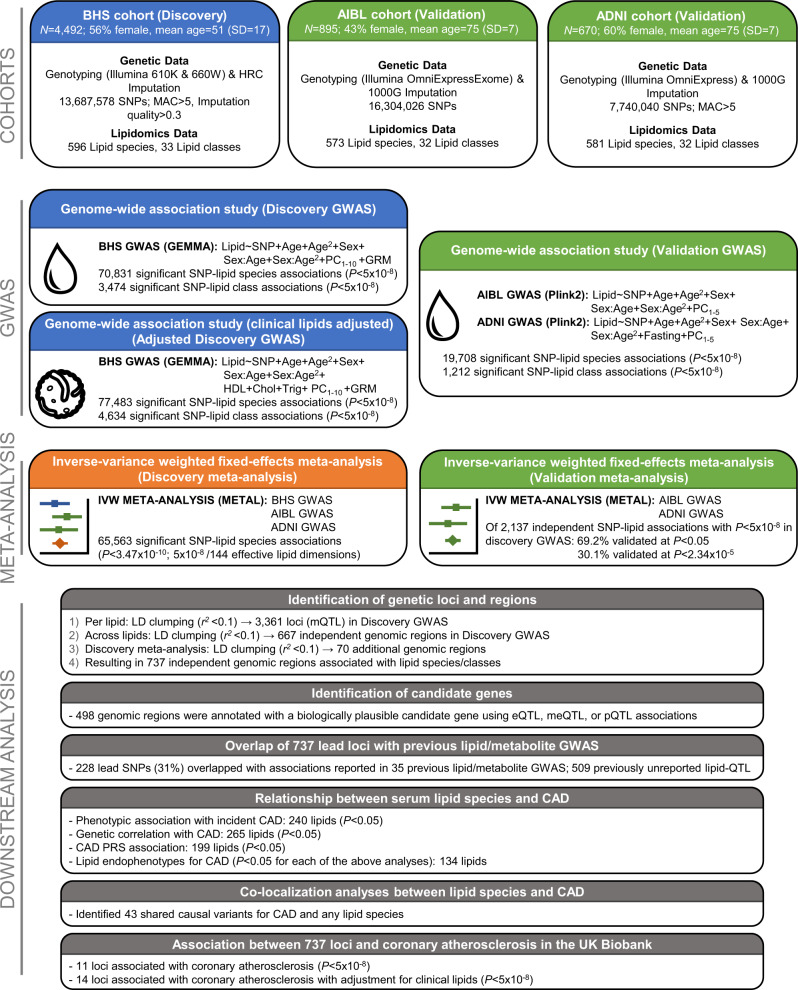
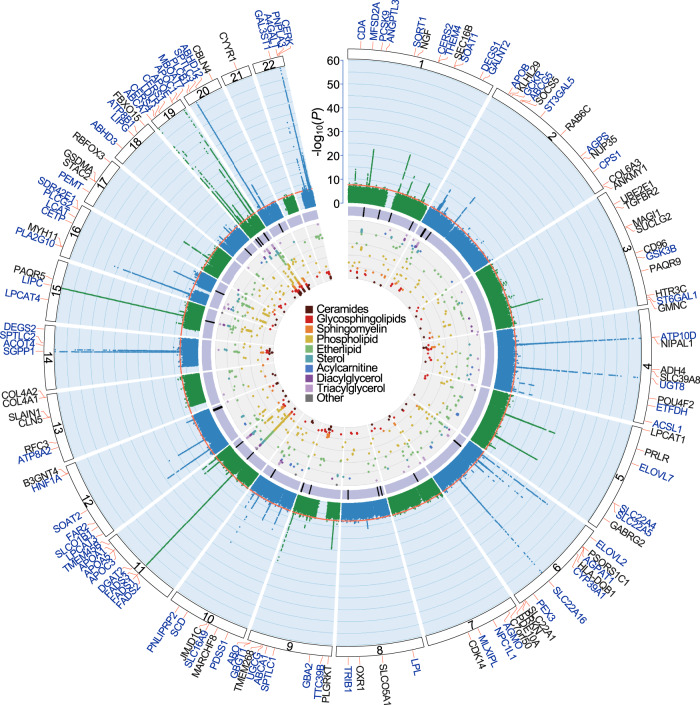
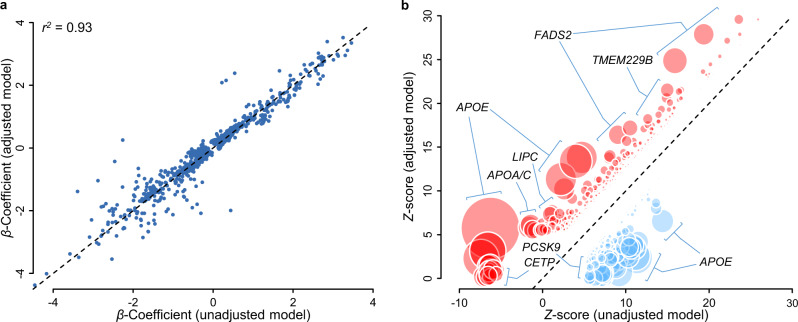
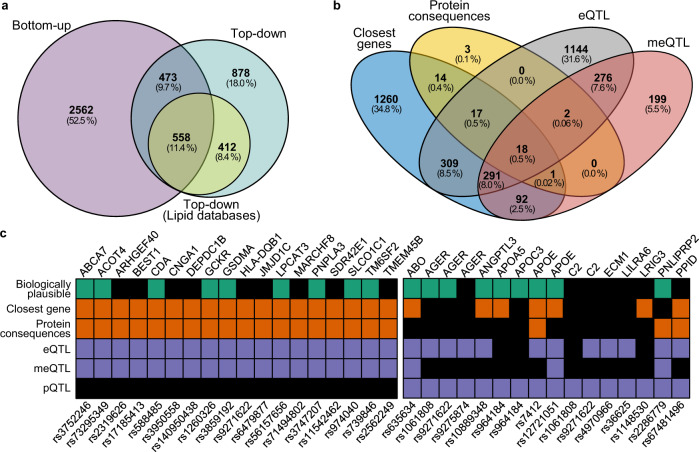
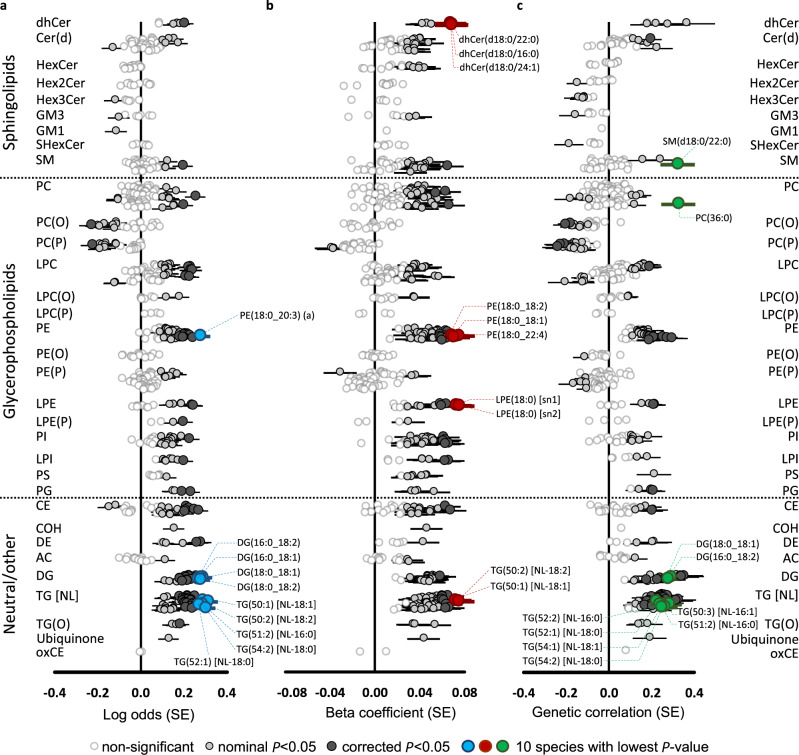
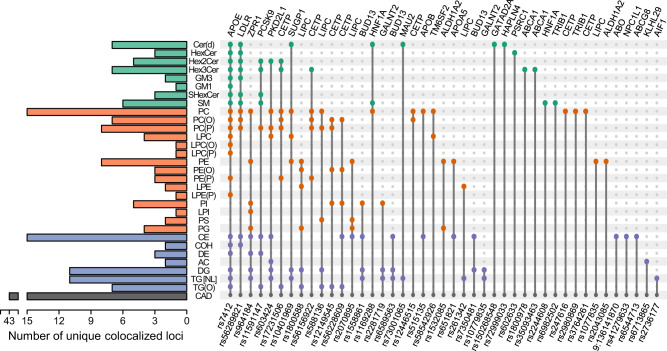
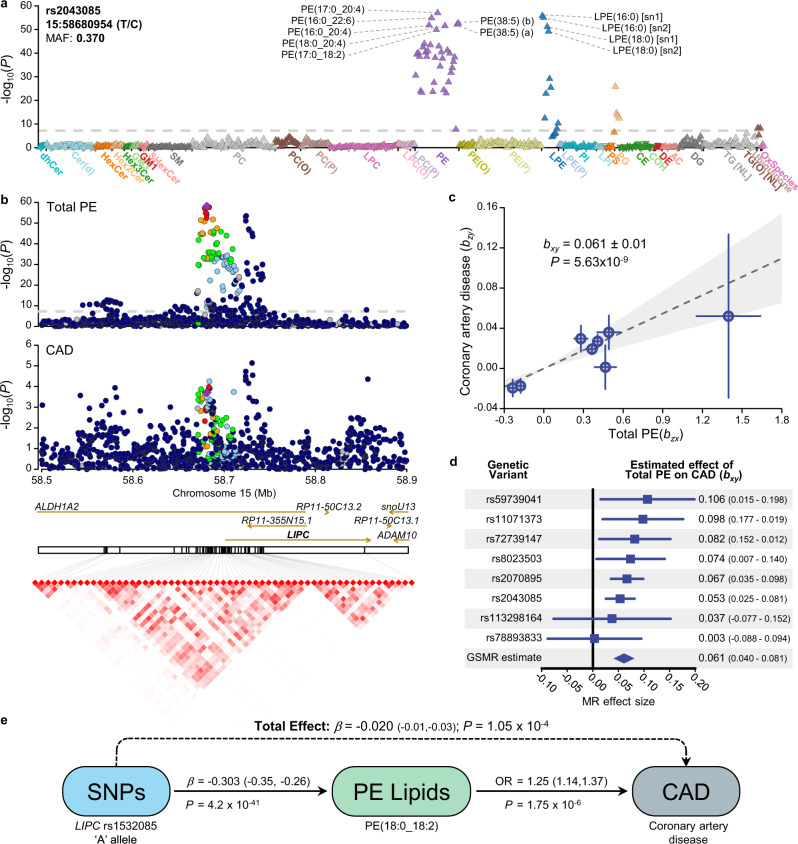
We integrated lipidomics and genomics to unravel the genetic architecture of lipid metabolism and identify genetic variants associated with lipid species putatively in the mechanistic pathway for coronary artery disease (CAD). We quantified 596 lipid species in serum from 4,492 individuals from the Busselton Health Study. The discovery GWAS identified 3,361 independent lipid-loci associations, involving 667 genomic regions (479 previously unreported), with validation in two independent cohorts. A meta-analysis revealed an additional 70 independent genomic regions associated with lipid species. We identified 134 lipid endophenotypes for CAD associated with 186 genomic loci. Associations between independent lipid-loci with coronary atherosclerosis were assessed in ∼456,000 individuals from the UK Biobank. Of the 53 lipid-loci that showed evidence of association (P < 1 × 10⁻³), 43 loci were associated with at least one lipid endophenotype. These findings illustrate the value of integrative biology to investigate the aetiology of atherosclerosis and CAD, with implications for other complex diseases.


Conflict of interest statement

The authors declare no competing interests.

Figures

Fig. 1
Fig. 1. Study design for the genetic analysis of the human lipidome.
Representation of genome-wide association studies (GWAS) of the lipidome in the BHS discovery cohort (blue boxes), ADNI and AIBL validation cohorts (green boxes), discovery meta-analysis (orange box), and downstream analyses (grey boxes). ADNI Alzheimer’s Disease Neuroimaging Initiative, AIBL Australian Imaging, Biomarker & Lifestyle Flagship Study of Ageing, BHS Busselton Health Study, CAD coronary artery disease, Chol cholesterol, eQTL expression quantitative trait loci, GRM genetic relatedness matrix, GWAS genome-wide association study, IVW inverse-variance weighted, LD linkage disequilibrium, MAC minor allele count, meQTL methylation quantitative trait loci, mQTL metabolite quantitative trait loci, PC principal component, PRS polygenic risk score, pQTL protein quantitative trait loci, SD standard deviation, SNP single nucleotide polymorphism, Trig triglycerides.
Fig. 2
Fig. 2. Circular presentation of loci associated with circulating lipid species identified in our Discovery GWAS.
The −log10(P) for genetic association with lipid species are arranged by chromosomal position, indicated by alternating blue and green points. Association P-values are truncated at P < 1 × 10−60. Genome-wide significance (P < 5 × 10−8) is indicated by the red line. For details about significant associations, see Supplementary Data 2, 3. Genes identified in our candidate gene analysis are highlighted in blue, otherwise the closest gene is indicated in black. The purple band indicates lipid-loci that co-localise with coronary artery disease (CAD) or show association with CAD after adjusting for clinical lipids. The inner circle shows a Fuji plot of SNP-lipid associations, coloured by broad lipid category. Colour keys representing broad lipid categories are indicated in the plot centre. Chromosomes are indicated by numbered panels 1–22.
Fig. 3
Fig. 3. Comparison of estimated lipidomic effect sizes between clinical lipid adjusted and unadjusted models.
a Beta coefficients for independent unadjusted SNP-lipid associations (x-axis) are plotted against clinical lipid-adjusted SNP-lipid associations (y-axis). b Z-scores for unadjusted SNP-lipid associations (x-axis) are plotted against clinical lipid-adjusted SNP-lipid associations (y-axis). Z-scores for SNP associations reaching genome-wide significance (P < 5 × 10−8) in either the clinical lipid adjusted or unadjusted models. Variant effect signs are fixed so adjusted associations are positive. Variants showing greater (positive) associations in clinical lipid-adjusted analysis are shown in red, and variants showing reduced associations are shown in blue. Circle diameter is proportional of −log10(P) t-test of effect differences.
Fig. 4
Fig. 4. Identification of putative causal genes using genetic prioritisation and knowledge-based approaches.
Assignment of putative causal genes was performed using the ProGeM framework, incorporating genetic-based prioritisation (bottom-up), and biological knowledge-based approaches (top-down). a Venn diagram showing the number of loci with annotations for candidate genes using the distinct approaches and the overlap. Top-down annotations were divided into lipid-specific databases and generic databases. b Venn diagram of distinct genes identified in genetic-based prioritisation analysis. c Summary of putative causal genes with overlapping annotations for closest gene, protein consequences, eQTL and meQTL (left). Summary of putative causal SNP-gene pairs for which pQTL evidence was identified (right). eQTL expression quantitative trait loci, meQTL methylation quantitative trait loci, pQTL protein quantitative trait loci.
Fig. 5
Fig. 5. Genetic and phenotypic associations of the lipidome with coronary artery disease.
Forest plots of lipid-coronary artery disease; circles represent effect sizes and horizontal bars represent ±standard errors. a Phenotypic associations (logistic regression; two-sided) between lipid species and incident coronary artery disease in the BHS cohort (551 cases and 3703 controls), adjusted for age, sex, and the first 10 genomic principal components. b Association of lipid species with polygenic risk for coronary artery disease. Individuals in the discovery cohort (n = 4492) were assessed for risk using the metaGRS polygenic score, consisting of ∼1.7 million genetic variants. Linear regressions (two-sided) were performed to test the association between an individual’s polygenic score and lipid species concentrations, adjusting for age, sex, and the 10 first principal components. c Genetic correlations of lipid species (n = 4492) against coronary artery disease (meta-analysis of CARDIoGRAMplusC4D and UK Biobank; 122,733 cases and 424,528 controls), performed with Linkage Disequilibrium Score Regression (LDSC; v1.0.1). Nominally significant and Benjamini–Hochberg corrected significance is indicated by light- and dark-grey circles, respectively. The 10 most significant lipid species are highlighted in blue, red, or green.
Fig. 6
Fig. 6. Co-localisation of lipid-loci with coronary artery disease.
Summary of lipid classes which contain at least one lipid specie that co-localises with coronary artery disease. Colours indicate broad lipid categories—green, sphingolipids; orange, phospholipids; blue, neutral lipids/others. Indicated variants were identified as the most likely causal variant for each of the identified co-localisation analysis. Genetic variants are ordered according to the number of co-localisations across lipid classes. Evidence of co-localisation included H3 + H4 > 0.8 and H4/H3 > 10.
Fig. 7
Fig. 7. Genetic analysis of the LIPC gene region and circulating levels of phosphatidylethanolamine.
a Lipid-wide association with the genetic variant, rs2043085, in the BHS cohort (n = 4492). Symbol colour is used to distinguish lipid classes. The symbol orientation indicates the effect sign, inverted triangles indicate negative associations, while regular triangles indicate positive associations. The dashed line indicates genome-wide significance (P < 5 × 10−8). b Regional association plots for Total PE and coronary artery disease (van der Harst & Verweij 2018), focusing on the LIPC region. Variants are coloured based on LD with the lead variant, rs2043085. Linkage disequilibrium plot showing correlation between variants following clumping (r2 > 0.8; P < 5 × 10−8). Variant correlations were obtained from 10,000 unrelated individuals from the UK Biobank. c Plot of genetic instrument effect sizes against Total PE (n = 4492) and coronary artery disease (n = 547,261). Variants were selected based on association with Total PE from within the LIPC region. Eight approximately independent variants were left following clumping (r2 > 0.05; P < 5 × 10−8). Generalised Summary-data based Mendelian Randomisation (GSMR) was used to estimate effect of Total PE on coronary artery disease, accounting for the variant correlations and uncertainty in both bzx and bzy. Data are presented as mean ± SE. d Forest plot of single variant tests and GSMR estimates from panel c. Data presented as mean ± 95% confidence interval. e Diagram of mediated pleiotropy, showing effect sizes estimated across multiple datasets. Exposure modifying variant effect sizes were estimated in the BHS cohort, as well as odds ratio of phosphatidylethanolamine lipid species against incident cardiovascular disease. Total effect represents the sum of genetics effects on coronary artery disease, whether mediated through phosphatidylethanolamine or not. Coronary artery disease effect size was obtained from van der Harst & Verweij 2018. Source data are provided as a Source Data file. MAF minor allele frequency, MR Mendelian randomisation, OR odds ratio, PE phosphatidylethanolamine, SNP single nucleotide polymorphism.

References

    1. Mach F, et al. Adverse effects of statin therapy: perception vs. the evidence—focus on glucose homeostasis, cognitive, renal and hepatic function, haemorrhagic stroke and cataract. Eur. Heart J. 2018;39:2526–2539. doi: 10.1093/eurheartj/ehy182. - DOI - PMC - PubMed
    1. Grundy Scott M, et al. 2018 AHA/ACC/AACVPR/AAPA/ABC/ACPM/ADA/AGS/APhA/ASPC/NLA/PCNA Guideline on the Management of Blood Cholesterol. J. Am. Coll. Cardiol. 2019;73:e285–e350. doi: 10.1016/j.jacc.2018.11.003. - DOI - PubMed
    1. Willer CJ, et al. Discovery and refinement of loci associated with lipid levels. Nat. Genet. 2013;45:1274–1283. doi: 10.1038/ng.2797. - DOI - PMC - PubMed
    1. Sinnott-Armstrong N, et al. Genetics of 35 blood and urine biomarkers in the UK Biobank. Nat. Genet. 2021;53:185–194. doi: 10.1038/s41588-020-00757-z. - DOI - PMC - PubMed
    1. Ference BA, et al. Effect of long-term exposure to lower low-density lipoprotein cholesterol beginning early in life on the risk of coronary heart disease: a Mendelian randomization analysis. J. Am. Coll. Cardiol. 2012;60:2631–2639. doi: 10.1016/j.jacc.2012.09.017. - DOI - PubMed

Publication types