. 2022 Jun;24(6):872-884.
doi: 10.1038/s41556-022-00925-9. Epub 2022 Jun 6.

The metabolic enzyme hexokinase 2 localizes to the nucleus in AML and normal haematopoietic stem and progenitor cells to maintain stemness

Affiliations

The metabolic enzyme hexokinase 2 localizes to the nucleus in AML and normal haematopoietic stem and progenitor cells to maintain stemness

Geethu Emily Thomas et al. Nat Cell Biol. 2022 Jun.

Abstract

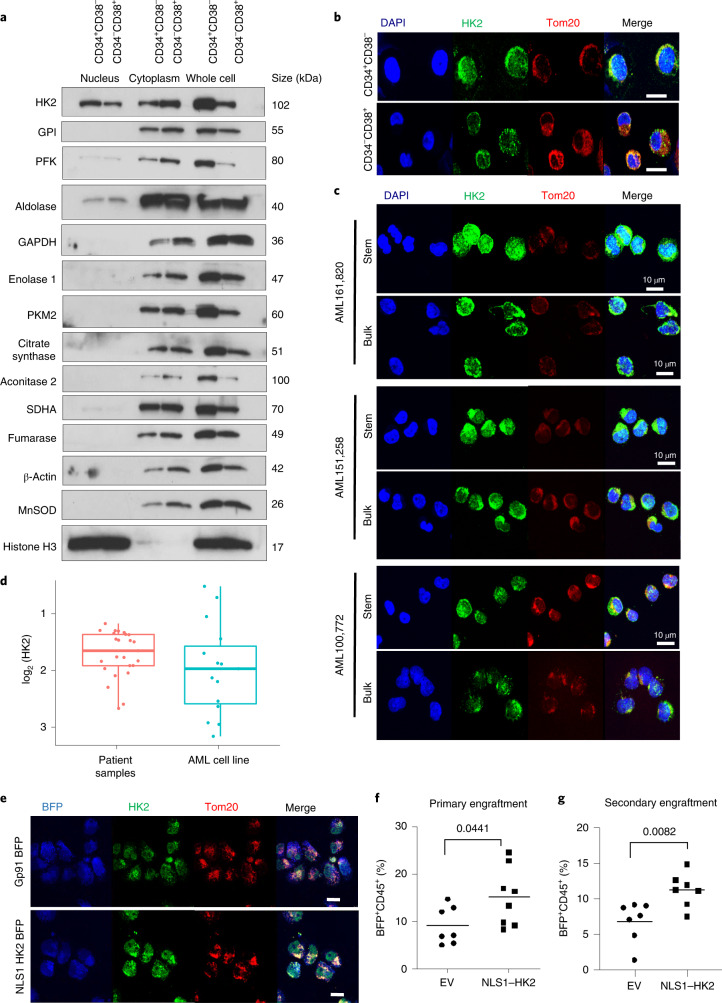
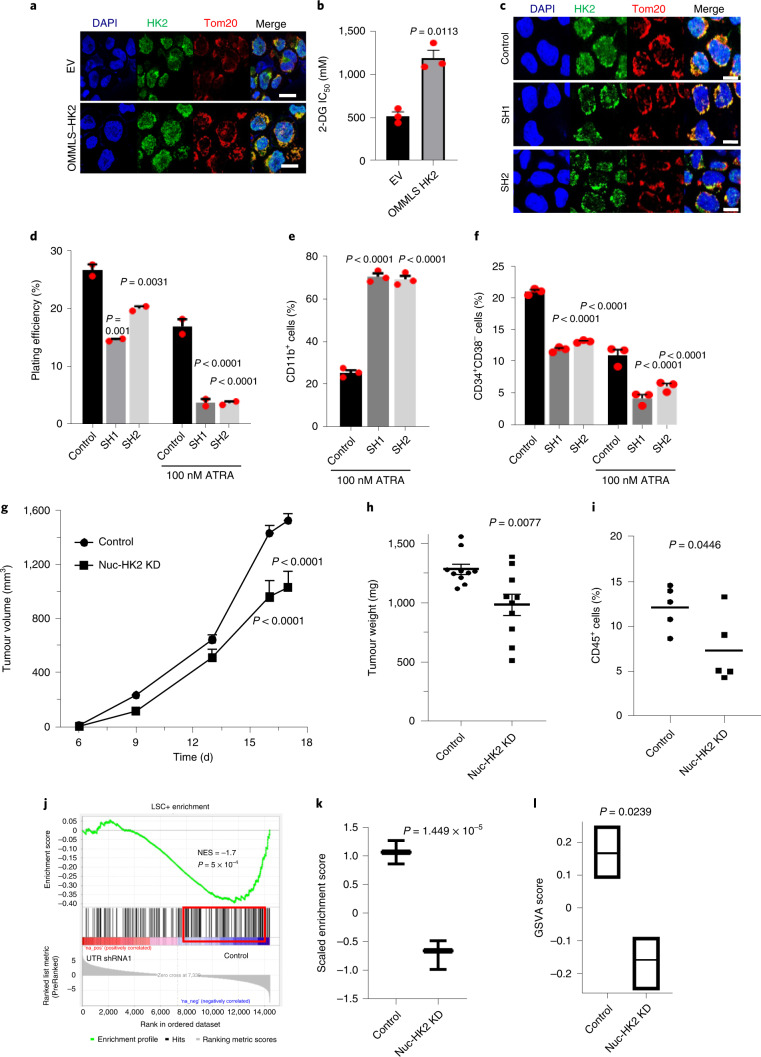
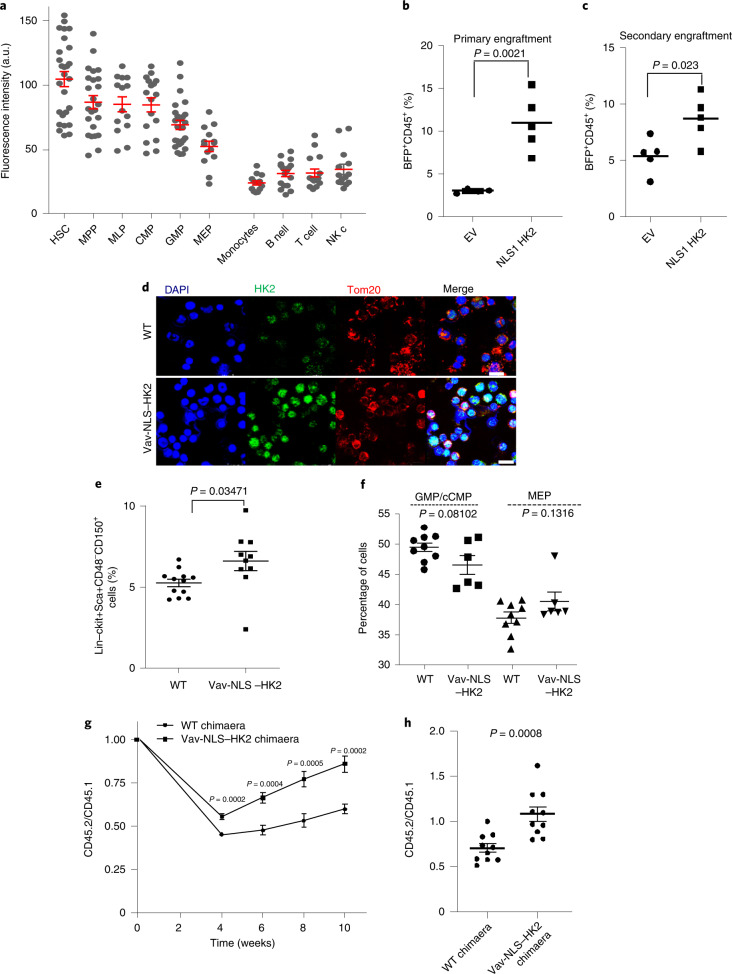
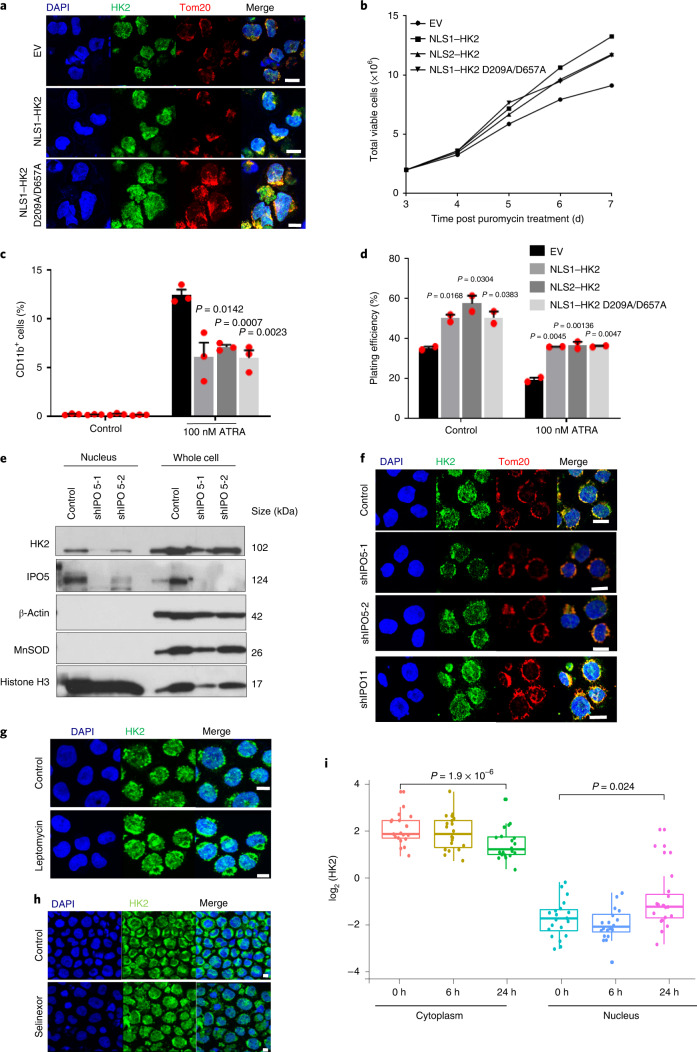
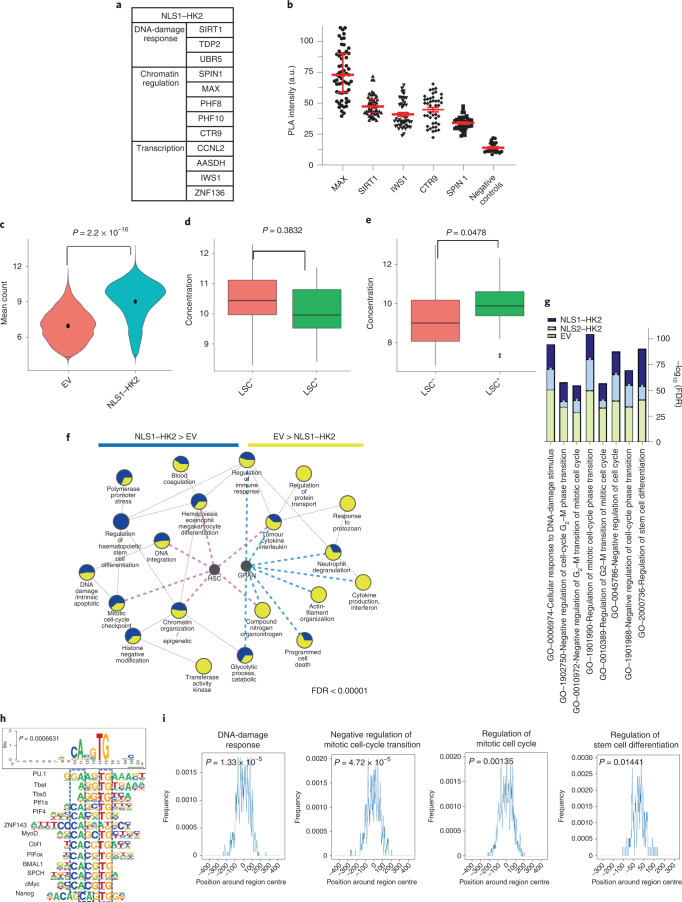
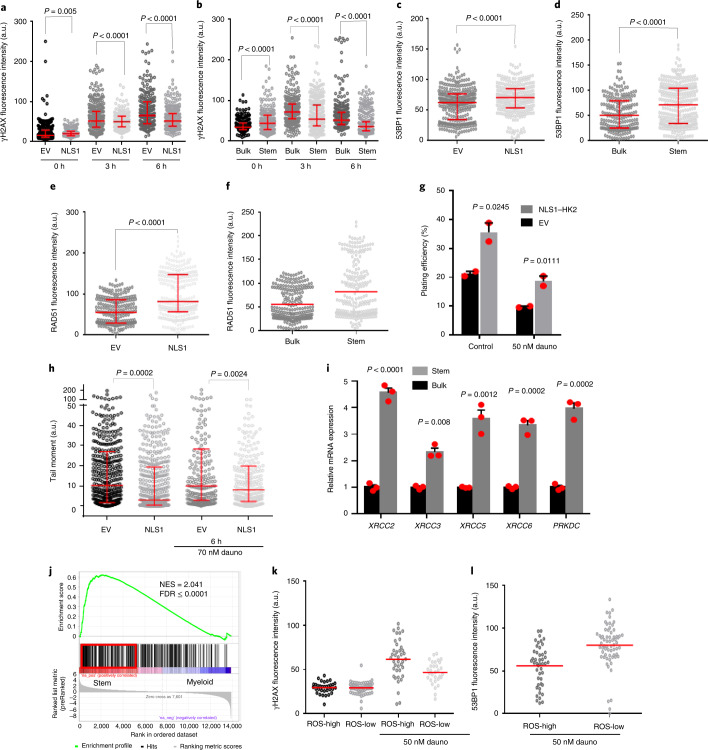
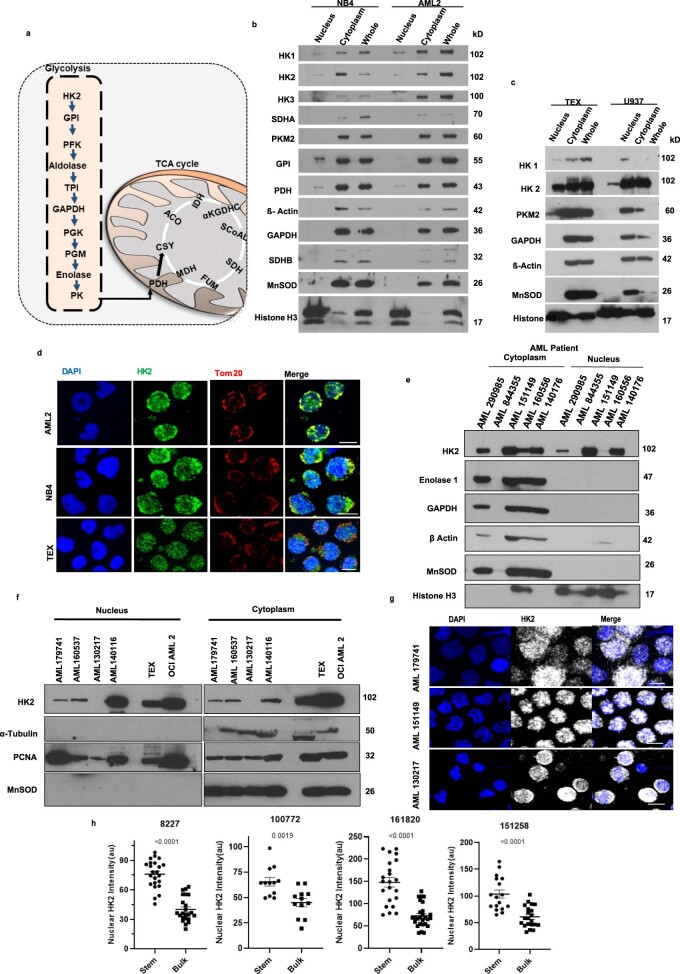
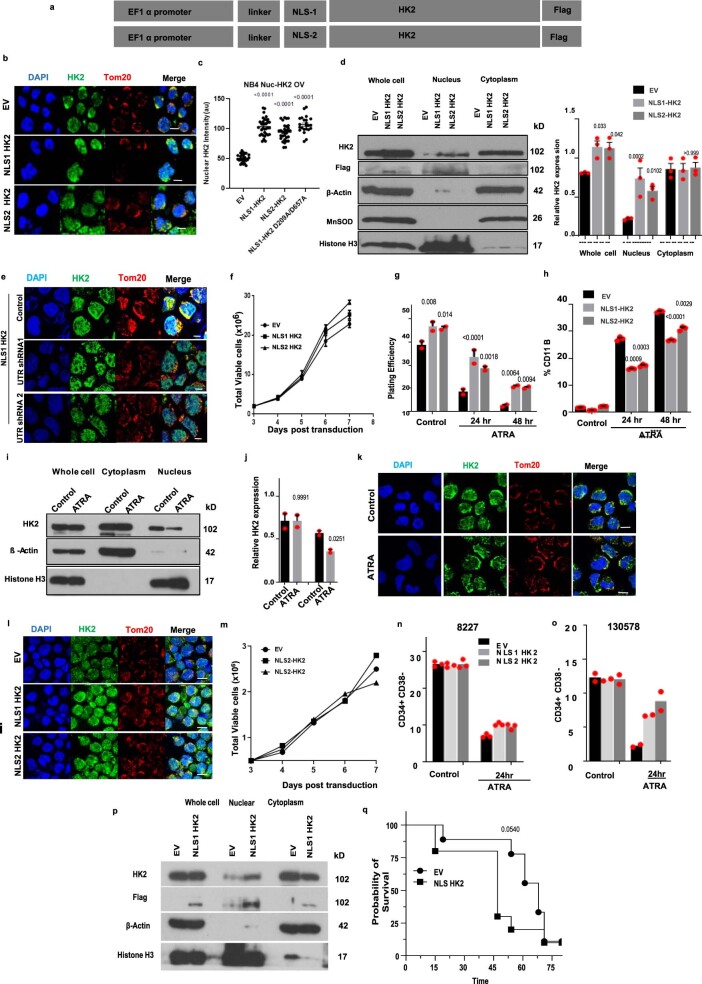
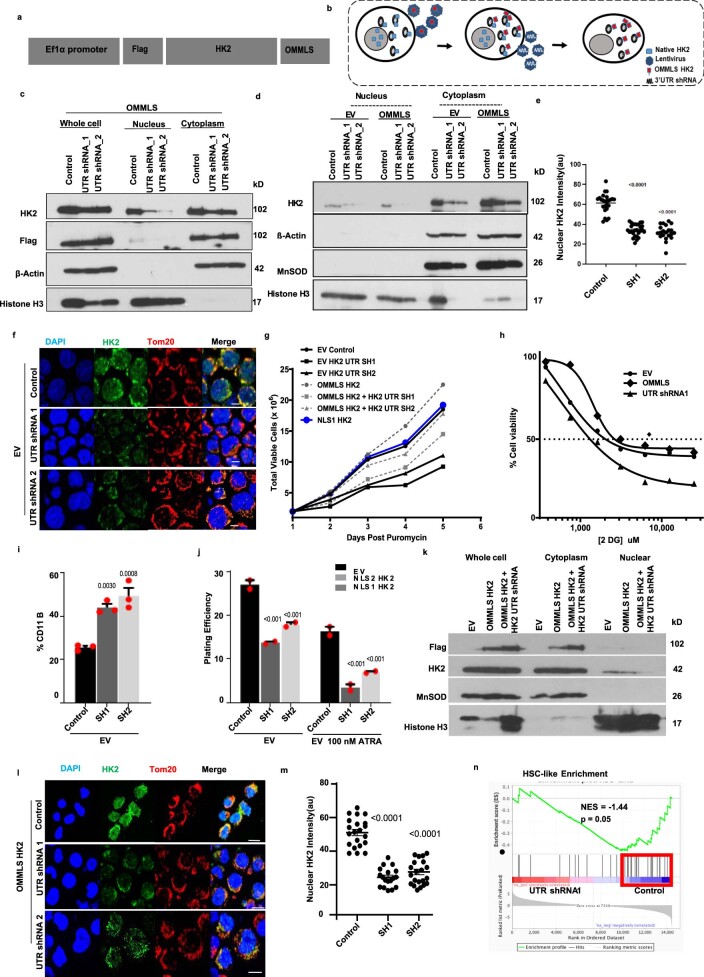
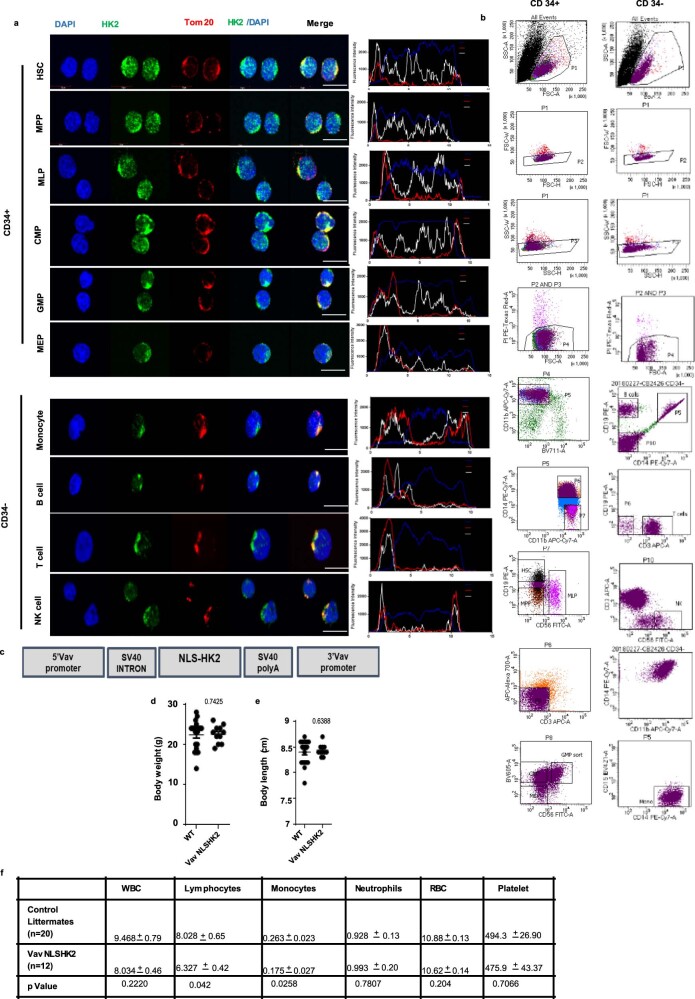
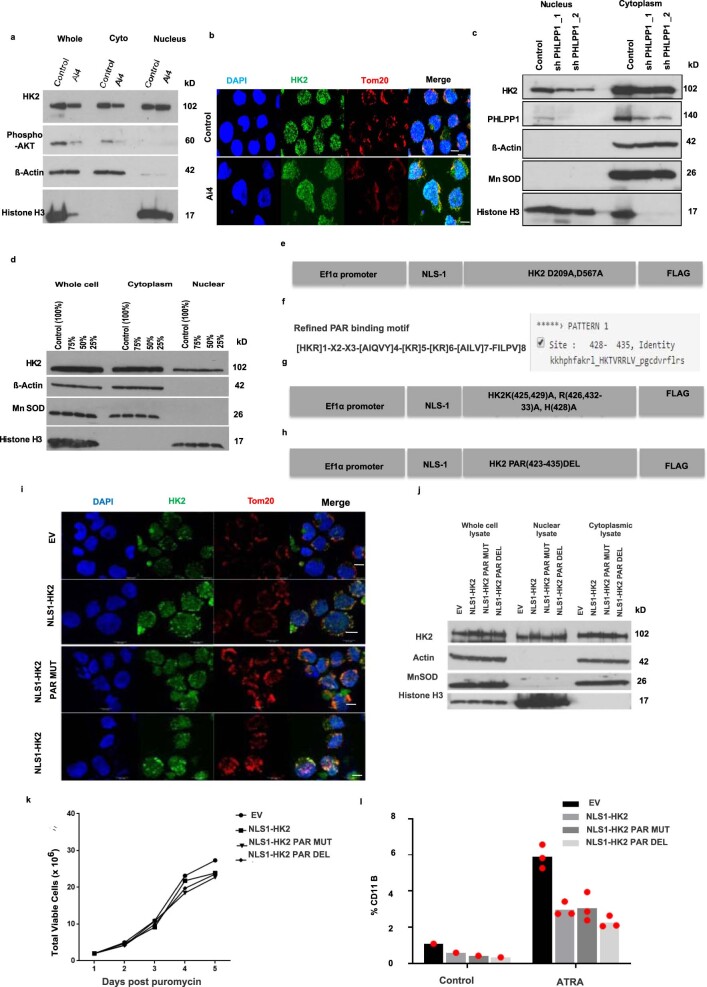
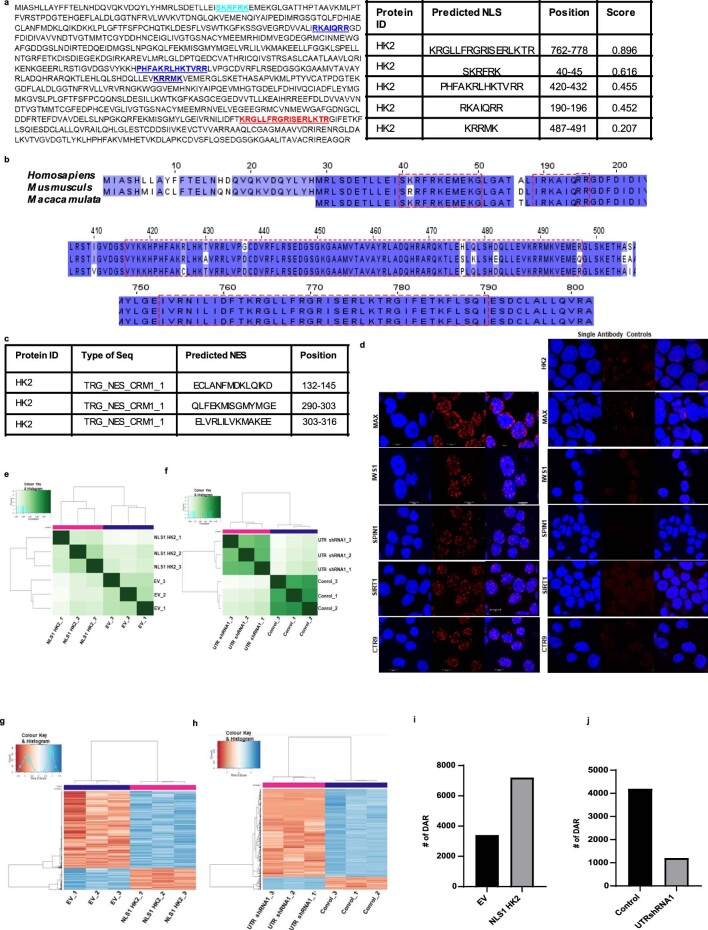
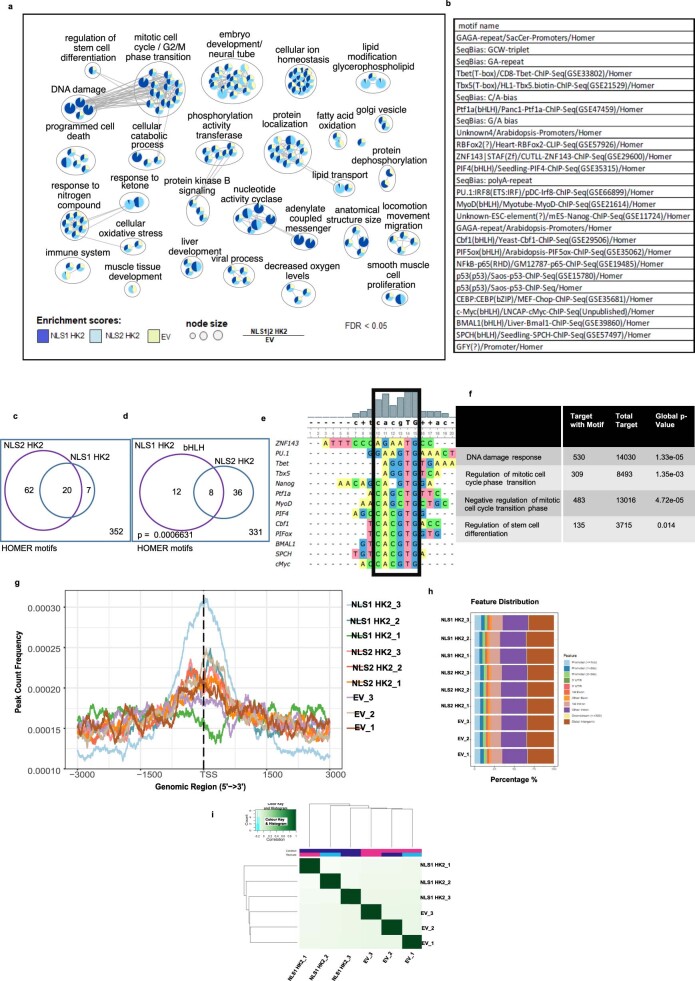
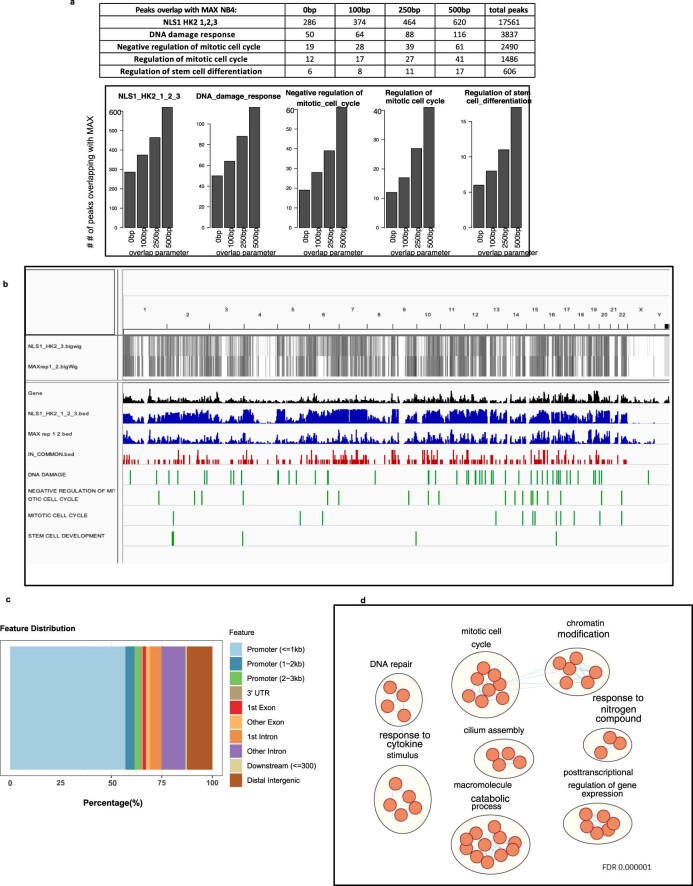
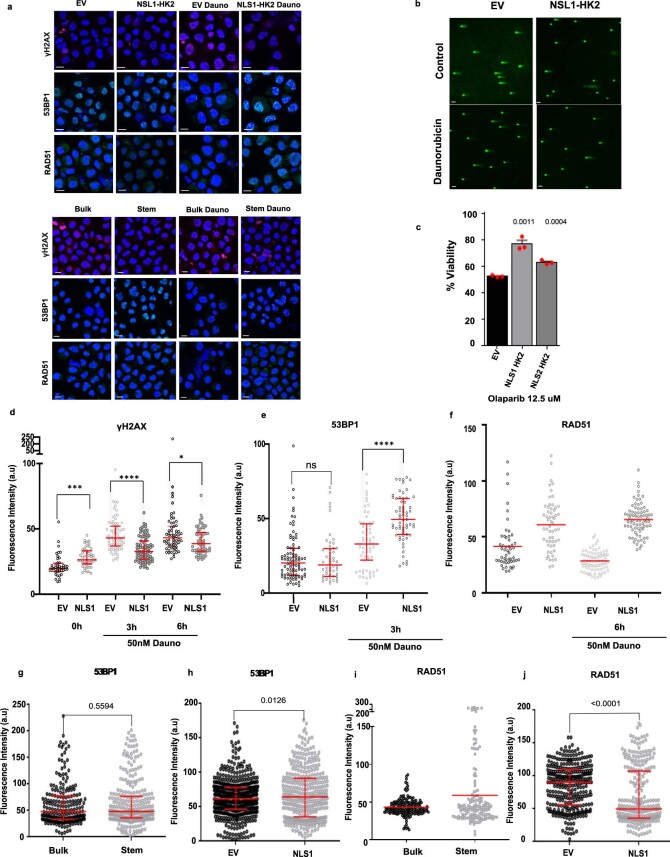
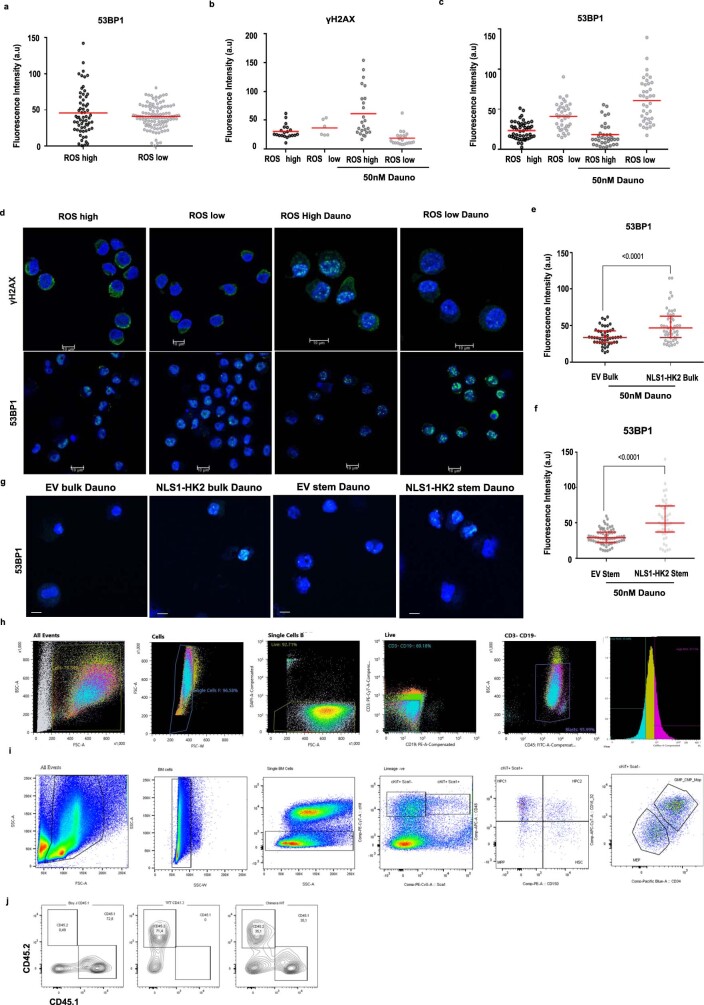
Mitochondrial metabolites regulate leukaemic and normal stem cells by affecting epigenetic marks. How mitochondrial enzymes localize to the nucleus to control stem cell function is less understood. We discovered that the mitochondrial metabolic enzyme hexokinase 2 (HK2) localizes to the nucleus in leukaemic and normal haematopoietic stem cells. Overexpression of nuclear HK2 increases leukaemic stem cell properties and decreases differentiation, whereas selective nuclear HK2 knockdown promotes differentiation and decreases stem cell function. Nuclear HK2 localization is phosphorylation-dependent, requires active import and export, and regulates differentiation independently of its enzymatic activity. HK2 interacts with nuclear proteins regulating chromatin openness, increasing chromatin accessibilities at leukaemic stem cell-positive signature and DNA-repair sites. Nuclear HK2 overexpression decreases double-strand breaks and confers chemoresistance, which may contribute to the mechanism by which leukaemic stem cells resist DNA-damaging agents. Thus, we describe a non-canonical mechanism by which mitochondrial enzymes influence stem cell function independently of their metabolic function.


Conflict of interest statement

A.D.S. has received research funding from Takeda Pharmaceuticals and Medivir AB as well as consulting fees/honorarium from Takeda, Novartis, Jazz and Otsuka Pharmaceuticals. A.D.S. is named on a patent application for the use of DNT cells to treat AML (US patent application no. US62/971,534). The remaining authors declare no competing interests.

Figures

Fig. 1
Fig. 1. HK2 localizes to the nuclei of leukaemic stem and progenitor cells.
a, Immunoblot of glycolytic and tricarboxylic acid-cycle enzymes in the nucleus, cytoplasm and whole-cell lysate of FACS-sorted stem and bulk 8227 cells. Representative immunoblot from n = 3 biological repeats. b, Confocal microscopy images of HK2 and the mitochondrial protein Tom20 in FACS-sorted stem and bulk 8227 cells. Representative images from n = 3 biological repeats. c, Confocal microscopy images of HK2 in ROS-low LSCs and ROS-high bulk primary cells from patients with AML. Images are representative of three biologically independent samples. d, Nuclear HK2 expression in samples from patients with AML (n = 25) and AML cell lines (n = 15), determined using RPPA. Patient samples: minimum, −2.696; maximum, −1.200; and median −1.679; AML cell lines: minimum, −3.1878; maximum, −0.5461; and median, −1.997. In the box-and-whisker plots, the horizontal lines mark the median, the box limits indicate the 25th and 75th percentiles, and the whiskers extend to 1.5× the interquartile range from the 25th and 75th percentiles. e, 8227 cells were transduced with NLS1–HK2 or control, using a blue fluorescent protein (BFP)-expressing vector. BFP-sorted cells were imaged using confocal microscopy. Representative images of HK2 in control-vector and NLS1–HK2 8227 cells from n = 3 biological repeats are shown. f, The right femur of NOD/SCID-GF mice (n = 7 EV and 8 NLS1–HK2 mice) was injected with 8227 cells transduced with NLS–HK2 or control vector. Eight weeks post injection, engraftment of 8227 cells into the uninjected left femur was measured by flow cytometry. g, Cells from f were injected into secondary mice and the engraftment efficiency was measured 8 weeks later by flow cytometry (n = 7 mice per group). b,c,e, Scale bars, 10 µm. f,g, Statistical analyses were performed using a two-tailed unpaired Student’s t-test. Data represent the mean ± s.e.m. Source data
Fig. 2
Fig. 2. Knockdown of nuclear HK2 reduces stem and progenitor cell function.
a, Confocal microscopy images of HK2 and Tom20 staining in NB4 cells 5 d after transduction with OMMLS–HK2 or EV. b, Half maximal inhibitory concentration (IC50) of 2-DG in OMMLS–HK2 and control NB4 cells 48 h after treatment. c, Confocal images of HK2 staining after transduction of OMMLS–HK2 NB4 cells with two shRNA (SH1 and SH2) targeting the untranslated region (UTR) of HK2. a,c, Scale bars,10 µm. Images are representative of n = 3 biological repeats. d, Clonogenic growth of OMMLS–HK2 NB4 cells transduced with shRNAs targeting the HK2 UTR and treated with ATRA (100 nM). e, Expression levels of CD11b in OMMLS–HK2 NB4 cells transduced with shRNA to the HK2-UTR and treated with ATRA (100 nM). f, Percentage of CD34+CD38 cells in 8227 cells transduced with OMMLS–HK2 and HK2-UTR shRNAs, in incubated with or without 100 nM ATRA for 24 h. b,df, n = 3 biological repeats. g, OCI-AML2 cells with selective nuclear HK2 knockdown or EV were subcutaneously injected into the flanks of SCID mice (n = 10 mice per group). Tumour volume was measured every alternate day for 18 d, starting 6 d after injection. h, OMMLS-HK2 AML2 cells were transduced with shRNAs targeting the HK2 UTR and subcutaneously injected into the flanks of SCID mice. The weights of subcutaneous tumours were measured at the end of the experiment (n = 10 mice per group). i, TEX cells with nuclear HK2 knockdown or EV were injected into the right femur of NOD/SCID-GF mice (n = 5 per group). Engraftment of TEX cells into the uninjected left femur was measured by flow cytometry 5 weeks post injection. j, GSEA of 8227 cells transduced with OMMLS–HK2 and shRNAs targeting the HK2 UTR. The NES and P values were analysed using a modified Kolmogorov–Smirnov test. k, Gene-set variation analysis score for LSC-positive gene signatures in 8227 cells transduced with OMMLS–HK2 and shRNAs targeting the HK2 UTR. Control: minimum, 0.8600; maximum, 1.271; and median, 1.066. SH1: minimum, −0.9867; maximum, −0.4826; and median, −0.6619. l, Gene-set variation analysis (GSVA) score for HSC gene signatures in 8227 cells transduced with OMMLS–HK2 and shRNAs targeting the HK2-UTR. Control: minimum, 0.09000; maximum, 0.2500; and median, 0.1700. SH1: minimum, −0.2500; maximum, −0.09000; and median, −0.1500. k,l, In the box-and-whisker plots, the horizontal lines mark the median, the box limits indicate the 25th and 75th percentiles, and the whiskers extend to 1.5× the interquartile range from the 25th and 75th percentiles. b,di,k,l, Statistical analyses were performed using a two-tailed unpaired Student’s t-test (b,h,i,k,l) and ordinary one-way (df) or two-way (g) analysis of variance (ANOVA) with Sidak’s multiple comparison test; P values for comparisons to the control are provided. Data represent the mean ± s.e.m. Nuc-HK2 KD, nuclear HK2 knockdown. Source data
Fig. 3
Fig. 3. HK2 localizes to the nuclei of haematopoietic stem and progenitor cells.
a, Fluorescence intensity of nuclear HK2 in haematopoietic cell populations from cord blood. A.u., arbitrary units; n = 183 cells examined from three biological samples. b, CD34+-enriched normal haematopoietic cells were transduced with NLS1–HK2 or control vector and injected into the right femur of NOD/SCID-GF mice (n = 4 (EV) and 5 (NLS1–HK2) mice). Engraftment of transduced cord blood cells in the left femur of mice was measured using flow cytometry 8 weeks after the injection. c, Cells from b were injected into secondary mice and the engraftment efficiency was measured 8 weeks later using flow cytometry (n = 5 mice per group). d, Confocal microscopy images of HK2 and Tom20 staining in bone marrow cells from Vav-NLS–HK2 mice and control littermate wild-type mice. Scale bar, 10 µm. Images are representative of n = 20 biologically independent samples. e, Percentage of linckit+Sca+CD48CD150+ cells in the bone marrow of the Vav-NLS–HK2 mice and their littermate controls (n = 12 (wild-type control) and 10 (Vav-NLS–HK2) mice). f, Percentage of granulocyte-monocyte and common myeloid progenitor (left), and megakaryocyte–erythroid progenitor (right) cells in the bone marrow of the Vav-NLS–HK2 mice and their littermate controls (n = 9 (wild-type control) and 6 (Vav-NLS–HK2) mice). g, Bone marrow cells from Vav-NLS–HK2 mice or their littermates (CD45.2+; donor) were co-transplanted with CD45.1+ bone marrow cells as competitors (1:1 ratio) into B6.SJL recipient mice (CD45.1+). Reconstitution units (CD45.2/CD45.1) were analysed in the peripheral blood of the chimaera mice over the specified period using flow cytometry (n = 10 mice per group). h, Reconstitution efficacy in the bone marrow from g was analysed at week 12 (n = 10 mice per group). b,c,eh, Statistical analyses were performed using a two-tailed unpaired Student’s t-test. Data represent the mean ± s.e.m. MPP, multipotent progenitors; MLP, multilymphoid progenitors; CMP, common myeloid progenitors; GMP, granulocyte-monocyte progenitors; and MEP, megakaryocyte–erythroid progenitors. Source data
Fig. 4
Fig. 4. Nuclear HK2 maintains stemness independently of its kinase activity and is mediated by active import/export.
a, Confocal microscopy images of HK2 and Tom20 staining in NB4 cells 5 d after transduction with NLS1–HK2, the kinase-dead NLS1–HK2 D209A/D657A mutant or EV. b, Cell viability of NB4 cells after transduction with NLS1–HK2, NLS2–HK2 or NLS1–HK2 D209A/D657A; n = 2 biological repeats. c, Expression of CD11b in NB4 cells transduced with NLS1–HK2, NLS2–HK2 or NLS1–HK2 D209A/D657A and treated with ATRA (100 nM); n = 3 biological repeats. d, Clonogenic growth of NB4 cells transduced with NLS1–HK2, NLS2–HK2 or NLS1–HK2 D209A/D657A and treated with ATRA (100 nM); n = 3 biological repeats. e, Immunoblot analysis of HK2 in the nuclear and whole-cell lysates of NB4 cells treated with shRNAs targeting IPO5. f, Confocal microscopy images of HK2 and Tom20 in NB4 cells after IPO5 (shIPO5-1 and shIPO5-2; second and third rows) and IPO11 (shIPO11; bottom) knockdown using shRNA. g,h, Representative confocal images of HK2 and Tom20 in NB4 cells treated with the XPO1 inhibitors leptomycin (g) and selinexor (h). i, HK2 expression in the cytoplasmic and nuclear fractions of various leukaemic cell lines (n = 20) following treatment with the XPO1 inhibitor KPT185 for 6 or 24 h, determined using RPPA analysis. Cytoplasm 0 h: minimum, 0.6462; maximum, 3.5142; and median, 1.6358. Nucleus 0 h: minimum, −3.5388; maximum, −0.5461; and median −2.1901. Cytoplasm 6 h: minimum, 0.4226; maximum, 3.5298; and median, 1.622. Nucleus 6 h: minimum, −4.130; maximum, −1.025; and median, −2.552. Cytoplasm 24 h: minimum, 0.0185; maximum, 3.1735; and median, 0.9156. Nucleus 24 h: minimum, −3.334; maximum, 1.817; and median, −1.1624. In the box-and-whisker plots, the horizontal lines mark the median, the box limits indicate the 25th and 75th percentiles, and the whiskers extend to 1.5× the interquartile range from the 25th and 75th percentiles. a,eh, Images are representative of three biological repeats. a,fh, Scale bars, 10 µm. c,d, Data represent the mean ± s.e.m. c,d,i, Statistical analyses were performed using a two-tailed unpaired Student’s t-test (c,d) or a paired Wilcoxon rank-sum test. Source data
Fig. 5
Fig. 5. Nuclear HK2 modulates chromatin accessibility and is involved in the maintenance of DNA integrity.
a, Proteins that interact with NLS1–HK2, as determined by BioID coupled with mass spectrometry; n = 3 biological repeats. b, Intensity of the PLA signal of endogenous HK2 and MAX, SIRT1, IWS1, CTR9 and SPIN1 in NB4 cells. A.u., arbitrary units; n = 278 cells from three biological repeats. c, Chromatin accessibility, measured through ATAC-seq, following overexpression of NLS1–HK2 in NB4 cells; n = 3 biological repeats. d, LSC+ and LSC signatures in EV control NB4 cells. LSC: minimum, 5.15; maximum, 12.81; and median, 8.27. LSC+: minimum, 5.990; maximum, 12.030; and median, 9.325. e, LSC+ and LSC signatures in NLS1–HK2 NB4 cells. LSC: minimum, 6.840; maximum, 13.010; and median, 9.020. LSC+: minimum, 7.300; maximum, 12.340; and median, 9.895. f, ATAC-seq pathway enrichment analysis in EV control and NLS1–HK2 NB4 cells. The size of the pie chart slices is proportional to the FDR score, −log10(FDR), for each of the gene lists. Blue and pink lines pinpoint to pathways that overlap significantly with the HSC and granulocyte (GRAN) gene lists at FDR < 0.05 according to a Fisher’s exact test. g, Enhanced enrichment of the pathways in NLS1–HK2 and NLS2–HK2 ChIP–seq compared with EV control ChIP–seq in NB4 cells. h, Consensus motif identified by HOMER DNA-binding-motif analysis significantly enriched in NLS1– and NLS2–HK2 peaks at FDR < 0.05. The P value shows significant enrichment of bHLH motifs, determined using a Fisher’s exact test. The boxes with the dashed lines represent sequence similarity overlap. i, Enrichment of the consensus motif CACGTG in sequences of peaks associated with the selected pathways. The hypergeometric P value estimated using the Fisher’s exact test indicate the significance of the enrichment of the motif when compared with random sequences. ce, Statistical analyses were performed using a two-tailed unpaired Student’s t-test. Data represent the mean ± s.e.m. d,e, In the box-and-whisker plots, the horizontal lines mark the median, the box limits indicate the 25th and 75th percentiles, and the whiskers extend to 1.5× the interquartile range from the 25th and 75th percentiles. Source data
Fig. 6
Fig. 6. Nuclear HK2 overexpression enhances the DNA-damage response and increases chemoresistance in AML.
a, Levels of γH2AX in NLS1–HK2 and EV control 8227 cells after treatment with 50 nM daunorubicin for 0, 3 and 6 h; n = 2,041 cells from four biological repeats were examined. b, Levels of γH2AX in stem and bulk 8227 cells after treatment with 50 nM daunorubicin for 0, 3 and 6 h; n = 1,786 cells from three biological repeats were examined. c, Levels of 53BP1 in NLS1–HK2 and EV control 8227 cells after treatment with 50 nM daunorubicin for 3 h; n = 645 cells from four biological repeats were examined. d, Levels of 53BP1 levels in stem and bulk 8227 cells after treatment with 50 nM daunorubicin for 3 h; n = 549 cells from three biological repeats were examined. e, Levels of RAD51 in NLS1–HK2 and EV control 8227 cells after treatment with 50 nM daunorubicin for 6 h; n = 551 cells from three biological repeats were examined. f, Levels of RAD51 in stem and bulk 8227 cells after treatment with 50 nM daunorubicin for 6 h; n = 477 cells from two biological repeats were examined. g, Clonogenic growth of NB4 cells transduced with NLS1–HK2 and treated with 50 nM daunorubicin for 3 h before plating. The colonies were counted 6 d after plating; n = 3 biological repeats. h, Comet assay in 8227 cells transduced with NLS1–HK2 before and after incubation with 70 nM daunorubicin for 6 h; n = 1,474 cells from three biological repeats were examined. i, Relative messenger RNA expression levels of genes associated with homologous recombination (XRCC2 and XRCC3) and non-homologous end joining (XRCC5, XRCC6 and PRKDC) in stem and bulk 8227 cells; n = 3 biological repeats. j, GSEA analysis of DNA-repair pathways in primary samples from patients with undifferentiated versus committed AML. The NES and FDR values were analysed using a modified Kolmogorov–Smirnov test. k, Levels of γH2AX in stem and bulk fractions of primary sample from a patient with AML (AML151258) after treatment with 50 nM daunorubicin for 0 and 3 h; n = 225 cells were examined from one of two biological samples. l, Levels of 53BP1 in the stem and bulk fractions of a primary sample from a patient with AML (AML151258) following treatment with 50 nM daunorubicin for 3 h; n = 111 cells were examined from one of two biological samples. af,k,l, The protein levels were determined using confocal microscopy. Statistical analyses were performed using a two-tailed unpaired Student’s t-test in all panels except j, where a Fischer’s exact t-test was performed. Data represent the median and interquartile range (ae,h), the mean (f,k,l) or the mean ± s.e.m. (g,i). Dauno, daunorubicin; a.u., arbitrary units. Source data
Extended Data Fig. 1
Extended Data Fig. 1. HK2 localizes to the nucleus in AML.
(a) Diagram of the glycolytic and TCA cycles. (b) Immunoblot analysis of glycolytic and TCA cycle metabolic enzymes in nuclear, cytoplasmic and whole-cell lysates of (b) OCI-AML2 and NB4 cells & (c) TEX and U937 cells. Representative immunblot from 3 biologic repeats. (d) Representative confocal microscopy images of HK2 (green) and Tom20 in AML2, NB4 and TEX cells. Scale bar = 10µm. Representative immunblot from 3 biologic repeats. (e) Expression of HK2 and the related glycolytic enzymes, enolase and GAPDH, by immunoblotting in cytoplasmic and nuclear fractions of primary AML patient samples n = 5 biologically independent samples. (f) Expression of HK2 by immunoblotting in cytoplasmic and nuclear fractions of primary AML patient samples. n = 4 biologically independent samples. (g) Representative confocal microscopy images of HK2 (white) in AML patient samples. Scale bar = 10µm. n = 3 biologically independent samples. (h) Fluorescence intensity analysis in 8227 cells and AML patient samples, separated into stem and bulk populations. n = 165 cells examined from 4 biologically independent samples. Statistical analyses for all experiments was performed using a two-tailed unpaired Student’s t-test. Data shown represent mean +/- s.e.m. Source data
Extended Data Fig. 2
Extended Data Fig. 2. Nuclear HK2 over-expression enhances stemness.
(a) cDNA construct of HK2 fused in frame with c-Myc (NLS1) or SV40 (NLS2) Nuclear Localizing Signal (NLS). (b) Representative confocal microscopy images of HK2 (green) or Tom20 (red) in NB4 cells 5 days after transduction with NLS-HK2 or EV. Scale bar= 10µm. Representative images from 3 biologic repeats. (c) Quantification of fluorescence intensity of nuclear HK2 in NB4 cells after transduction with NLS-HK2 or EV. n = 114 cells examined from 3 biologic repeats. (d) NB4 cells were transduced with NLS- HK2 or EV. The level of HK2 in the nucleus and whole-cell lysates was measured after 5 days of transduction using immunoblotting. The densitometry plots of relative HK2 expression were performed in subcellular lysates. n = 3 biologic repeats. (e) Representative confocal microscopy images of HK2 (green) or Tom20 (red) in NLS1-HK2 NB4 cells after transduction with shRNAs targeting the UTR of HK2. Scale bar= 10µm. Representative image from 3 biologic repeats. (f) Growth and viability of NB4 cells at increasing times after transduction with NLS-HK2. n = 5 biologic repeats. (g) Clonogenic growth of NB4 cells transduced with NLS-HK2 and treated with ATRA (100nM). n = 3 biologic repeats. (h) Expression of CD11b in NB4 cells transduced with NLS-HK2 and treated with ATRA (100nM). n = 4 biologic repeats. (i) NB4 cells were treated with ATRA for 72hrs and subcellular fractions were analysed for HK2 by immunoblot. n = 3 biologic repeats. (j) The densitometry plots of relative HK2 expression were performed in subcellular lysates. (k) Representative confocal microscopy images of HK2 (green) and Tom20 (red) in NB4 cells treated with ATRA. Scale bar= 10µm. Representative image from 2 biologic repeats. (l) Representative confocal microscopy images of HK2 (green) in 8227 cells 5 days after transduction with NLS-HK2 or EV. Scale bar= 10µm. Representative image from 3 biologic repeats. (m) Growth and viability of 8227 after transduction with NLS-HK2. n = 2 biologic repeats. (n) Percentage of CD34+CD38- cells in 8227 cells, n = 2 biologic repeats and (o) 130578 cells, n = 2 biologic repeats transduced with NLS-HK2 and treated with ATRA (100nM). (p) TEX cells were transduced with NLS1-HK2 or EV. Subcellular fractions were analysed for HK2 by immunoblot 5 days post transduction. (q) TEX cells transduced with NLS1-HK2 or EV were injected into NSGF mice. Survival of the mice was measured over 75 days (n = 9, EV mice, n = 10, NLS1-HK2 mice). Statistical analyses was performed using a two-tailed unpaired Student’s t-test (d, j) and Ordinary Two-way ANOVA, Tukeys multiple comparison test (g, h). Data from represent mean +/- s.e.m, except (m-o) which represents the mean. A Kaplan Meier curve analysed survival using the gehan-breslow-wilcoxon test. Source data
Extended Data Fig. 3
Extended Data Fig. 3. Selective nuclear HK2 knockdown decreases stemness.
(a) cDNA construct of HK2 fused in frame with outer mitochondrial membrane localizing signal (OMMLS). (b) Experimental approach to selectively knockdown nuclear HK2. (c) & (d) NB4 cells overexpressing mitochondrial localized HK2 (OMMLS HK2) were transduced with shRNAs targeting the UTR of HK2. Levels of HK2 in the nucleus and whole cell were measured by immunoblot 5 after of transduction. Representative immunblot from 3 biologic repeats. (e) Quantification of fluorescence intensity of transduced OMMLS HK2 NB4 with shRNAs targeting the UTR of HK2. n = 73 cells examined from 3 biologic repeats. (f) Representative confocal microscopic images of HK2 (green) and Tom20 (red) in NB4 cells after transduction with shRNA targeting the UTR of HK2. Scale bar = 10µm. Representative images from 3 biologic repeats. (g) Cell growth and viability plot of OMMLS HK2 or EV NB4 cells after transduction with shRNAs targeting the UTR of HK2. n = 2 biologic repeats. (h) Cell viability of OMMLS-HK2, UTRsh1, and EV NB4 cells after treatment with increasing concentrations of 2-DG for 48hrs. n = 3 biologic repeats. (i) Expression of CD11b in EV NB4 cells after transduction with shRNA targeting the UTR of HK2 and treated with ATRA (100nM). n = 3 biologic repeats. (j) Clonogenic growth of EV NB4 cells after transduction with shRNA targeting the UTR of HK2 and treated with ATRA (100nM). n = 3 biologic repeats. (k) OMMLS HK2 AML2 cells were transduced with shRNAs targeting the UTR of HK2. Subcellular lysates were analysed by immunoblot 5 days after transduction. (l) Representative confocal microscopic images of HK2 (green) after transduction of 8227 cells with OMMLS-HK2 and UTR shRNAs targeting HK2. Scale bar = 10µm. Representative image from 3 biologic repeats. (m) Quantification of fluorescence intensity of nuclear HK2 in OMMLS HK2 8227 cells after transduction with shRNAs targeting the UTR of HK2. n = 63 cells examined from 3 biologic repeats. (n) Gene set enrichment analysis (GSEA) in 8227 cells transduced with OMMLS-HK2 and UTR shRNAs targeting HK2 for HSC gene signatures. The normalized enrichment scores (NES), and p value analysed using a modified Kolmogorov–Smirnov test. Statistical analyses for experiments (e, m) was performed using a two-tailed unpaired Student’s t-test and Ordinary one-way ANOVA Sidaks multiple comparison (i-j). Data represent mean +/- s.e.m. Source data
Extended Data Fig. 4
Extended Data Fig. 4. HK2 localizes to nucleus of hematopoietic stem/progenitor cells.
(a) Representative confocal microscopy images of HK2 (green) and Tom20 (red) in FACS sorted CD34+ and CD34- cord blood cells. Scale bar = 10µm. The white (HK2), red (Tom20) and blue (DAPI) curve in the scan profiles represents the fluorescence intensity of HK2, Tom20 and DAPI along the plane. Representative images from 3 biologic samples. (b) Gating strategy for FACs sorted CD34+ and CD34- cord blood cells. (c) Vav promoter flanked cDNA construct of HK2 fused in frame with a nuclear localizing signal. (d) Body weight (n = 42 wild-type control mice, n = 22 Vav-NLS-HK2 mice) and body length (e) (n = 48 wild-type control mice, n = 31 Vav-NLS-HK2 mice) of Vav NLS-HK2 transgenic mice and control littermates. (f) Complete blood count analysis of Vav NLS-HK2 transgenic mice and control littermates (n = 21 wild-type control mice, n = 13 Vav-NLS-HK2 mice). Statistical analyses for experiments (d-e) was performed using an unpaired Student’s t-test. Data represent mean +/- s.e.m. Source data
Extended Data Fig. 5
Extended Data Fig. 5. HK2 maintains stemness independently of its metabolic function.
(a) Subcellular fractions of NB4 cells were measured by immunoblot analysis after treatment with DMSO or AKT inhibitor (Ai4) for 24hrs. Representative immunoblot from 3 biologic repeats. (b) Representative confocal images of HK2 (green) and Tom20 (red) in NB4 cells treated with AKT inhibitor (Ai4). Scale bar= 10µm. Representative image from 3 biologic repeats. (c) NB4 cells were transduced with shRNAs targeting PHLPP1 or control sequences. Five days after transduction, HK2 expression in the nucleus and cytoplasm was measured by immunoblotting. Representative immunoblot from 2 biologic repeats. (d) AML2 cells were grown with decreasing glucose concentrations in IMDM media for 24 hours and subcellular fractions were analysed. Representative immunoblot from 3 biologic repeats. (e) Construct of nuclear localizing HK2 kinase-dead double mutant with c-Myc nuclear localizing signal at the N-terminal region. The Aspartic acid residues at 209 and 567 were mutated to Alanine. (f) The predicted PAR binding motif in HK2 using Pattinprot. (g) Construct of nuclear localizing PAR mutant of HK2 with c-Myc nuclear localizing signal at the N-terminal region. (h) Construct of nuclear localizing PAR deletion of HK2 with c-Myc nuclear localizing signal at the N-terminal region of HK2. (i) Representative confocal microscopy images of HK2 (green) or Tom20 (red) in NB4 cells 5 days after transduction with NLS1-HK2, NLS1- HK2 Par mut, NLS1-HK2 Par_Del or EV. Scale bar = 10µm. Representative image from 2 biologic repeats. (j) Immunoblot analysis of subcellular fractions of NLS1-HK2, NLS1- HK2 Par_mut, NLS1-HK2 Par_Del cells transduced NB4 cells. (k) Cell growth and viability of NB4 cells after transduction with NLS1-HK2, NLS1- HK2 Par_mut, NLS1-HK2 Par_Del or EV. n = 1 independent experiment with 3 technical replicates. (l) Expression of CD11b in NB4 cells transduced with NLS1-HK2, NLS1- HK2 Par_mut, NLS1-HK2 Par_Del and treated with ATRA (100nM). n = 2 biologic repeats. Data from (l) represent mean. Source data
Extended Data Fig. 6
Extended Data Fig. 6. Nuclear HK2 modifies chromatin accessibility.
(a)The mammalian HK2 protein sequence was evaluated for nuclear localizing signals using the SeqNLS algorithm. (b) NLS conservation in HK2 of Homosapiens, Mus Musculus and Macaca mulata analysed using Clustal omega. (c)The predicted sequences and the positions of HK2 Nuclear Export Sequence by NESX1 library using Pattinprot and ELM library. (d) Representative confocal images of DuoLink Promity Assay interactions. Scale bar = 10µm. Representative image from 3 biologic repeats. (e) Clustering on peaks using DiffBind comparing NB4 cells transduced with NLS1-HK2 and EV. (f) Clustering on peaks using DiffBind comparing NB4 cells overexpressing OMMLS HK2 transduced with control sequences or shRNA targeting the UTR of HK2. (g) Heatmap plots of differentially accessible regions in NB4 cells overexpressing NLS1-HK2 or EV. (h) Heatmap plots of differentially accessible regions in NB4 cells overexpressing OMMLS HK2 transduced with control sequences or shRNA targeting the UTR of HK2. (i) Number of Differentially Accessible Regions in NB4 cells with NLS1-HK2 or EV measured by ATAC sequencing. (j) Number of Differentially Accessible Regions in NB4 cells overexpressing OMMLS HK2 transduced with control sequences or shRNA targeting the UTR of HK2 measured by ATAC sequencing.
Extended Data Fig. 7
Extended Data Fig. 7. ChIP-seq of HK2 reveals a role in stem cell regulation and DNA damage response.
(a) Network representation of NLS1-HK2 and NLS2-HK2 ChIP–seq pathways with higher enrichment scores compared to EV. Node size is proportional to the ratio of NLS1/2 to EV at FDR < 0.05 using a Fisher’s exact test. (b) Known motifs from HOMER significantly enriched in both NLS1 and NLS2-HK2 peaks at FDR<0.05. (c) Venn plot showing significantly enriched motifs in NLS1 HK2 and NLS2 HK2 at FDR<0.05 using Fisher’s exact test. (d) Venn diagram shows bHLH motifs among the common HOMER motifs between NLS1 HK2 and NLS2 HK2. Fisher’s exact test p value for the enrichment of this motif is 0.0006631. (e) Multiple alignment of the motifs using the UGene tool showing the frequency of each nucleotide identifying the consensus sequence. (f) Enrichment of consensus sequence in the specified pathways. (g) Peak distribution around TSS of genes in each individual ChIP–seq biological replicates. (h) Peak distribution of individual replicates relative to promoters, intronic or intergenic regions. (i) Clustering on identical peaks using the DiffBind tool shows that NLS1-HK2 and EV group separately.
Extended Data Fig. 8
Extended Data Fig. 8. Comparative analysis of nuclear HK2 and MAX ChIP-seq.
(a) Number of overlapping peaks between NLS1 HK2 and MAX ChIP–seq peaks using different overlap parameters. (b) Visualization of overlapping peaks between NLS1-HK2 and MAX ChIP–seq peaks in NB4 cells on a full genome view (0bp parameter). (c) Distribution of the peaks in common between NLS1-HK2 and MAX (0bp parameter). (d) Pathways (GO BP) enriched in the peaks common between NLS1-HK2 and MAX (0bp parameter), at FDR <0.000001 using the binomial test.
Extended Data Fig. 9
Extended Data Fig. 9. Nuclear HK2 enhances DNA repair.
(a) Representative confocal images of γH2AX and RAD51 expression at 6 hours, 53BP1 at 3 hours, in NLS1-HK2/EV transduced 8227 cells and sorted 8227 cells (stem/bulk) at baseline and after treatment with daunorubicin. Scale Bar = 10µm. Representative image from 3 biologic repeats. (b) Representative confocal images of comet assay in transduced 8227 cells. Scale bar = 70µm. Representative image from 3 biologic repeats. (c) Cell viability of EV, NLS1-HK2, NLS2-HK2 transduced NB4 cells after treatment with olaparib (12.5 µM) for 72 hours. n = 3 biologic repeats. (d) γH2AX levels were quantified by confocal microscopy in NLS1-HK2 NB4 cells after treatment with daunorubicin for 3 & 6 hours (50nM). n = 1536 cells examined over 3 biologic repeats. (e) 53BP1 levels were quantified by confocal microscopy after overexpressing NLS1-HK2 in NB4 cells and treating cells with daunorubicin for 3 hours (50nM). n = 1272 cells examined over 3 biologic repeats. (f) RAD51 levels were quantified by confocal microscopy in NLS1-HK2 NB4 cells after treatment with daunorubicin for 6 hours (50nM). n = 438 cells examined over 2 biologic repeats. (g) Baseline 53BP1 expression in 8227 stem and bulk controls. n = 510 cells examined over 3 biologic repeats. (h) Baseline 53BP1 expression in 8227 cells overexpressing NLS1- HK2. n = 879 cells examined over 4 biologic repeats. (i) Baseline RAD51 expression in 8227 stem and bulk controls . n = 331cells examined over 2 biologic repeats. (j) Baseline RAD51 expression in 8227 cells overexpressing NLS1- HK2. n = 671 cells examined over 3 biologic repeats. Statistical analyses for experiments was performed using an unpaired Student’s t-test. Data shown in (d-e, g-h, j) represent median and interquartile range, data from (c) represent mean +/- s.e.m, data from (f) represent mean. Source data
Extended Data Fig. 10
Extended Data Fig. 10. AML stem cells demonstrate enhanced DNA repair.
(a) Baseline 53BP1 expression in stem and bulk primary patient control cells (AML151258). n = 170 cells examined from 1 of 2 biologic samples. (b) γH2AX levels were quantified by confocal microscopy in stem and bulk fractions of primary patient cells (AML161820) after treatment with daunorubicin for 0 and 3 hours (50nM). n = 71 cells examined from 2 of 2 biologic samples. (c) 53BP1 levels in stem and bulk primary patient cells (AML161820) at baseline and after treatment with daunorubicin for 3 hours (50nM). n = 161 cells examined from 2 of 2 biologic samples. (d) Representative confocal images of γH2AX and 53BP1 in primary patient cells (AML151258) sorted into stem and bulk populations based on ROS levels at baseline and 3 hours after treatment with daunorubicin. Scale Bar = 10µm. Representative images from 1 of 2 biologic samples. (e) 53BP1 levels in EV and NLS1-HK2 transduced sorted bulk 8227 cells and (f) sorted stem cells after 3-hour treatment with daunorubicin (50nM). n = 203 cells examined from 3 biologic replicates. (g) Representative confocal images of 53BP1 in transduced sorted 8227 cells 3 hours after treatment with daunorubicin (50nM). Scale bar = 10µm Representative images from 3 biologic replicates. (h) Gating strategy for ROS high and ROS low AML patient samples. (i) Gating strategy for mouse bone marrow hematopoietic analysis. (j) Gating strategy for competitive repopulation assay. Statistical analyses for experiments was performed using an unpaired Student’s t-test. Data shown in (e-f) represent median and interquartile range, data from (a-c) represent mean. Source data

References

    1. Kreso A, Dick JE. Evolution of the cancer stem cell model. Cell Stem Cell. 2014;14:275–291. doi: 10.1016/j.stem.2014.02.006. - DOI - PubMed
    1. Wang JC, Dick JE. Cancer stem cells: lessons from leukemia. Trends Cell Biol. 2005;15:494–501. doi: 10.1016/j.tcb.2005.07.004. - DOI - PubMed
    1. Gut P, Verdin E. The nexus of chromatin regulation and intermediary metabolism. Nature. 2013;502:489–498. doi: 10.1038/nature12752. - DOI - PubMed
    1. Moussaieff A, et al. Glycolysis-mediated changes in acetyl-CoA and histone acetylation control the early differentiation of embryonic stem cells. Cell Metab. 2015;21:392–402. doi: 10.1016/j.cmet.2015.02.002. - DOI - PubMed
    1. Ward PS, et al. The common feature of leukemia-associated IDH1 and IDH2 mutations is a neomorphic enzyme activity converting α-ketoglutarate to 2-hydroxyglutarate. Cancer Cell. 2010;17:225–234. doi: 10.1016/j.ccr.2010.01.020. - DOI - PMC - PubMed

Publication types

Grants and funding