. 2022 Jul;18(7):762-773.
doi: 10.1038/s41589-022-01035-1. Epub 2022 Jun 6.

Mucin O-glycans are natural inhibitors of Candida albicans pathogenicity

Affiliations

Mucin O-glycans are natural inhibitors of Candida albicans pathogenicity

Julie Takagi et al. Nat Chem Biol. 2022 Jul.

Abstract

Mucins are large gel-forming polymers inside the mucus barrier that inhibit the yeast-to-hyphal transition of Candida albicans, a key virulence trait of this important human fungal pathogen. However, the molecular motifs in mucins that inhibit filamentation remain unclear despite their potential for therapeutic interventions. Here, we determined that mucins display an abundance of virulence-attenuating molecules in the form of mucin O-glycans. We isolated and cataloged >100 mucin O-glycans from three major mucosal surfaces and established that they suppress filamentation and related phenotypes relevant to infection, including surface adhesion, biofilm formation and cross-kingdom competition between C. albicans and the bacterium Pseudomonas aeruginosa. Using synthetic O-glycans, we identified three structures (core 1, core 1 + fucose and core 2 + galactose) that are sufficient to inhibit filamentation with potency comparable to the complex O-glycan pool. Overall, this work identifies mucin O-glycans as host molecules with untapped therapeutic potential to manage fungal pathogens.


Conflict of interest statement

Competing Interests

Clarissa J. Nobile is a cofounder of BioSynesis, Inc., a company developing diagnostics and therapeutics for biofilm infections. A patent application based on these results has been submitted by Massachusetts Institute of Technology and University of Basel with R.H., J.T., K.R. as inventors. All other authors declare no competing interests.

Figures

Extended Data Figure 1
Extended Data Figure 2
Extended Data Figure 3
Extended Data Figure 4
Extended Data Figure 5
Figure 1
Figure 1. Mucins across major mucosal surfaces share a conserved function in attenuating C. albicans virulence in vitro and in vivo
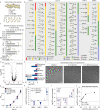
a) The mucus barrier hosts a diverse range of microorganisms while limiting infections. Candida albicans, an opportunistic fungal pathogen, resides within the mucosa. b) Native mucus suppresses fungal adherence to polystyrene wells. Depletion of intestinal mucus components increases fungal adherence. Supplementation of mucus filtrates with purified MUC2 reduces adhesion. Bars indicate mean ± SEM from n=3 biologically independent replicates using fluorescence images. Significance was assessed using one-way ANOVA followed by Bonferroni multiple comparisons test; ****P<0.0001 **P<0.01. c) MUC5AC, MUC5B, and MUC2 elicit global transcriptional responses in C. albicans. d) Dendrogram and hierarchical clustering heat map of genome-wide expression profiles from MUC5AC, MUC2, and MUC5B. Clustering was performed first along the sample dimension and then along the individual gene dimension using the Matlab clustergram function with Euclidean distances and Ward's linkage method. Color scale bar units are in SDs. e) Venn diagrams indicate the number of genes differentially expressed after exposure to mucins. f) RNA sequencing data for selected genes belonging to filamentation, biofilm formation, and pathogenesis. g) Mucins across three mucosal surfaces suppress filamentation. Phase-contrast images of SC5314 cells grown in RPMI medium with or without mucins at 37 °C for 8 h. Scale bar, 20 μm. h) Fungal viability was monitored in a live dermal wound model. i) Fungal burden on murine puncture wounds at 5 and 7 d after treatment with MUC2 or a mock-treatment (NT) control. Symbols represent colony-forming units from n=6 biologically independent replicates. The center bars indicate the median, the box limits indicate the upper and lower quartiles, and the whiskers indicate the minimum and maximum values. Significance was assessed using Welch and Brown-Forsythe ANOVA (assumes unequal variance) followed by Dunnett T3 multiple comparisons test; *P=0.016. j) Growth is not altered by mucins in the synthetic defined medium (SD). Data are the mean OD600 measurements ± SEM; n=4 (MUC5B, MUC5AC), n=6 (Medium, MUC2) biologically independent replicates. For c,d,e,f, a complete list of FC values and FDR-adjusted P values is provided in Supplementary Data 1. P values were determined using a two-tailed moderated t-test and FDR-adjusted (P<0.05) using Benjamini–Hochberg correction for multiple comparisons. Data from n=3 biologically independent replicates.
Figure 2
Figure 2. Mucin glycans potently inhibit filamentation in a time- and dose-dependent manner
a) Mucin glycans were isolated (Methods) from the protein backbone using alkaline β-elimination. b) Structural diversity and relative abundances of MUC5AC glycans analyzed by NSI-MS (Methods). The complete list of structures is listed in Supplementary Table 1. Negative mode NSI-MS detected sulfation on a subset of O-glycans, indicated with the letter S in a cyan circle (Supplementary Table 2). NeuAc, N-acetylneuraminic acid. c) Relative abundances of glycan features in the MUC5AC glycan pool. LacNAc, N-acetyllactosamine or Galβ1-3/4GlcNAc; GalGal, Galα1-3Gal; LacdiNAc, GalNAcβ1-4GlcNAc; O-Man, mannose linked α1 to serine or threonine. d) MUC5AC glycans elicit global transcriptional responses in C. albicans. e) Functional enrichment analyses reveal key virulence pathways among downregulated genes. Significance of enrichment was calculated using a two-tailed Mann-Whitney U test based on mean log2-transformed FCs from n=3 biologically independent replicates. The dotted line represents the threshold for significance (FDR-adjusted P<0.05). f) MUC5AC glycans inhibit filamentation. Phase-contrast images of WT SC5314 cells grown in RPMI medium alone, the monosaccharide (MS) pool or mucin glycans at 37 °C for 8 h. Scale bar, 20 μm. g) Growth is not altered in the presence of the MS pool or mucin glycans in synthetic defined medium. Data are mean OD600 measurements ± SEM from n=3 biologically independent replicates. h) Mucin glycans, unlike their monosaccharide components, downregulate signature virulence genes. Bars indicate mean ± SEM from n=5 (MS pool), n=10 (MUC5AC glycans) biologically independent replicates. i) MUC5AC glycans downregulate virulence gene expression over a prolonged time course. Bars indicate mean ± SEM from n=5 (0.5 h, 2 h), n=4 (4 h) biologically independent replicates. j) Mucin glycans regulate YWP1 expression in a concentration-dependent manner. Data points indicate mean ± SEM and are fitted to a nonlinear agonist binding curve from n=3 (0.01%, 0.025%, 0.3%), n=5 (0.05%, 0.1%) biologically independent replicates. For d,e, a complete list of FC values and FDR-adjusted P-values is provided in Supplementary Data 3 from n=3 biologically independent replicates. P values were determined using a two-tailed Wald test and FDR-adjusted (P<0.05) using Benjamini–Hochberg correction for multiple comparisons. For h,i,j, data are log2-transformed qPCR measurements normalized to a control gene (ACT1).
Figure 3
Figure 3. Mucin glycans act via Nrg1 to prevent filamentation and hyphal gene expression
a) MUC5AC glycans suppress the expression of key activators of the filamentation pathway. RNA-seq data for selected genes that are differentially regulated in the presence of MUC5AC glycans from n=3 biologically independent replicates (Supplementary Data 3). P values were determined using a two-tailed Wald test and FDR-adjusted (P<0.05) using Benjamini–Hochberg correction for multiple comparisons. b) MUC5AC glycans inhibit filamentation in strains hyperactivating the cAMP and MAPK pathways. Phase-contrast images of cells of the indicated genotype were grown in the presence or absence of MUC5AC glycans in Spider medium (PCKpr-efg1-T206E) or RPMI medium (prADH1-CPH1, RAS1G13V) at 37 °C for 4 h. Scale bar, 20 μm. c) Expression of NRG1 in wild-type (WT) SC5314 cells after 0.5 h, 2 h, or 4 h in 0.1% MUC5AC glycans (versus growth in medium alone). Gene expression was measured with qRT-PCR and normalized to a control gene (ACT1). Bars indicate the mean ± SEM from n= 5 (0.5 h, 2 h), n=4 (4 h) biologically independent replicates. d) Loss of NRG1 or TUP1 leads to hyperfilamentation in the presence or absence of mucin glycans. Phase-contrast images of cells of the indicated genotype were grown in the presence or absence of MUC5AC glycans in RPMI medium at 37 °C for 4 h. Scale bar, 20 μm. e) FC values for gene-expression changes in WT SC5314 or Δ/Δnrg1 mutant cells after 2 h in MUC5AC glycans (versus growth in medium alone). Complete lists of FC values and FDR-adjusted P values from n=2 biologically independent replicates are provided in Supplementary Data 5 and 6. P values were determined using a two-tailed Wald test and FDR-adjusted (P<0.05) using Benjamini–Hochberg correction for multiple comparisons. f) Expression of filamentation-associated genes in WT SC5314 or Δ/Δnrg1 mutant cells after 2 h in MUC5AC glycans (versus growth in medium alone). Gene expression was measured with qRT-PCR and normalized to a control gene (ACT1). Bars indicate the mean ± SEM from n= 5 (WT), n=3 (ΔΔnrg1) biologically independent replicates.
Figure 4
Figure 4. Mucin glycans downregulate virulence cascades and mediate fungal-bacterial dynamics
a) Mucin glycans downregulate the expression of adhesion-related genes. Gene expression was measured by qRT-PCR and normalized to a control gene (ACT1). Bars indicate mean ± SEM from n=11 (ECE1, ALS3), n=4 (HWP1) biologically independent replicates. MS, monosaccharide. b) Fluorescence microscopy images assaying adhesion of wild-type (WT) C. albicans expressing green fluorescent protein (GFP) at 90 min in the presence or absence of MUC5AC glycans. Scale bar, 50 μm. c) Quantification of adhesion to polystyrene wells using fluorescence images from n=9 (MS pool, MUC5AC glycans), n=6 (Medium) biologically independent replicates. Bars indicate mean ± SEM. Significance was assessed using ordinary one-way ANOVA followed by Bonferroni multiple comparisons test; ****P<0.0001. d) Phase-contrast images of (left, middle) biofilm and (right) planktonic WT cells grown for 24 h in the (left) absence or (middle, right) presence of MUC5AC glycans. Non-adhered (planktonic) cells in the MUC5AC glycan-exposed biofilms were imaged (right). Scale bar, 20 μm. e) Quantification of CFUs in the supernatant (planktonic cells) relative to total CFU from adhered cells in the biofilm from n=9 (Medium, MUC5AC glycans) and n=5 (MS pool) biologically independent replicates. Significance was assessed using Brown-Forsythe and Welch ANOVA tests (assumes unequal variance) followed by Dunnett T3 multiple comparisons test; ***P=0.0002. f) Schematics of in vitro P. aeruginosa (bacteria) and C. albicans (yeast) interactions. Left: P. aeruginosa does not effectively kill yeast form C. albicans. Right: In contrast, P. aeruginosa adheres to C. albicans hyphae and secretes toxins, leading to fungal death. g) C. albicans yeast cells were diluted into RPMI medium with or without MUC5AC glycans for 4 h. P. aeruginosa cells (OD600=0.25) in spent LB were added to the C. albicans cells with or without MUC5AC glycans and cocultured at 37 °C for 72 h. The fungal viable cell population was determined daily by plating. *P=0.04 (48 h); *P=0.014 (72 h). h) Cultures of Δ/Δnrg1 cells were treated as in (g) with or without MUC5AC glycans and cocultured with P. aeruginosa at 37 °C for 72 h. For g,h, Data are mean ± SEM from n=5 biologically independent replicates. Significance was assessed using two-tailed Student’s t-tests with Welch’s correction.
Figure 5
Figure 5. Native mucins across microbial niches display a plethora of complex glycan structures with regulatory potential
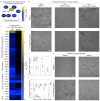
a) Wild-type C. albicans SC5314 cells were diluted into RPMI medium with or without mucin glycan libraries purified from MUC5AC, MUC2, and MUC5B and cultured at 37 °C for 8 h. Phase-contrast images of C. albicans revealed that mucin glycans across three mucin types suppress filamentation. Scale bar, 20 μm. b) Heatmap presenting log10 values for the relative abundances of individual glycans released from the three mucins and detected by NSI-MS as permethylated derivatives (Supplementary Table 3). MUC2, MUC5B, and MUC5AC are dominated by O-GalNAc Core 1 (glycans #3, 4, 5) and Core 2 derived glycan structures (glycans #15, 16, 17). Glycans #81, 82, and 83 represent non-reducing terminal disaccharides of incomplete core structures likely generated through peeling reactions during preparation. c) Distribution of O-glycans by GalNAc-initiated core type on each mucin. Minimal core structures are shown in the legend. The relative abundances of each glycan containing a minimal core structure was summed for comparison. d) The relative abundances of glycans carrying capping/branching fucose or sialic acid residues were summed for comparison across the three mucins. Glycans with between 0 and 4 fucose residues or between 0 and 2 sialic acid residues were detected. The relative abundances of sialylated and fucosylated glycans was calculated based on the total glycan profile, while the relative abundances of glycans lacking sialic acid or fucose was calculated based on the subset of glycans in the total profile that are structurally amenable to sialylation or fucosylation. e) The relative abundances of glycans that possess the indicated structural features or motifs were summed for comparison across the three mucins. Abbreviations for the features are as previously described (Fig. 2). The Lewis designation refers to the detection of a fucosylated LacNAc residue. f) The relative abundance of the six most prevalent Core 1 and Core 2 glycans shared across all three mucins is presented. These mucin-derived glycans defined structures that served as synthetic targets for generating lead compounds for subsequent functional analysis (Fig. 6).
Figure 6
Figure 6. Synthetic Core 1- and Core 2-modified glycans are sufficient to suppress C. albicans filamentation
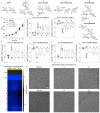
a) Depiction of synthesized mucin glycan structures (1-6) that are abundant in the complex mucin glycan pool. b) Growth is not altered by the presence of the Core 1 and Core 2 synthesized glycans. Data are the mean OD600 measurements ± SEM; n=5 biologically independent replicates. MS, monosaccharide pool. c) Exposure to low (L; 0.1% w/v) and high (H; 0.4% w/v) concentrations of synthesized glycan structures (left) increase transcription of the yeast-associated gene YWP1 and (right) decreases transcription of the filamentation-associated toxin gene ECE1. Data from n=3 (0.1% MS, 1 and 2), n=4 (0.4% 2), n=6 (0.4% MS) and n=8 (0.1% MG, 0.4% 1) biologically independent replicates. d) Exposure to Core 1-modified glycan structures decreases the expression of the virulence-associated gene, ECE1, and increases the expression of the yeast-associated gene, YWP1. These results are dampened by the addition of sialic acid to Core 1. Data from n=6 (MG, 3), n=7 (4, 1) and n=9 (MS) biologically independent replicates. e) Exposure to Core 2-modified glycan structures decreases the expression of the virulence-associated gene, ECE1, and increases the expression of YWP1. Data from n=3 (5), n=4 (2), n=6 (6, MS) and n=8 (MG) biologically independent replicates. f) Expression of filamentation-associated genes in the presence of MS, MG, and synthesized Core 1- and Core 2-modified glycan structures. Data indicates the mean from n=3 (6), n=4 (3, 5), n=6 (2) and n=7 (MS, MG, 1, 4) biologically independent replicates. g) Phase-contrast images of C. albicans SC5314 cells that were grown in RPMI medium alone, 0.4% monosaccharide (MS) pool or the indicated synthetic glycan structure (0.4%) at 37 °C for 8 h. Scale bar, 20 μm. For c,d,e,f gene expression was measured with qRT-PCR and normalized to a control gene (ACT1). Bars indicate mean ± SEM. MS, black circles; MG, mucin glycans; FC, fold change.

Comment in

  • Mucin modulates microbial morphogenesis.
    Sharma J, Shapiro RS. Sharma J, et al. Nat Chem Biol. 2022 Jul;18(7):684-686. doi: 10.1038/s41589-022-01053-z. Nat Chem Biol. 2022. PMID: 35668190 No abstract available.

References

    1. Ganguly S, Mitchell AP. Mucosal biofilms of Candida albicans. Curr Opin Microbiol. 2011;14:380–385. - PMC - PubMed
    1. Valle Arevalo A, Nobile CJ. Interactions of microorganisms with host mucins: a focus on Candida albicans. FEMS microbiology reviews. 2020;44:645–654. - PMC - PubMed
    1. Pappas PG, Lionakis MS, Arendrup MC, Ostrosky-Zeichner L, Kullberg BJ. Invasive candidiasis. Nat Rev Dis Primers. 2018;4:1–20. - PubMed
    1. Perlin DS. Antifungals: From Genomics to Resistance and the Development of Novel Agents. Clinical Infectious Diseases. 2015;61:1213–1214.
    1. Calderone RA, Fonzi WA. Virulence factors of Candida albicans. Trends in Microbiology. 2001;9:327–335. - PubMed

Publication types