. 2022 Jun;54(6):827-836.
doi: 10.1038/s41588-022-01087-y. Epub 2022 Jun 6.

Combining SNP-to-gene linking strategies to identify disease genes and assess disease omnigenicity

Affiliations

Combining SNP-to-gene linking strategies to identify disease genes and assess disease omnigenicity

Steven Gazal et al. Nat Genet. 2022 Jun.

Abstract

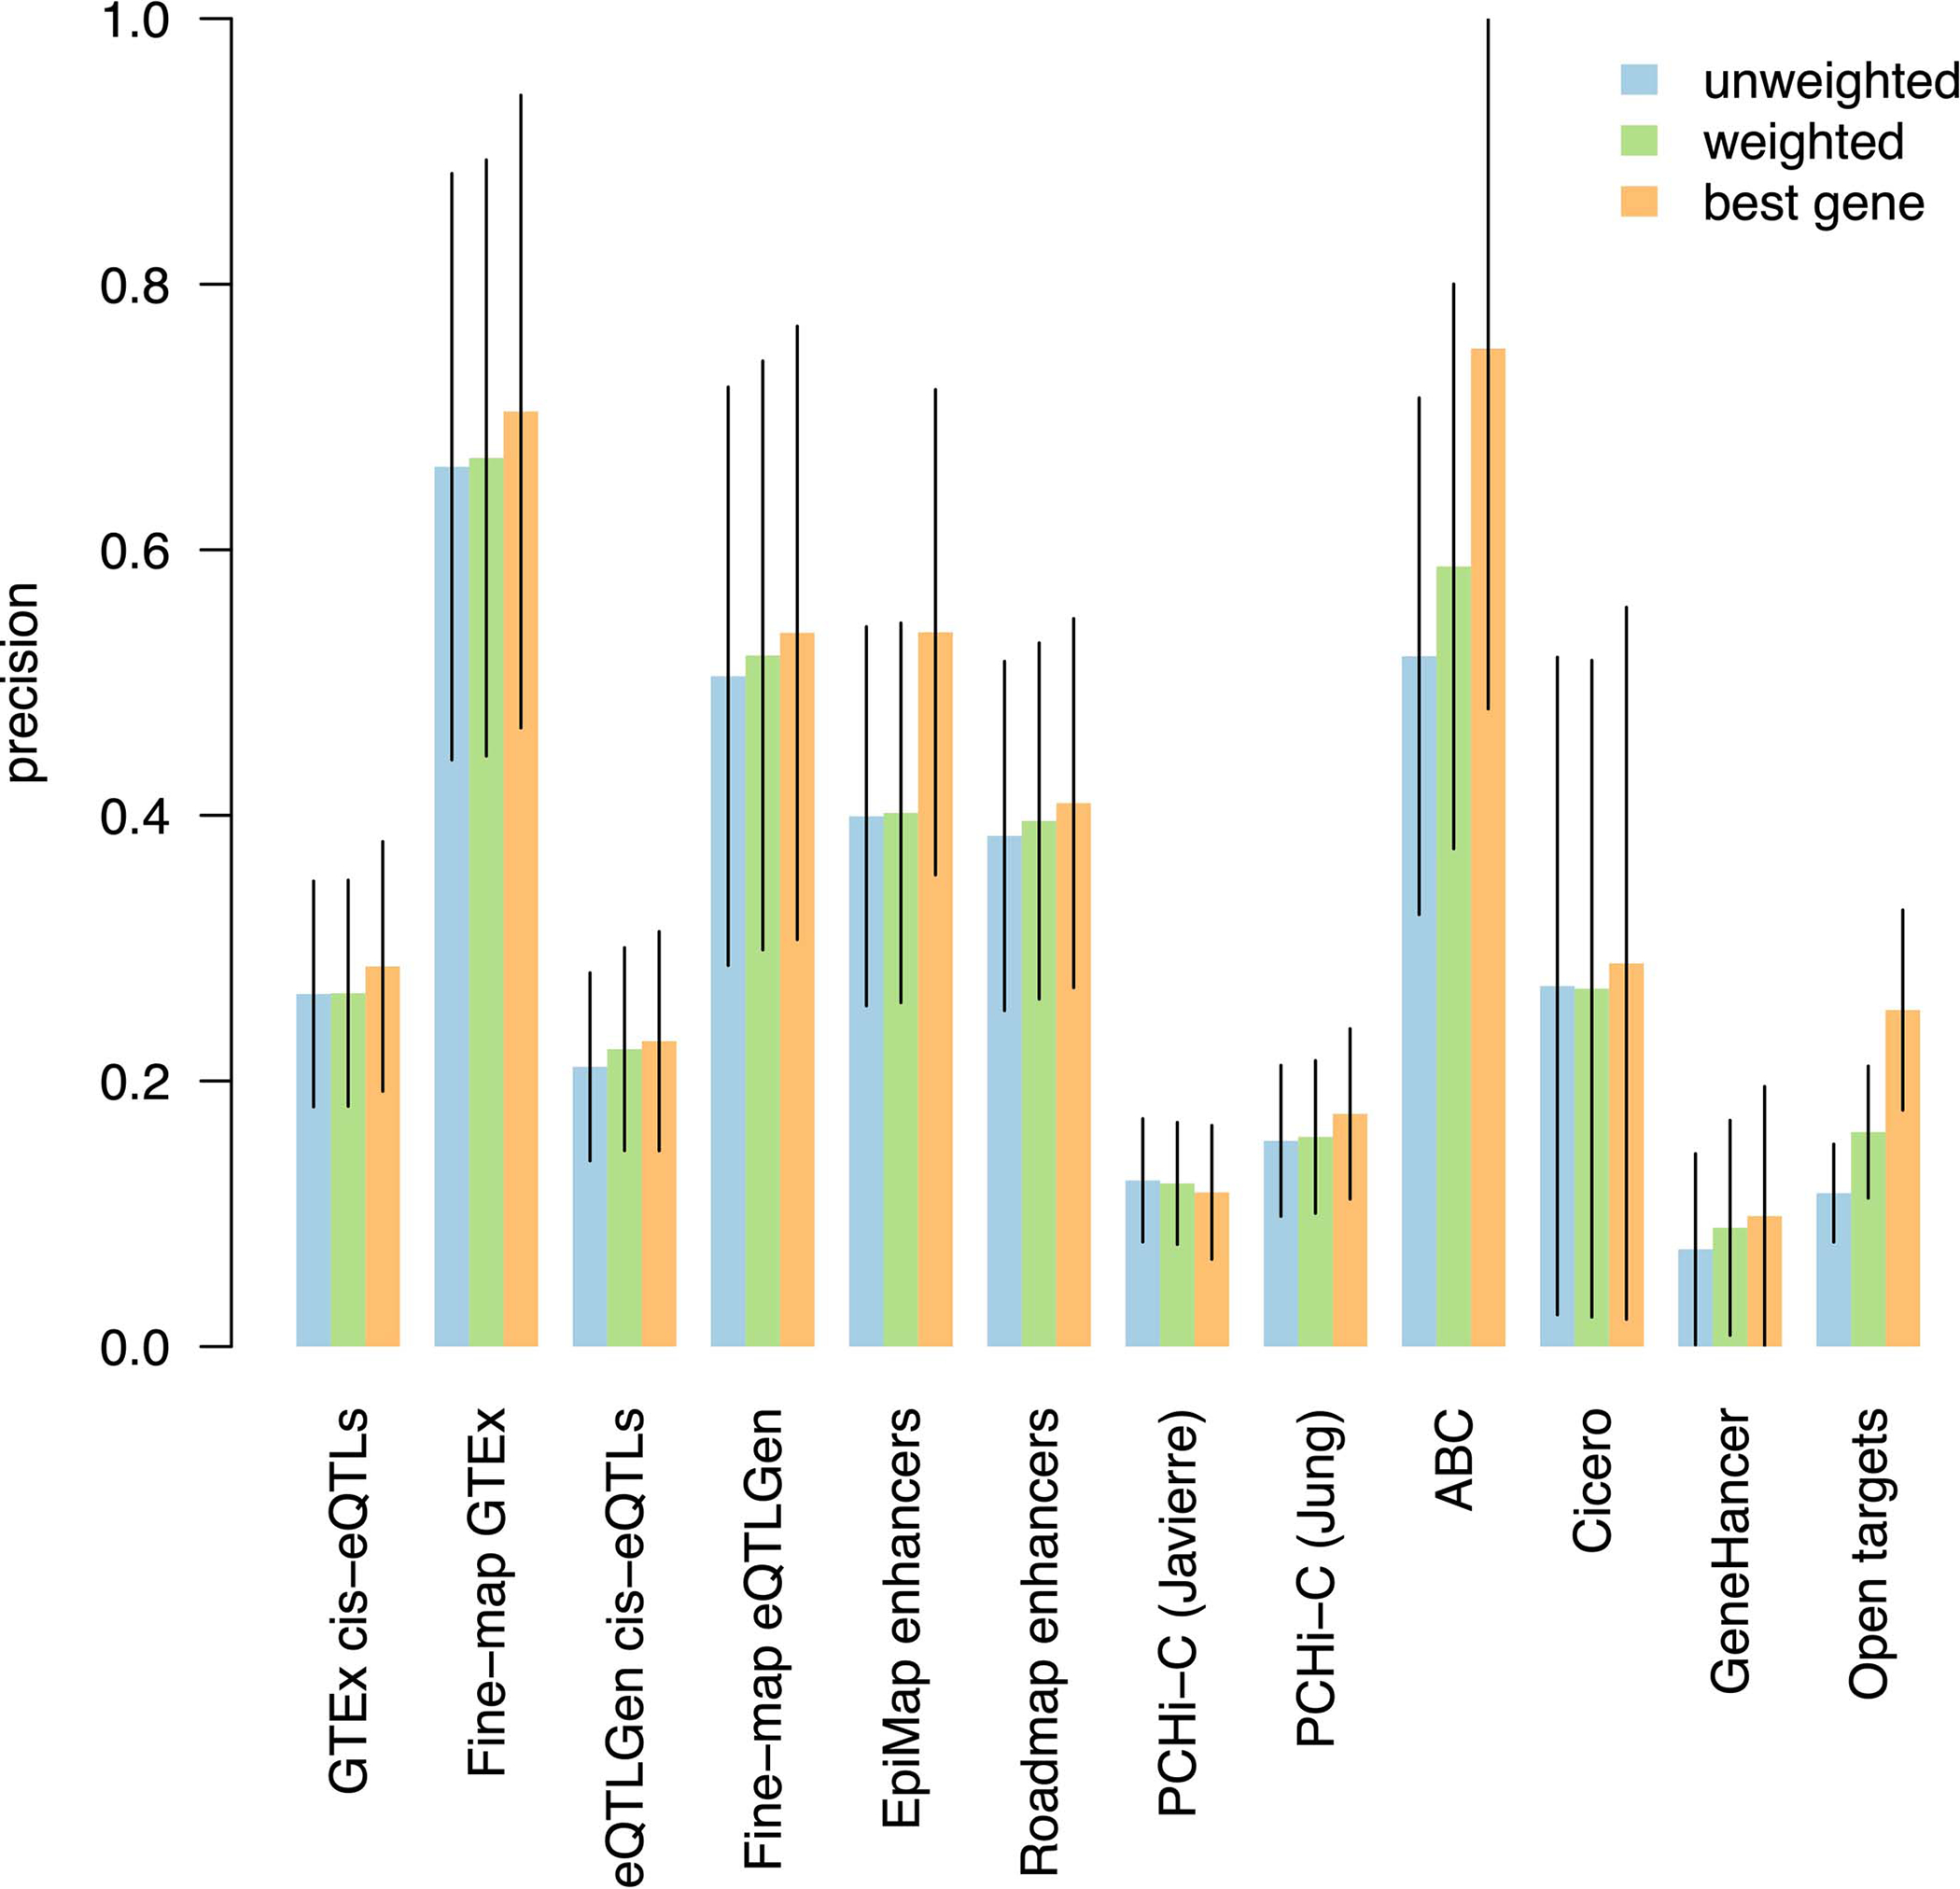
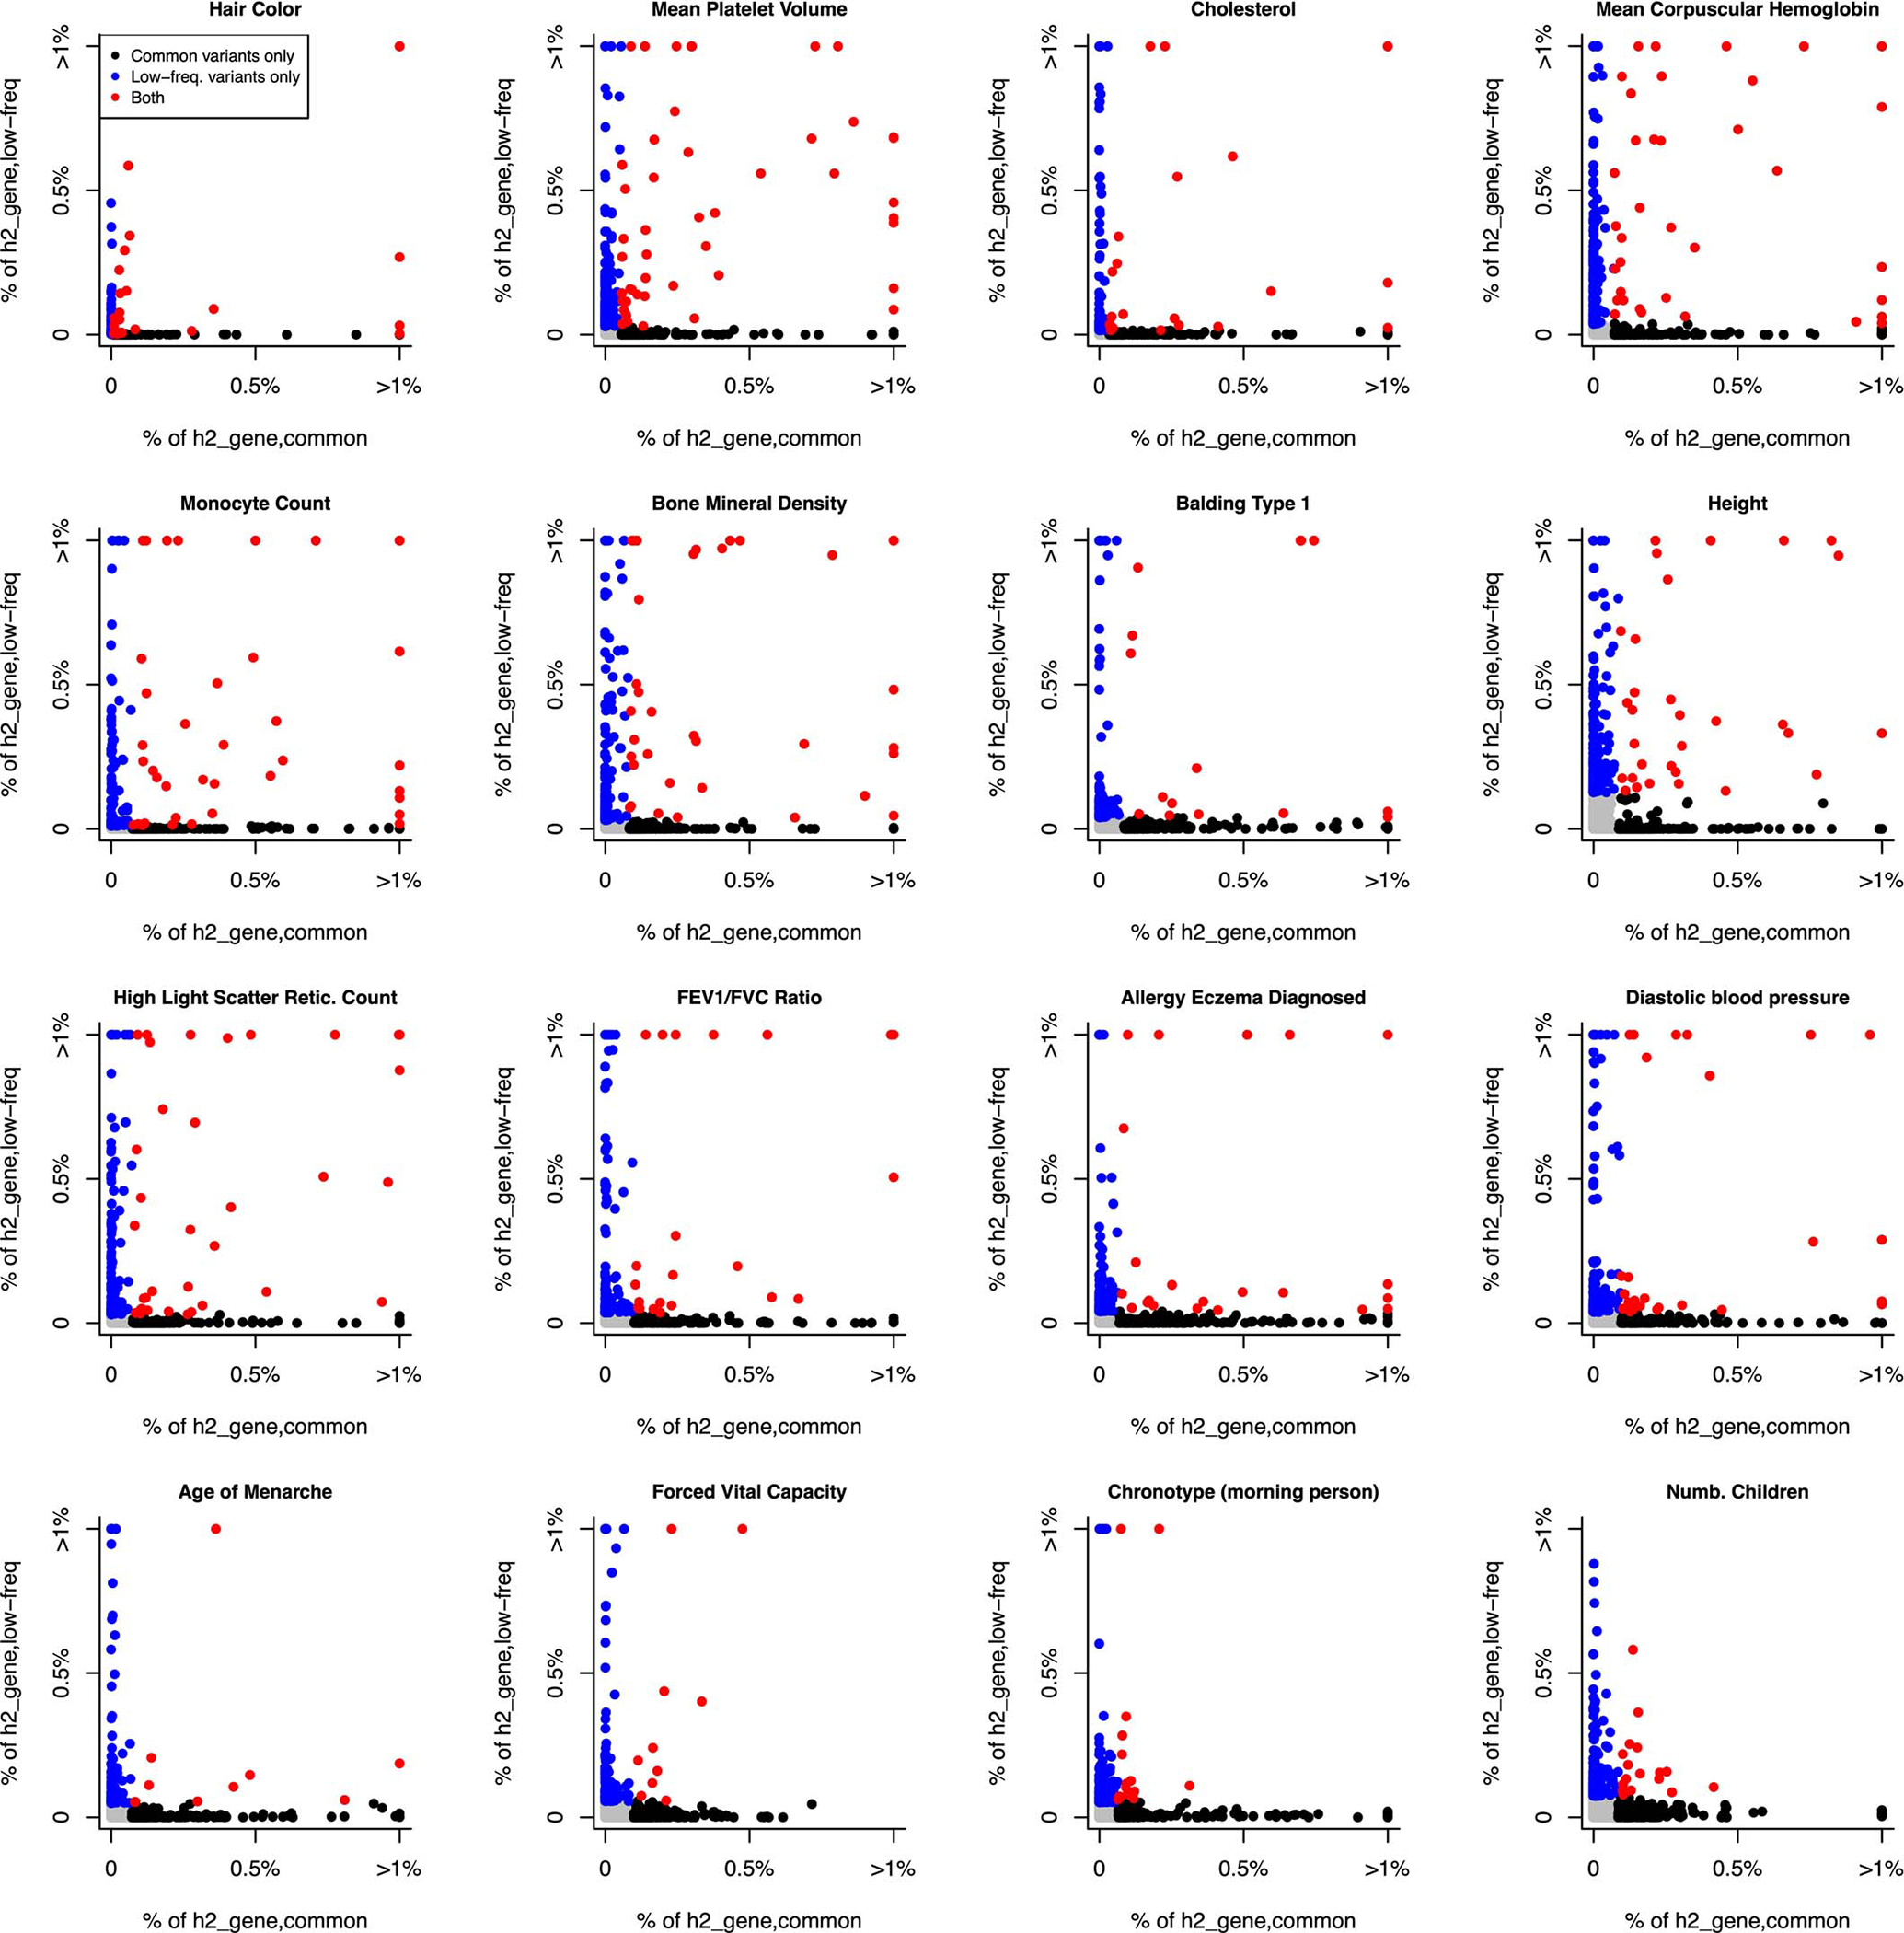
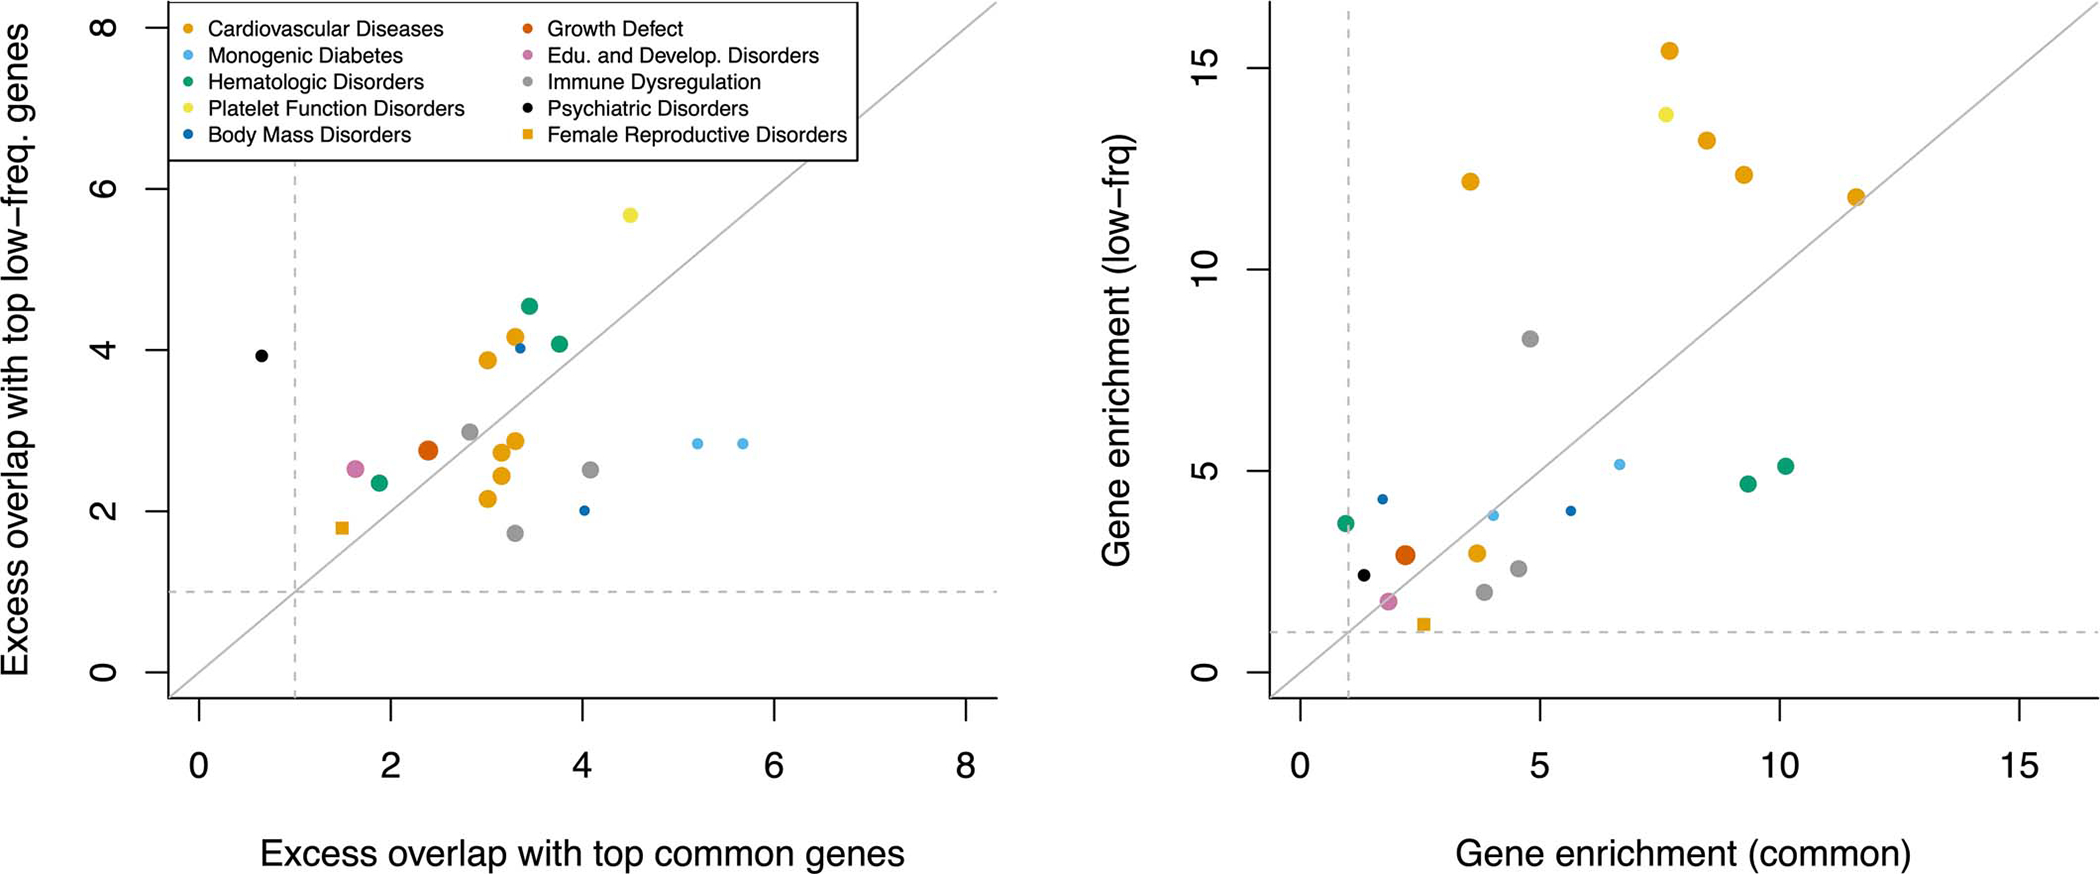
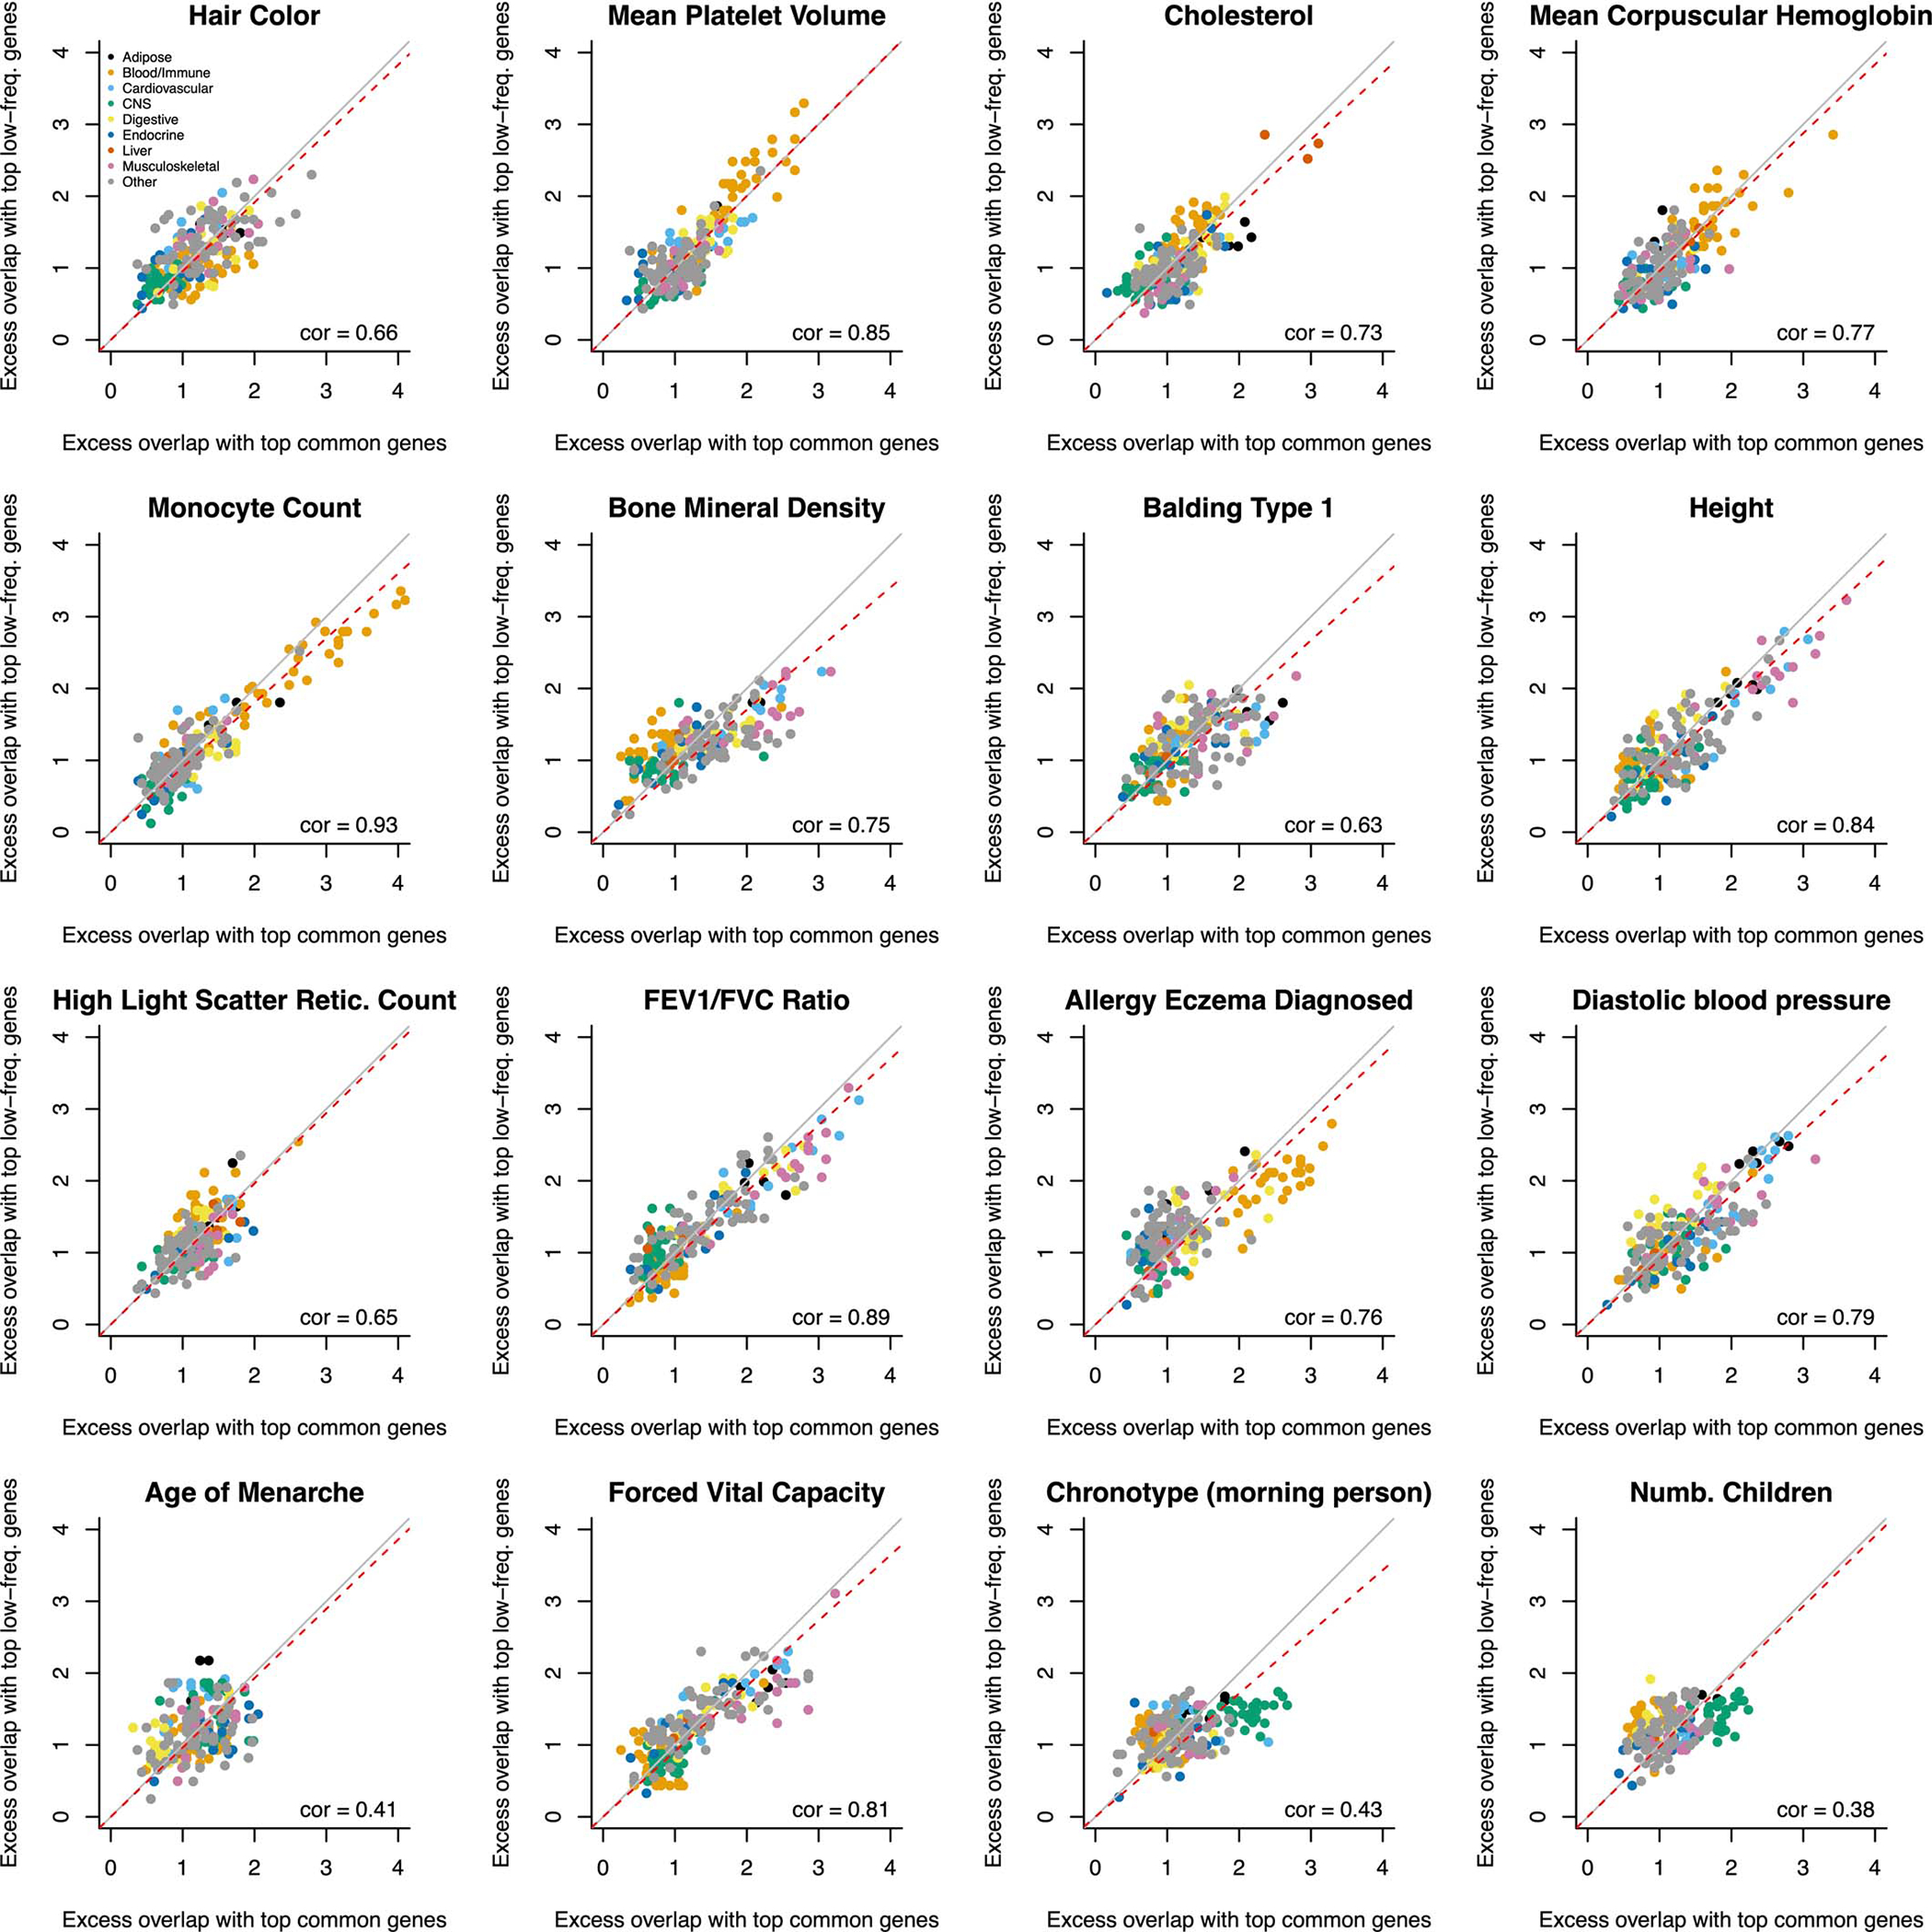
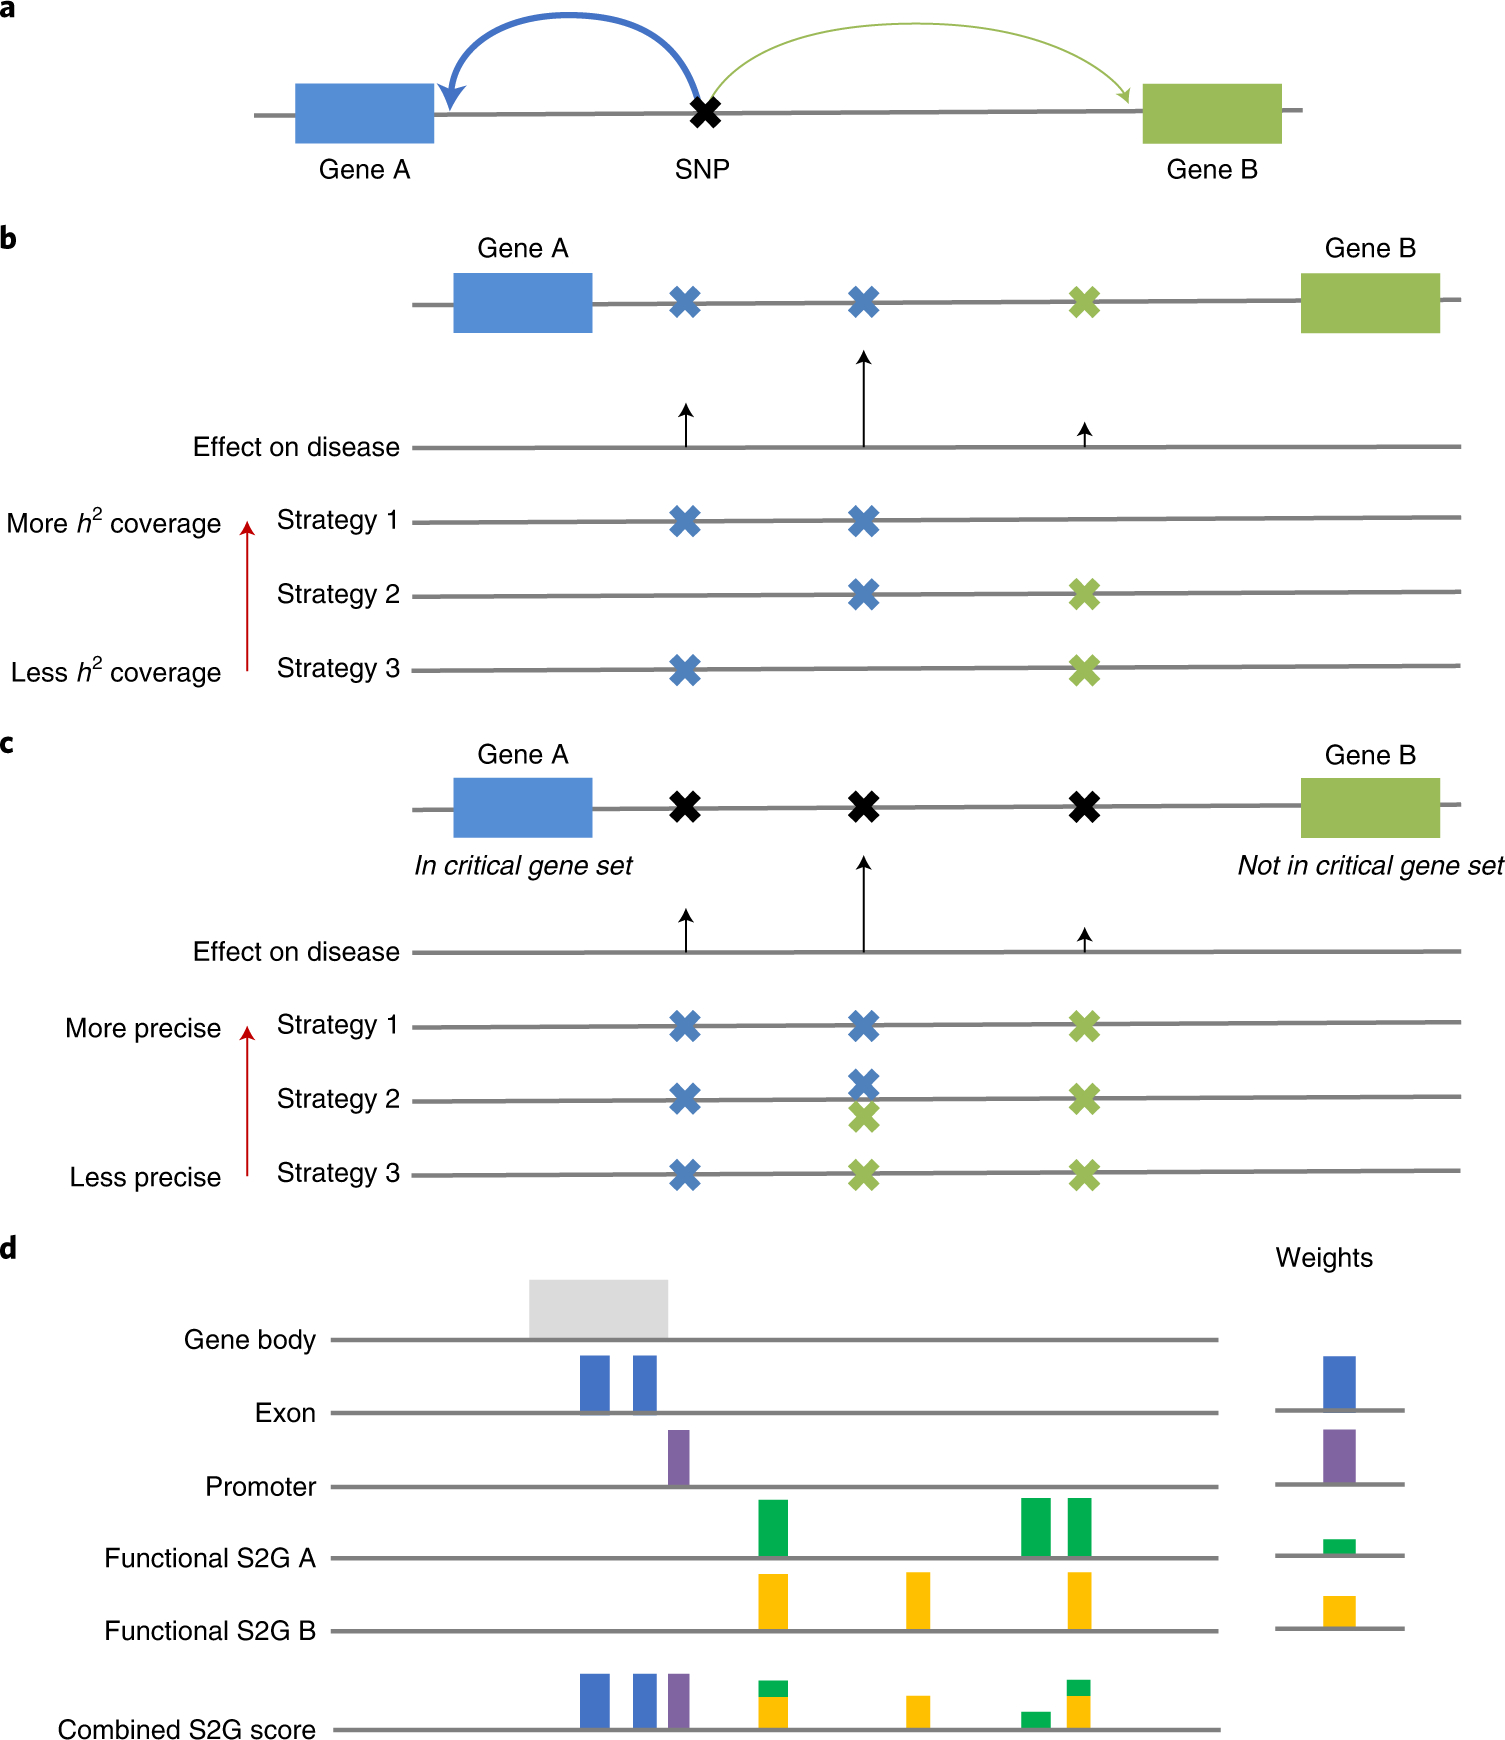
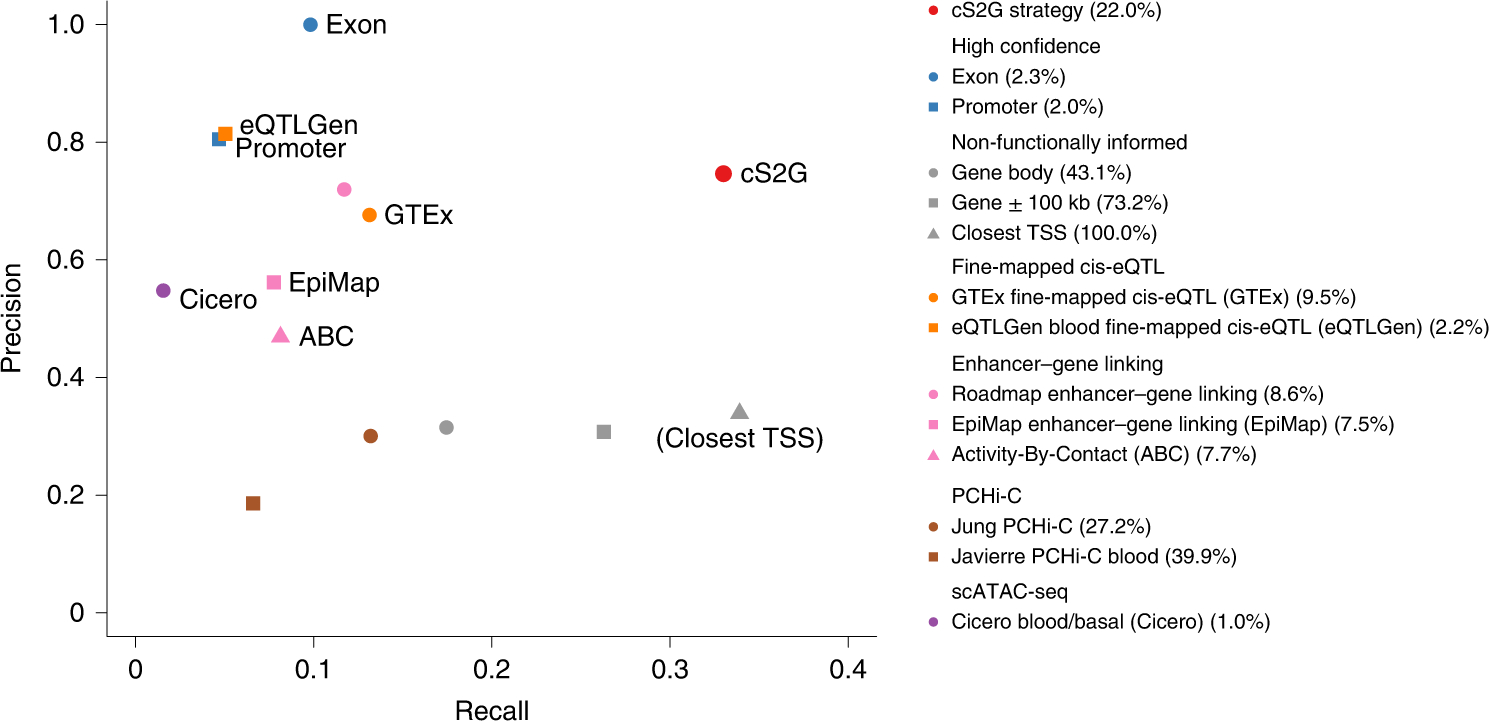
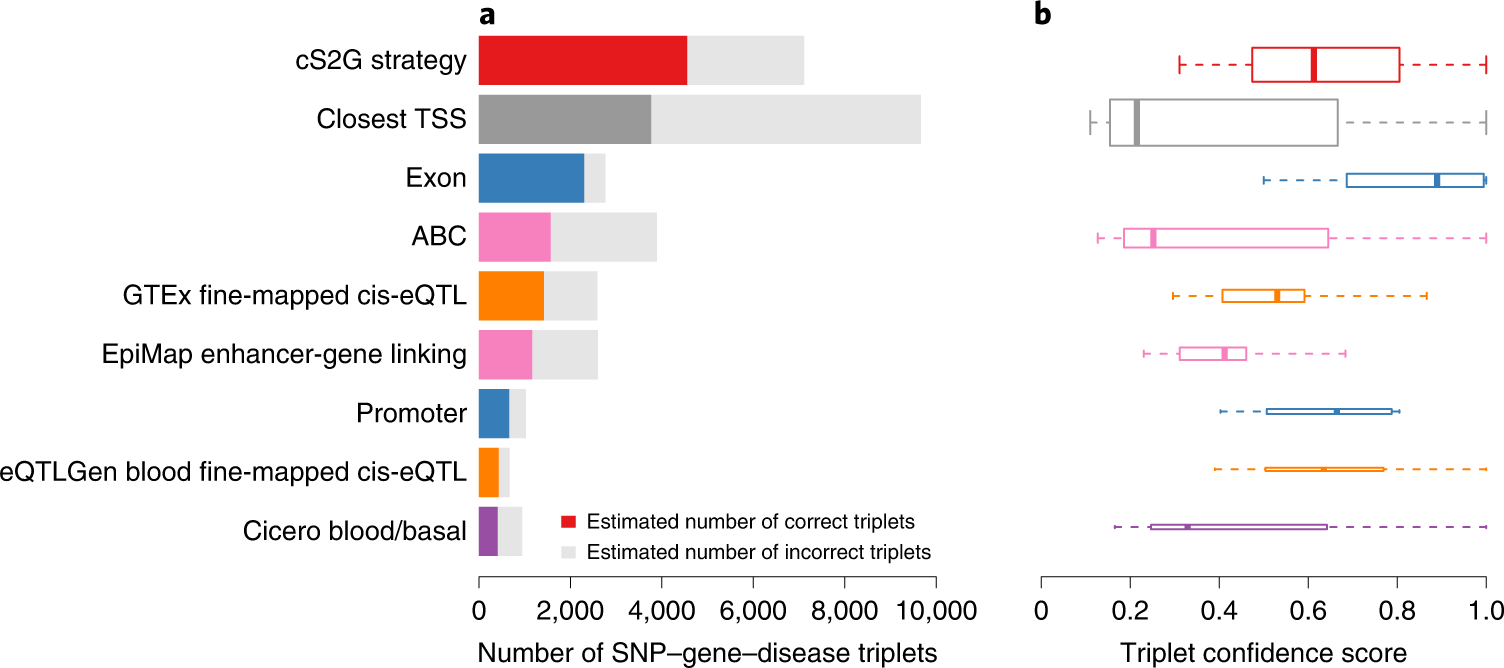
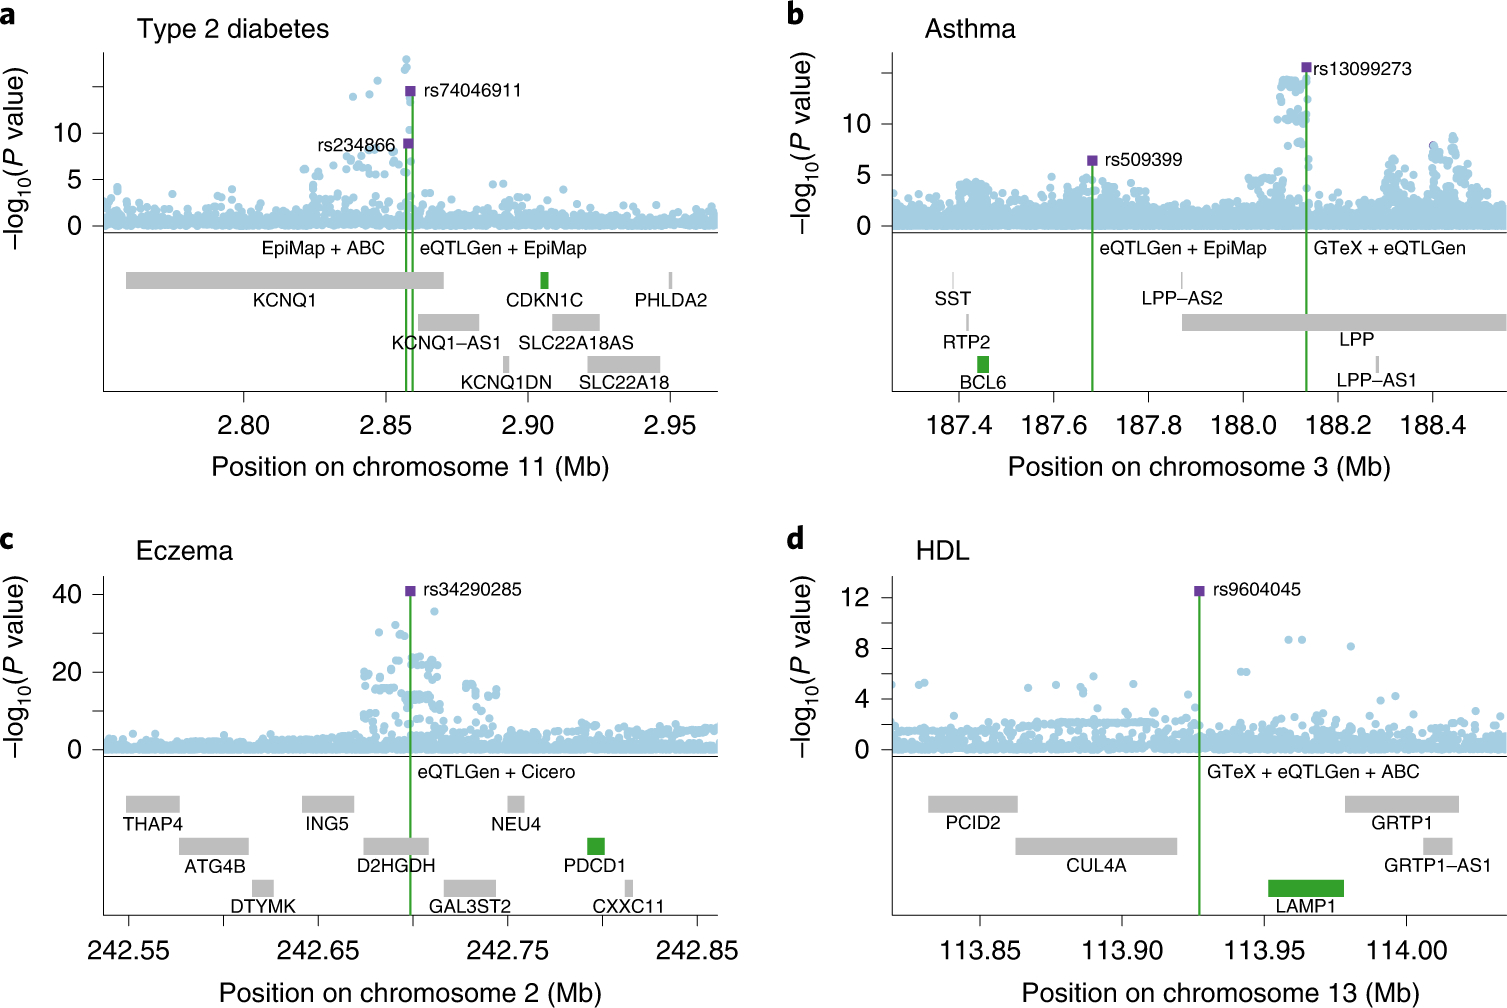
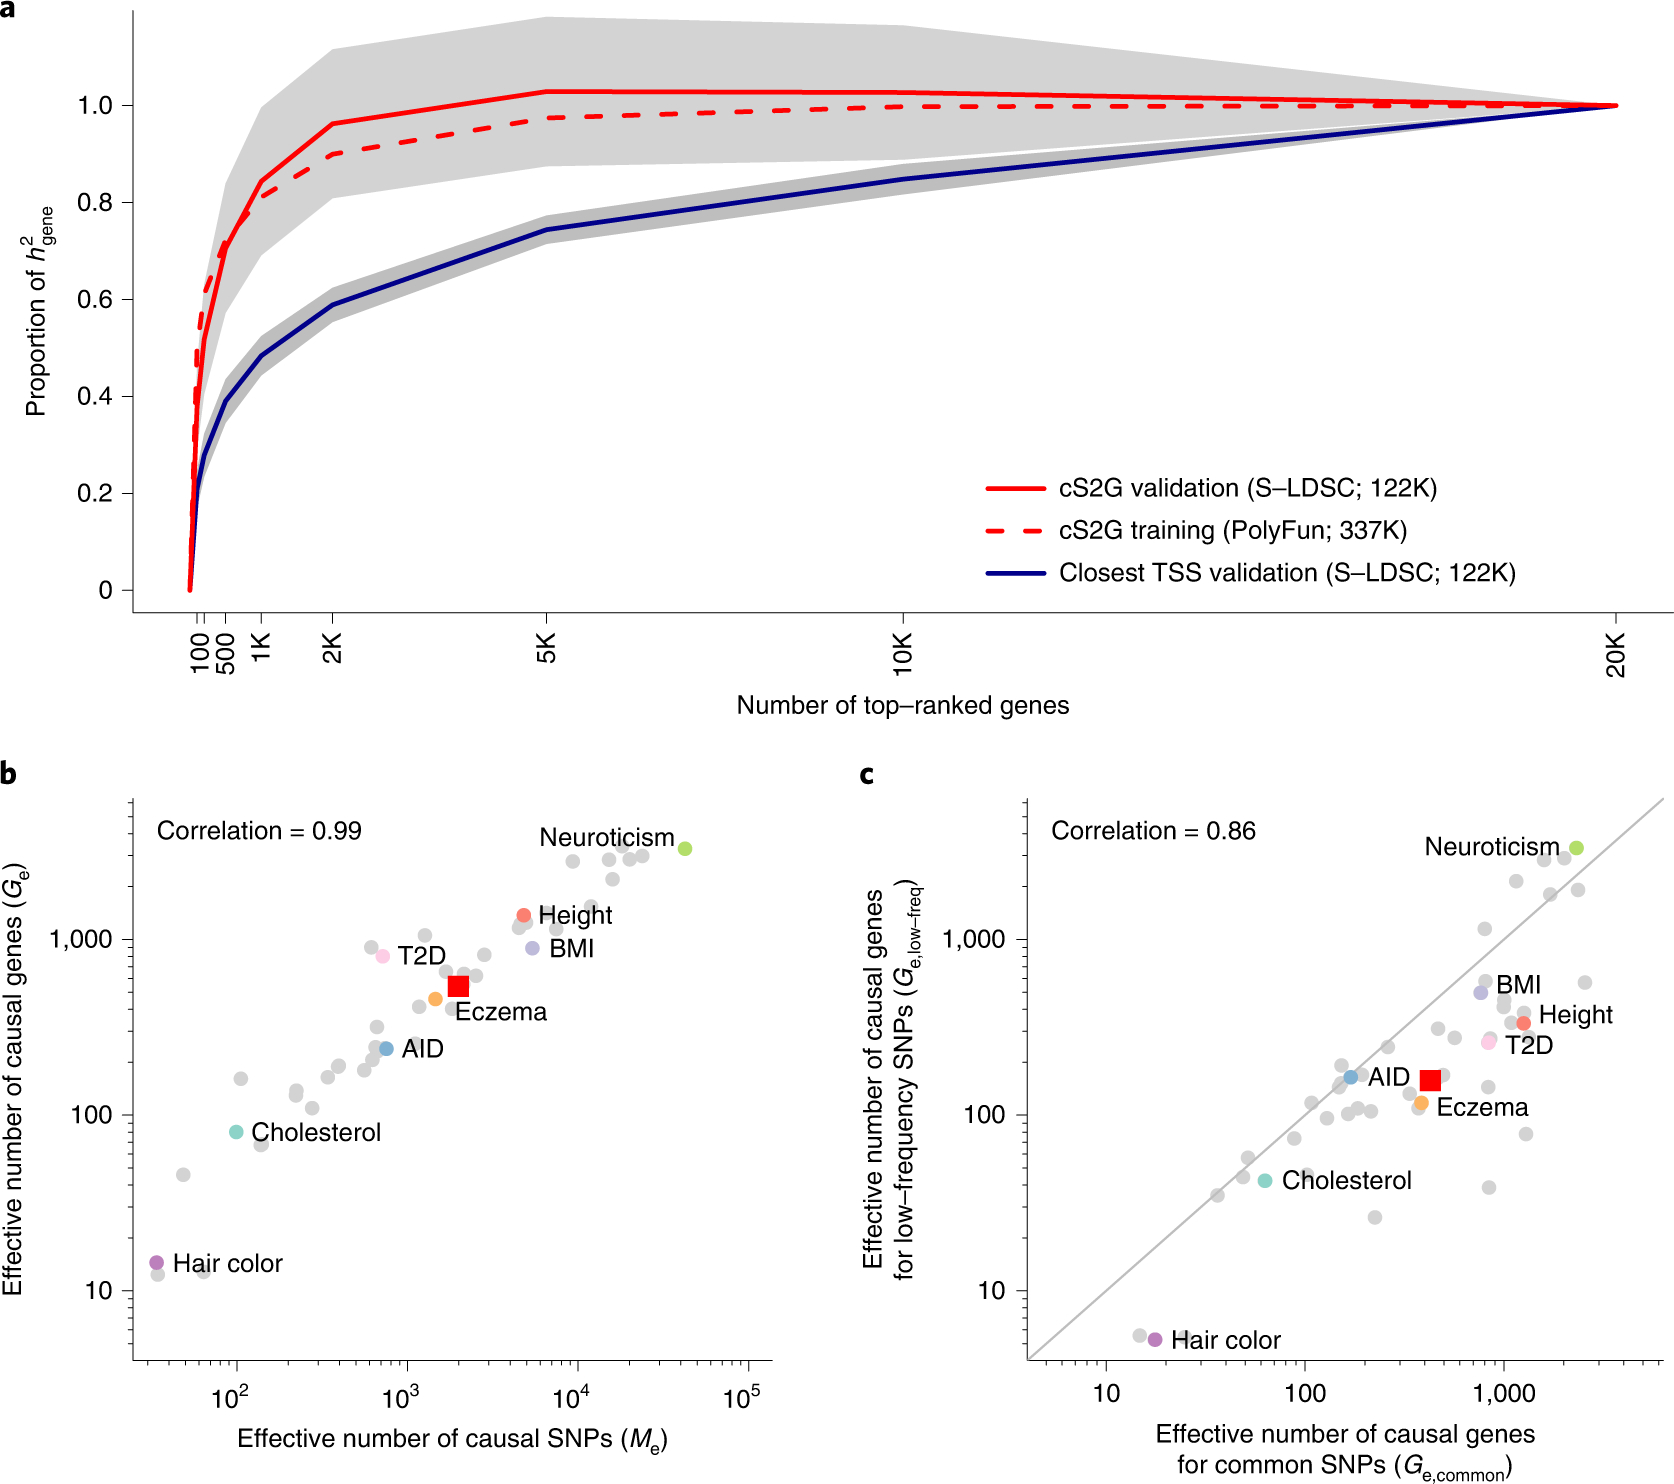
Disease-associated single-nucleotide polymorphisms (SNPs) generally do not implicate target genes, as most disease SNPs are regulatory. Many SNP-to-gene (S2G) linking strategies have been developed to link regulatory SNPs to the genes that they regulate in cis. Here, we developed a heritability-based framework for evaluating and combining different S2G strategies to optimize their informativeness for common disease risk. Our optimal combined S2G strategy (cS2G) included seven constituent S2G strategies and achieved a precision of 0.75 and a recall of 0.33, more than doubling the recall of any individual strategy. We applied cS2G to fine-mapping results for 49 UK Biobank diseases/traits to predict 5,095 causal SNP-gene-disease triplets (with S2G-derived functional interpretation) with high confidence. We further applied cS2G to provide an empirical assessment of disease omnigenicity; we determined that the top 1% of genes explained roughly half of the SNP heritability linked to all genes and that gene-level architectures vary with variant allele frequency.


Conflict of interest statement

Competing Interests Statement

C.P.F. is now an employee of Bristol Myers Squibb. The remaining authors declare no competing interests.

Figures

Extended Data Figure 1:
Extended Data Figure 1:. S2G strategy linking each SNP to best gene leads to higher precision than linking SNPs to multiple target genes.
We report the precision of S2G strategies linking SNPs to target genes using three difference approaches for converting raw linking values into linking scores: by assigning to each gene with non-zero raw linking value the same linking score (unweighted), by assigning to each gene a linking score proportional to its raw linking value (weighted), and by retaining only the gene(s) with the highest linking score (best gene). Values were estimated using non-trait-specific training critical gene set and meta-analyzed across 63 independent traits. Error bars represent 95% confidence intervals around meta-analyzed values. For most of the S2G strategies the precision was very similar (except for EpiMap, ABC and Open Targets), but the precision was generally highest for the “best gene” strategy. However, we note that this choice does not reflect biological reality, in which a regulatory element may target more than one gene, and that refinements to this choice are a direction for future research.
Extended Data Figure 2:
Extended Data Figure 2:. Precision of 27 S2G strategies based on physical distance to TSS.
We report precision of the closest TSS strategy as a function of the distance between a SNP and its closest TSS (a) (numbers between parentheses represent the fraction of common SNPs linked by the strategy), and the precision of the ith closest TSS (each strategy links 100% of the SNPs) (b). Values were estimated using trait-specific validation critical gene sets and meta-analyzed across 63 independent traits. Error bars represent 95% confidence intervals around meta-analyzed values. The mean value of 0.043 for 6th-20th closest TSS suggests that genes located relatively close to causal disease genes have a slightly elevated probability of being causal. Numerical results including values of recall and corresponding standard errors are reported in Supplementary Table 5.
Extended Data Figure 3:
Extended Data Figure 3:. Precision of functional S2G strategies using all available cell-types and tissues or restricted to blood and immune cell-types and tissues.
We report the precisions of functional S2G strategies built using either all available cell-types and tissues (All CT; in light color) and/or blood and immune cell-types and tissues (Blood CT; in dark color) meta-analyzed across 63 independent traits (All traits; in blue) and 11 blood cell traits and autoimmune diseases (Blood traits; in red) (UK Biobank all auto-immune diseases, Crohn’s Disease, Rheumatoid Arthritis, Ulcerative Colitis, Lupus, Celiac, Platelet Count, Red Blood Cell Count, Red Blood Cell Distribution Width, Eosinophil Count, White Blood Cell Count; see Supplementary Table 3). Error bars represent 95% confidence intervals around meta-analyzed values. We considered 5 S2G strategies with data available for cell-types and tissues: GTEx cis-eQTLs (GTEx), GTEx fine-mapped cis-eQTL (GTEx fine-mapped), Roadmap enhancer-gene linking (Roadmap), EpiMap enhancer-gene linking (EpiMap), and Activity-By-Contact (ABC). We considered 3 S2G strategies with data available only for blood and immune cell-types and tissues: eQTLGen fine-mapped blood cis-eQTL (eQTLGen fine-mapped), PCHi-C (blood), and Cicero blood/basal (Cicero). We observed 1) that S2G strategies using data from all cell-types and tissues were more precise than S2G strategies restricted to blood and immune cell-types and tissues in both analyses of all traits (light blue vs. dark blue) and blood cell traits and autoimmune diseases (light red vs. dark red), and 2) that S2G strategies using data from blood and immune cell-types and tissues are more precise in all traits than in blood cell traits and autoimmune diseases (dark blue vs. dark red).
Extended Data Figure 4:
Extended Data Figure 4:. Proportion of common and low-frequency variant heritability linked to genes explained by each individual gene.
We report the proportion of common and low-frequency variant heritability linked to genes (h2gene,common and h2gene,low-freq, respectively) explained by each individual gene in 16 independent UK Biobank traits. Genes in the top 200 genes (top 1% of all genes) contributing to both h2gene,common and h2gene,low-freq are denoted in red (median of 26 genes across the 16 traits), genes in the top 200 genes contributing to only h2gene,common (resp. h2gene,low-freq) are colored in black (resp. blue) (median of 174 genes each), and remaining genes are colored in grey (median of 19,621 genes, with values close to 0 on both axes). We observe low concordance between per-gene contributions to gene architectures for common vs. low-frequency SNPs.
Extended Data Figure 5:
Extended Data Figure 5:. Excess overlap between top genes contributing to common and low-frequency variant heritability linked to genes and disease-specific Mendelian disorder genes.
We report the excess overlap between phenotype-specific Mendelian disorder genes and the top 200 genes contributing to common and low-frequency variant heritability linked to genes (left), and the gene enrichment of disease-specific Mendelian disorder genes (i.e. [SNP-heritability linked to Mendelian disorder genes / SNP-heritability linked to all genes] / [number of Mendelian disorder genes / total number of genes]) across common and low-frequency variants (right). Each dot represents a disease/trait - Mendelian disorder gene set pair, and is colored by the Mendelian disorder gene set. These two results suggest that both the set of top 200 genes and the per-gene heritability estimates are unlikely to be driven by noisy estimates arising from finite sample size. We restricted analyses to 21 traits analyzed in ref. .
Extended Data Figure 6:
Extended Data Figure 6:. Excess overlap between top genes contributing to common and low-frequency variant heritability linked to genes and differentially expressed gene sets.
We report the excess overlap between 205 differentially expressed gene sets and the top 200 genes contributing to common and low-frequency variants heritability linked to genes across 16 independent UK Biobank traits. Each dot represents a differentially expressed gene set, and is colored by the tissue category. We generally observed excess overlap for disease-critical tissues/cell types. We observed high correlations between excess overlaps for common vs. low-frequency variant architectures, suggesting that common and low-frequency variants architectures are driven by different genes pertaining to similar biological processes.
Figure 1:
Figure 1:. Overview of S2G framework.
(a) Toy example of SNP linked to two genes (arrow widths denote linking scores). (b) Toy example of h2 coverage. Strategy 1 (which links SNPs with larger effects on disease) has more h2 coverage than strategy 2, which has more h2 coverage than strategy 3 (which links SNPs with smaller effects on disease). (c) Toy example of using critical gene sets to define precision. Strategy 1 (which links the middle SNP with high effect on disease to the gene from the critical gene set) is more precise than strategy 2 (which links the middle SNP to both genes), which is more precise than strategy 3 (which links the middle SNP to the gene that is not from the critical gene set). Recall is defined as the product of the h2 coverage and precision. (d) Toy example of combined S2G strategy. The combined S2G strategy is a linear combination of constituent S2G strategies.
Figure 2:
Figure 2:. Accuracy of individual S2G strategies and combined S2G (cS2G) strategy.
We report the precision and recall of the 13 main S2G strategies from Table 1 and the cS2G strategy (estimated using trait-specific validation critical gene sets and meta-analyzed across 63 independent traits). Colored font denotes the cS2G strategy and its 7 constituent S2G strategies (gray font in parentheses denotes the Closest TSS strategy). Numbers in parentheses in legend denotes the proportion of common SNPs that are linked to at least one gene (as in Table 1). We note that our evaluation of these S2G strategies is impacted by their widely varying underlying biosample sizes (see Methods), in addition to differences in functional assays and SNP-to-gene linking methods. Standard errors are reported in Supplementary Figure 2, and numerical results are reported in Supplementary Table 5; standard errors for all S2G strategies linking >2.5% of common SNPs were ≤0.12 for precision and ≤0.03 for recall, with smaller standard errors for S2G strategies linking larger proportions of common SNPs.
Figure 3:
Figure 3:. SNP-gene-disease triplets identified by cS2G and other S2G strategies.
(a) We report the number of SNP-gene-disease triplets identified by cS2G, its 7 constituent strategies, and the Closest TSS S2G strategy. For each strategy, we estimated the number of correct triplets based on the mean confidence score across triplets; the estimated number of correct triplets is denoted as a colored bar, and the estimated number of incorrect triplets is denoted as a grey bar. (b) We report the distribution of confidence scores of SNP-gene-disease triplets for each S2G strategy. The median value of confident scores is displayed as a band inside each box; boxes denote values in the second and third quartiles; the length of each whisker is 1.5 times the interquartile range, defined as the width of each box; the height of each box is proportional to the total number of triplets linked by each strategy (7,111, 9,664, 2,763, 3,889, 2,589, 2,604, 1,029, 674 and 943 for the 9 plotted S2G strategies). The list of SNP-gene-disease triplets predicted by cS2G is reported in Supplementary Table 17. Numerical results are reported in Supplementary Table 18.
Figure 4:
Figure 4:. Examples of high-confidence SNP-gene-disease triplets identified by cS2G.
We report four examples where cS2G predicts target genes for distal regulatory fine-mapped SNPs (i.e. not in promoter or gene body) for (a) type 2 diabetes, (b) asthma, (c) eczema, and (d) high-density lipoprotein (HDL) cholesterol. We plot the −log10 GWAS P values of each SNP (top) and the gene body of the genes in the locus (bottom). Fine-mapped SNPs are denoted as purple squares, target genes are denoted in green, and constituent S2G strategies implicating the target gene are denoted in purple. All fine-mapped SNPs in these examples have posterior inclusion probability (PIP) >0.9 for the corresponding disease/trait, except rs13099273 for asthma (PIP=0.58). S2G links for all 13 main S2G strategies are reported in Supplementary Table 17, and tissues/cell-types for constituent strategies of cS2G are reported in Supplementary Table 20. GTEx: GTEx fine-mapped cis-eQTL; eQTLGen: eQTLGen blood fine-mapped cis-eQTL; EpiMap: EpiMap enhancer-gene linking; ABC: Activity-By-Contact; Cicero: Cicero blood/basal.
Figure 5:
Figure 5:. Empirical assessment of disease omnigenicity using cS2G.
(a) We report the proportion of SNP-heritability linked to genes (h2gene) explained by genes ranked by top per-gene h2, as inferred using three approaches (see text). Grey shading denotes 95% confidence intervals for cS2G-validation and Closest TSS-validation around meta-analyzed values. We forced the s.e. of the proportion of h2gene explained by all genes to be 0 (see Methods). We note that values greater than 1 are outside the biologically plausible 0–1 range, but allowing point estimates outside the biologically plausible 0–1 range is necessary to ensure unbiasedness. Results were meta-analyzed across 16 independent UK Biobank traits. (b) We report the effective number of causal SNPs (Me) and the effective number of causal genes (Ge) for 49 UK Biobank diseases/traits, with representative traits in colored font. (c) We report the effective number of causal genes for per-gene h2 linked to common SNPs (Ge,common) and the effective number of causal genes for per-gene h2 linked to low-frequency SNPs (Ge,low-frea) for 49 UK Biobank diseases/traits, with representative traits in colored font. In (b) and (c), red squares denote median values across 16 independent traits and correlations are computed on log-scale values. Numerical results are reported in Supplementary Table 22 and Supplementary Table 24. AID: Autoimmune disease; BMI: Body mass index; Cholesterol: Total cholesterol; T2D: Type 2 diabetes.

Comment in

References

    1. Visscher PM et al. 10 Years of GWAS Discovery: Biology, Function, and Translation. The American Journal of Human Genetics 101, 5–22 (2017). - PMC - PubMed
    1. Buniello A et al. The NHGRI-EBI GWAS Catalog of published genome-wide association studies, targeted arrays and summary statistics 2019. Nucleic Acids Res 47, D1005–D1012 (2019). - PMC - PubMed
    1. Claussnitzer M et al. A brief history of human disease genetics. Nature 577, 179–189 (2020). - PMC - PubMed
    1. Benner C et al. FINEMAP: efficient variable selection using summary data from genome-wide association studies. Bioinformatics 32, 1493–1501 (2016). - PMC - PubMed
    1. Schaid DJ, Chen W & Larson NB From genome-wide associations to candidate causal variants by statistical fine-mapping. Nat Rev Genet 19, 491–504 (2018). - PMC - PubMed

Publication types

MeSH terms