. 2022 Jun 6;23(1):216.
doi: 10.1186/s12859-022-04743-6.

NODeJ: an ImageJ plugin for 3D segmentation of nuclear objects

Affiliations

NODeJ: an ImageJ plugin for 3D segmentation of nuclear objects

Tristan Dubos et al. BMC Bioinformatics. .

Abstract

Background: The three-dimensional nuclear arrangement of chromatin impacts many cellular processes operating at the DNA level in animal and plant systems. Chromatin organization is a dynamic process that can be affected by biotic and abiotic stresses. Three-dimensional imaging technology allows to follow these dynamic changes, but only a few semi-automated processing methods currently exist for quantitative analysis of the 3D chromatin organization.

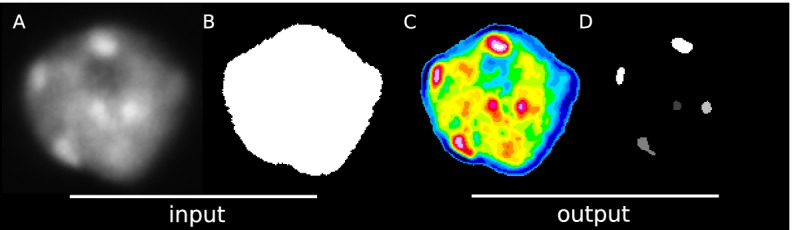
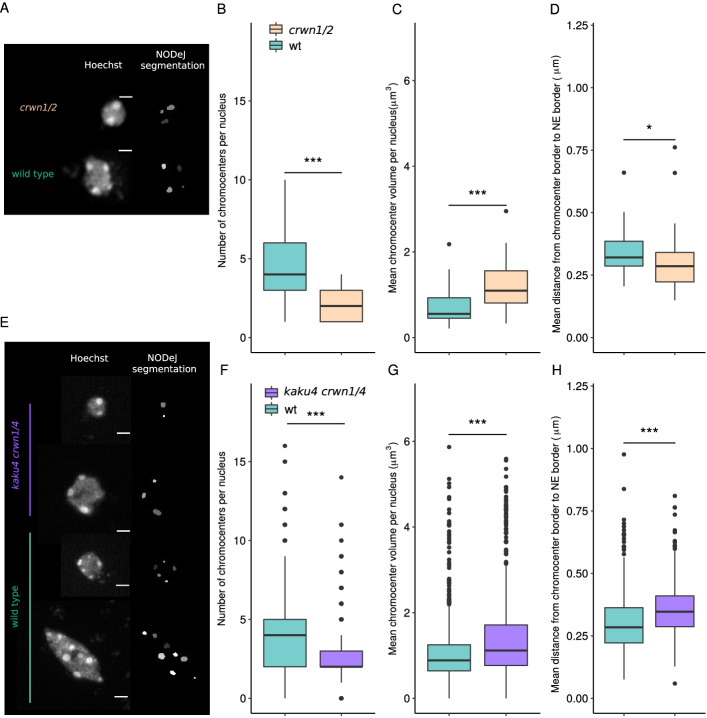
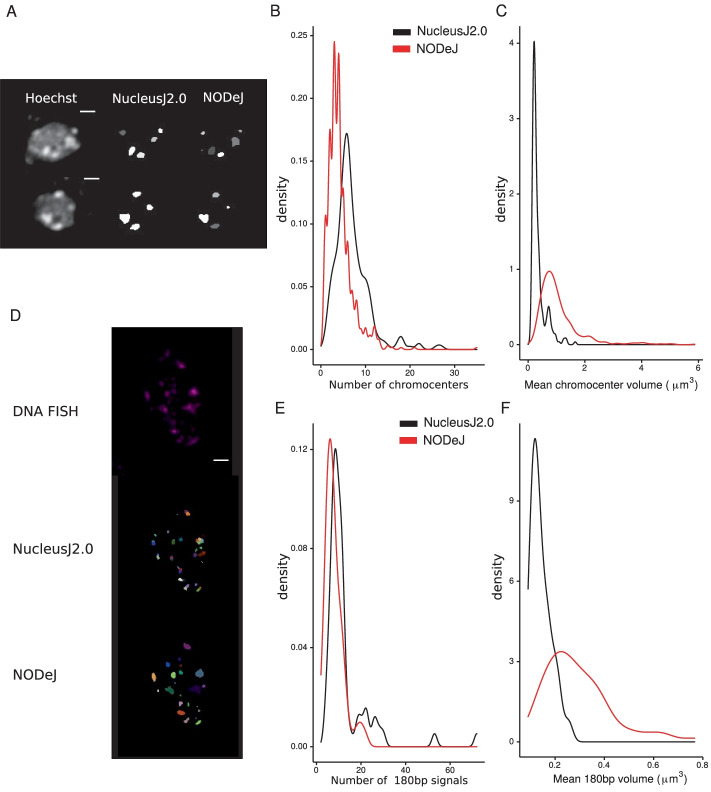
Results: We present an automated method, Nuclear Object DetectionJ (NODeJ), developed as an imageJ plugin. This program segments and analyzes high intensity domains in nuclei from 3D images. NODeJ performs a Laplacian convolution on the mask of a nucleus to enhance the contrast of intra-nuclear objects and allow their detection. We reanalyzed public datasets and determined that NODeJ is able to accurately identify heterochromatin domains from a diverse set of Arabidopsis thaliana nuclei stained with DAPI or Hoechst. NODeJ is also able to detect signals in nuclei from DNA FISH experiments, allowing for the analysis of specific targets of interest.

Conclusion and availability: NODeJ allows for efficient automated analysis of subnuclear structures by avoiding the semi-automated steps, resulting in reduced processing time and analytical bias. NODeJ is written in Java and provided as an ImageJ plugin with a command line option to perform more high-throughput analyses. NODeJ can be downloaded from https://gitlab.com/axpoulet/image2danalysis/-/releases with source code, documentation and further information avaliable at https://gitlab.com/axpoulet/image2danalysis . The images used in this study are publicly available at https://www.brookes.ac.uk/indepth/images/ and https://doi.org/10.15454/1HSOIE .

Keywords: 3D DNA FISH analysis; 3D image analysis; Chromocenter; Heterochromatin organization.


Conflict of interest statement

The authors declare that they have no competing interests.

Figures

Fig. 1
Fig. 1
NODeJ workflow. A. Raw image of a plant nucleus (A. thaliana) at interphase stained with DAPI from [14]. B. Image of the segmented nucleus obtained with NucleusJ2.0. C. Image obtained with NODeJ. High voxel values are shown in red and low values are shown in blue. D. The resulting segmented image, in which each object (i.e. connected component) can be analyzed individually
Fig. 2
Fig. 2
Analysis of A. thaliana wild type nuclei with NODeJ. Results obtained from Arpòn et al. [14] describing chromocenters from isolated wild type nuclei (n=212) extracted from whole plants (Additional file 1). A–D. Histograms of chromocenters and nucleus characteristics. The histograms show the repartition of nuclear volume (A), the chromocenter volume (B), the chromocenter number per nucleus (C) and their distance to the nuclear envelope (D). The segmentation of the nuclei was obtained using NucleusJ2.0 with default parameters [9]. Histograms were made using various R packages [17, 18] (Additional file 2 and 3 describe the computed parameters)
Fig. 3
Fig. 3
NODeJ analyses of two datasets from mutants (crwn1/2 and kaku4 crwn1/4) known to alter chromatin organization in A. thaliana cotyledon epidermis. A. Z-projection of guard cell nuclei (diploid cell) of wild type and crwn1/2 mutant leaf epidermis, stained with Hoechst as well as the NODeJ image result (scale bar 2 μm3). crwn1/2 mutants (n=39) and wild type plants (n=38) from Poulet et al. [8] (Additional file 1). B. Number of chromocenters. C. Mean chromocenter volume per nucleus. D. Mean distance from chromocenter border to the nuclear envelope per nucleus. E. Z-projection of epidermis (diploid and polyploid cells) of wild type and kaku4 crwn1/4 mutant, stained with Hoechst as well as the NODeJ image result (scale bar 2 μm3). kaku4 crwn1/4 triple mutant (n=851) and wild type plants (n=609) from Dubos et al. [9] (Additional file 1). F. Number of chromocenters. G. Mean chromocenter volume per nucleus. H. Mean distance from chromocenter border to the nuclear envelope per nucleus. Mann-Whitney U test P-value: * 0.05, *** 0.001. Box plots and statistical tests were made using various R packages [17, 18, 21] (Additional file 2 and 3 describe the computed parameters)
Fig. 4
Fig. 4
NODeJ 180bp repeat DNA FISH signal detection in cotyledon epidermis nuclei of A. thaliana. Results from the analysis of DNA FISH experiments of kaku4 crwn1/4 triple mutants (n = 93) and wild type (n = 65) from the Dubos et al. [9] dataset (Additional file 1). A. Z-projection of 3D DNA FISH of a wild type pavement cell nucleus (scale bar 2 μm3). The boxplots show: B. the number of of 180bp repeat signals per nucleus, C. the mean 180bp repeat signal volume per nucleus, D. the mean distance from 180bp repeat signal border to the nuclear envelope. Mann-Whitney U test P-value: * 0.05, *** 0.001. Box plots and statistical tests were made using various R packages [17, 18, 21] (Additional files 2 and 3 describe the computed parameters)
Fig. 5
Fig. 5
Comparison of chromocenters and FISH signals obtained with NucleusJ2.0 and NODeJ. The results were obtained from wild type nuclei from Poulet et al. [8] and Dubos et al. [9]. We used the published results [8, 9] for the NucleusJ2.0 results (Hoechst n = 253) and reanalyzed the global set of wild type nuclei available for NODeJ results (Hoechst n = 719) (Additional file 1). A–C comparison of Hoechst staining analysis. A. Z-projection of nuclei (Hoechst staining), and NucleusJ2.0 and NODeJ segmentation results (scale bar 2 μm3). The denstity plots show the repartition of the number of chromocenters per nucleus (B) and the mean chromocenter volume per nucleus (C). DF comparison of FISH analysis. D. Z-projection of nuclei (180bp repeats FISH) and segmentation results from NucleusJ2.0 and NODeJ (scale bar 2 μm3, each color is an individual object). Red arrows indicate the same region identified as two objects by NucleusJ2.0 and one object by NODeJ. The denstity plots show the repartition of the number of FISH signals per nucleus (n = 68 for NODeJ and NucleusJ2.0 results) (E), the mean FISH signals volume per nucleus (F). Density plots were made using various R packages [17, 18] (Additional files 2 and 3 describe the computed parameters)

References

    1. Jevtić P, Edens LJ, Vuković LD, Levy DL. Sizing and shaping the nucleus: Mechanisms and significance. Curr Opin Cell Biol. 2014;28(1):16–27. doi: 10.1016/j.ceb.2014.01.003. - DOI - PMC - PubMed
    1. Fransz P, De Jong JH, Lysak M, Castiglione MR, Schubert I. Interphase chromosomes in Arabidopsis are organized as well defined chromocenters from which euchromatin loops emanate. Proceedings of the National Academy of Sciences of the United States of America. 2002;99(22):14584–14589. doi: 10.1073/pnas.212325299. - DOI - PMC - PubMed
    1. Bickmore WA, Van Steensel B. Genome architecture: domain organization of interphase chromosomes. Cell. 2013;152(6):1270–1284. doi: 10.1016/j.cell.2013.02.001. - DOI - PubMed
    1. Jacob Y, Stroud H, Leblanc C, Feng S, Zhuo L, Caro E, Hassel C, Gutierrez C, Michaels SD, Jacobsen SE. Regulation of heterochromatic DNA replication by histone H3 lysine 27 methyltransferases. Nature. 2010;466(7309):987–991. doi: 10.1038/nature09290. - DOI - PMC - PubMed
    1. Poulet A, Duc C, Voisin M, Desset S, Tutois S, Vanrobays E, Benoit M, Evans DE, Probst AV, Tatout C. The LINC complex contributes to heterochromatin organisation and transcriptional gene silencing in plants. J Cell Sci. 2017;130(3):590–601. doi: 10.1242/jcs.194712. - DOI - PubMed

LinkOut - more resources