

An iron metabolism and immune related gene signature for the prediction of clinical outcome and molecular characteristics of triple-negative breast cancer
- PMID: 35668369
- PMCID: PMC9172128
- DOI: 10.1186/s12885-022-09679-x
An iron metabolism and immune related gene signature for the prediction of clinical outcome and molecular characteristics of triple-negative breast cancer
Abstract
Background: An imbalance of intracellular iron metabolism can lead to the occurrence of ferroptosis. Ferroptosis can be a factor in the remodeling of the immune microenvironment and can affect the efficacy of cancer immunotherapy. How to combine ferroptosis-promoting modalities with immunotherapy to suppress triple-negative breast cancer (TNBC) has become an issue of great interest in cancer therapy. However, potential biomarkers related to iron metabolism and immune regulation in TNBC remain poorly understand.
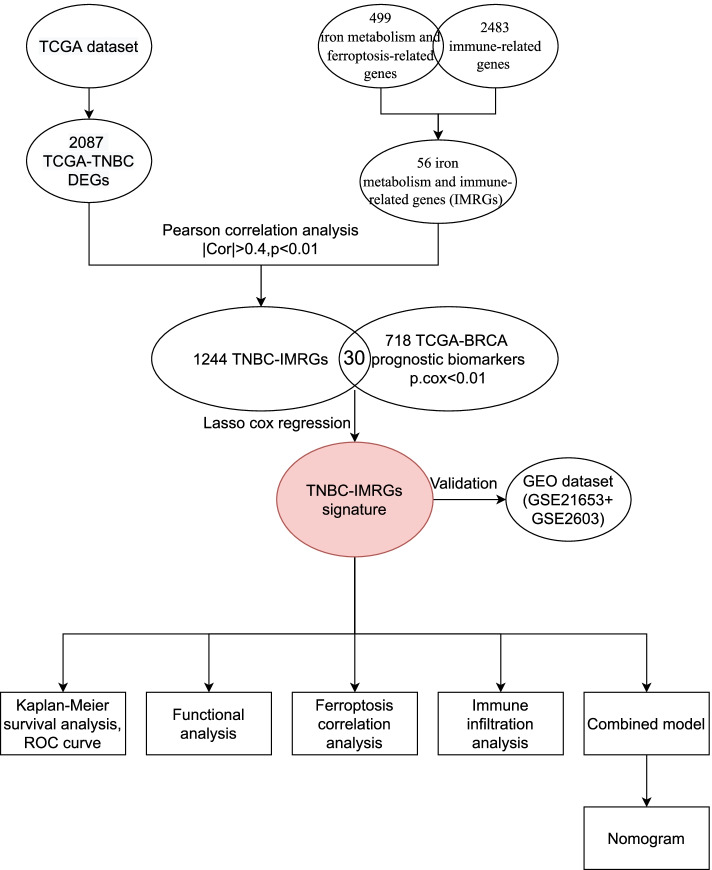
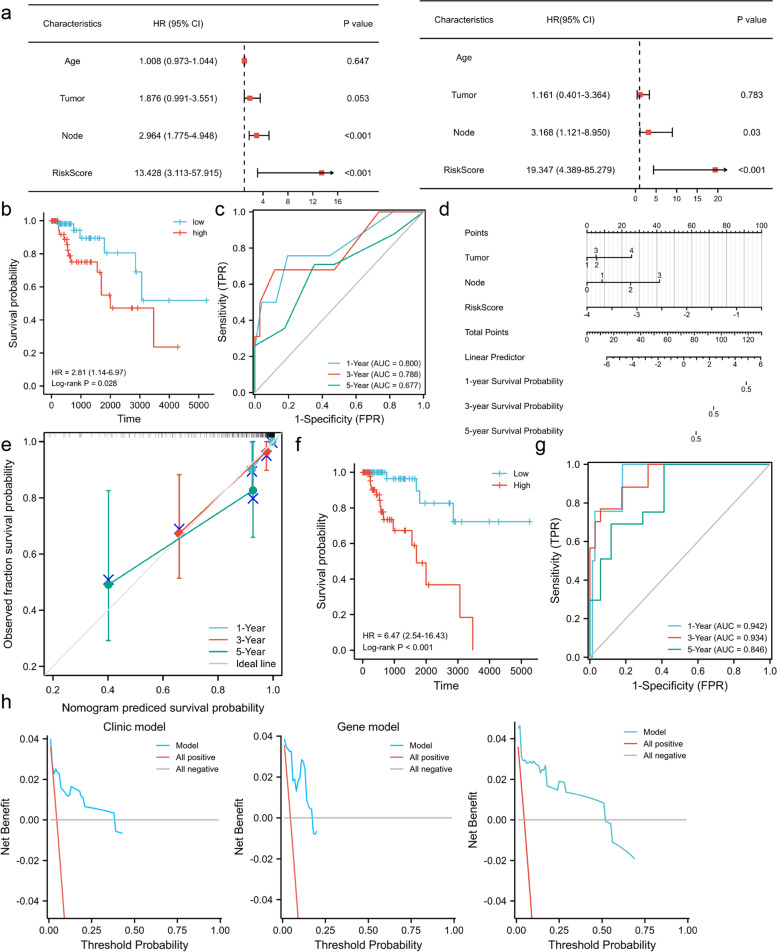
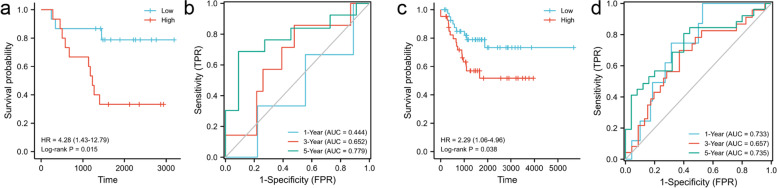
Methods: We constructed an optimal prognostic TNBC-IMRGs (iron metabolism and immune-related genes) signature using least absolute shrinkage and selection operator (LASSO) cox regression. Survival analysis and ROC curves were analyzed to identify the predictive value in a training cohort and external validation cohorts. The correlations of gene signature with ferroptosis regulators and immune infiltration are also discussed. Finally, we combined the gene signature with the clinical model to construct a combined model, which was further evaluated using a calibration curve and decision curve analysis (DCA).
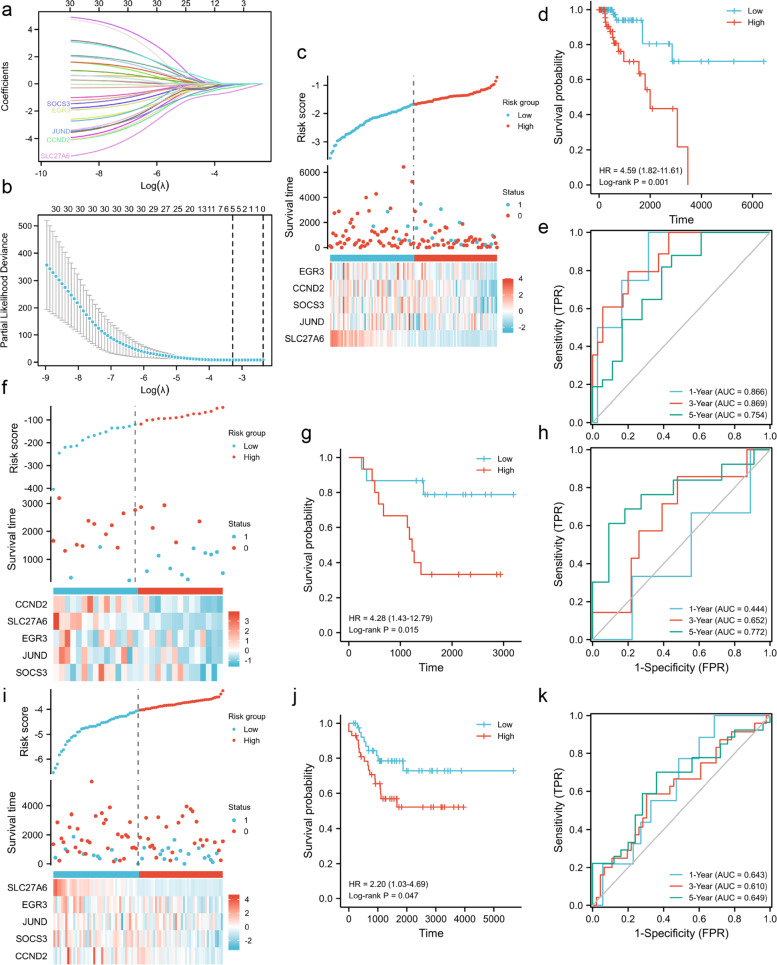
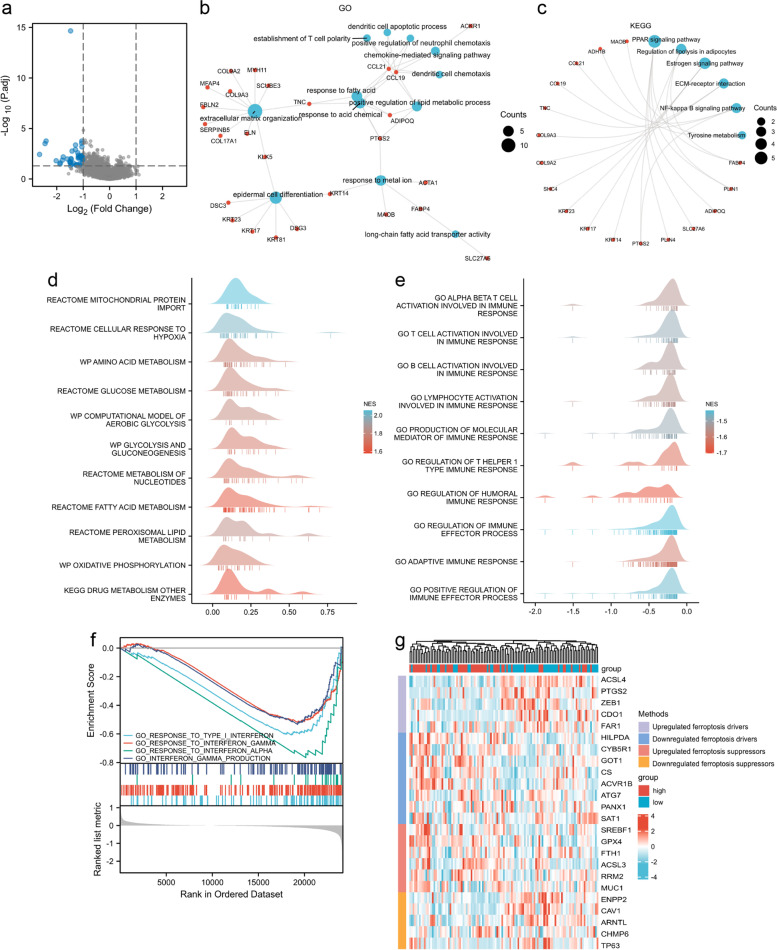
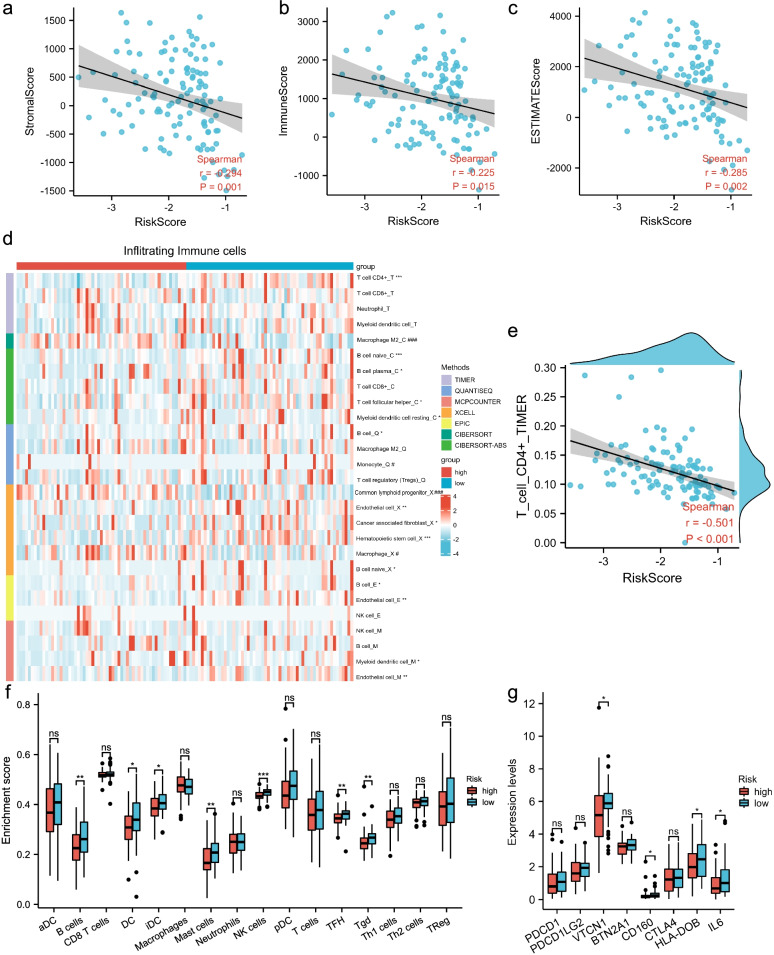
Results: Compared with the high-risk group, TNBC patients with low-risk scores had a remarkably better prognosis in both the training set and external validation sets. Both the IMRGs signature and combined model had a high predictive capacity, 1/3/5- year AUC: 0.866, 0.869, 0.754, and 1/3/5-yaer AUC: 0.942, 0.934, 0.846, respectively. The calibration curve and DCA also indicate a good predictive performance of the combined model. Gene set enrichment analysis (GSEA) suggests that the high-risk group is mainly enriched in metabolic processes, while the low-risk group is mostly clustered in immune related pathways. Multiple algorithms and single sample GSEA further show that the low-risk score is associated with a high tumor immune infiltration level. Differences in expression of ferroptosis regulators are also observed among different risk groups.
Conclusions: The IMRGs signature based on a combination of iron metabolism and immune factors may contribute to evaluating prognosis, understanding molecular characteristics and selecting treatment options in TNBC.
Keywords: Ferroptosis; Gene signature; Immune infiltration; Iron metabolism; Triple-negative breast cancer.
© 2022. The Author(s).
Conflict of interest statement
The authors declare that they have no competing interests.
Figures
Similar articles
-
Integrated clinical characteristics and omics analysis identifies a ferroptosis and iron-metabolism-related lncRNA signature for predicting prognosis and therapeutic responses in ovarian cancer.J Ovarian Res. 2022 Jan 20;15(1):10. doi: 10.1186/s13048-022-00944-y. J Ovarian Res. 2022. PMID: 35057848 Free PMC article.
-
Identification of the prognostic value of ferroptosis-related gene signature in breast cancer patients.BMC Cancer. 2021 May 31;21(1):645. doi: 10.1186/s12885-021-08341-2. BMC Cancer. 2021. PMID: 34059009 Free PMC article.
-
A combined hypoxia and immune gene signature for predicting survival and risk stratification in triple-negative breast cancer.Aging (Albany NY). 2021 Aug 2;13(15):19486-19509. doi: 10.18632/aging.203360. Epub 2021 Aug 2. Aging (Albany NY). 2021. PMID: 34341184 Free PMC article.
-
Ferroptosis induction via targeting metabolic alterations in triple-negative breast cancer.Biomed Pharmacother. 2023 Dec 31;169:115866. doi: 10.1016/j.biopha.2023.115866. Epub 2023 Nov 10. Biomed Pharmacother. 2023. PMID: 37951026 Review.
-
Ferroptosis in TNBC: interplay with tumor-infiltrating immune cells and therapeutic implications.Mol Cell Biochem. 2025 May 29. doi: 10.1007/s11010-025-05305-z. Online ahead of print. Mol Cell Biochem. 2025. PMID: 40439838 Review.
Cited by
-
Ferroptosis as a promising targeted therapy for triple negative breast cancer.Breast Cancer Res Treat. 2024 Oct;207(3):497-513. doi: 10.1007/s10549-024-07387-7. Epub 2024 Jun 14. Breast Cancer Res Treat. 2024. PMID: 38874688 Review.
-
Absence of Cysteine and Iron Chelation Induces Ferroptosis in Triple-Negative Breast Cancer Cells.Breast Cancer (Auckl). 2025 Jan 16;19:11782234241311012. doi: 10.1177/11782234241311012. eCollection 2025. Breast Cancer (Auckl). 2025. PMID: 39822769 Free PMC article.
-
Establishment and verification of a nomogram for predicting survival in patients with triple-positive breast cancer.Ann Transl Med. 2022 Aug;10(16):884. doi: 10.21037/atm-22-3560. Ann Transl Med. 2022. PMID: 36111009 Free PMC article.
-
Ferroptosis: the emerging player in remodeling triple-negative breast cancer.Front Immunol. 2023 Oct 20;14:1284057. doi: 10.3389/fimmu.2023.1284057. eCollection 2023. Front Immunol. 2023. PMID: 37928550 Free PMC article. Review.
-
Iron-Dependent Cell Death: Exploring Ferroptosis as a Unique Target in Triple-Negative Breast Cancer Management.Cancer Manag Res. 2025 Mar 19;17:625-637. doi: 10.2147/CMAR.S503932. eCollection 2025. Cancer Manag Res. 2025. PMID: 40124838 Free PMC article. Review.
References
-
- Siegel R, Miller K, Jemal A. Cancer statistics, 2020. CA: a cancer journal for clinicians. 2020;70(1):7–30. - PubMed
-
- Liedtke C, Mazouni C, Hess K, André F, Tordai A, Mejia J, Symmans W, Gonzalez-Angulo A, Hennessy B, Green M, et al. Response to neoadjuvant therapy and long-term survival in patients with triple-negative breast cancer. Journal of clinical oncology : official journal of the American Society of Clinical Oncology. 2008;26(8):1275–1281. doi: 10.1200/JCO.2007.14.4147. - DOI - PubMed
MeSH terms
Substances
Grants and funding
LinkOut - more resources
Full Text Sources
