. 2022 Jun 6;19(1):133.
doi: 10.1186/s12974-022-02494-y.

The circadian clock protein Rev-erbα provides neuroprotection and attenuates neuroinflammation against Parkinson's disease via the microglial NLRP3 inflammasome

Affiliations

The circadian clock protein Rev-erbα provides neuroprotection and attenuates neuroinflammation against Parkinson's disease via the microglial NLRP3 inflammasome

Liang Kou et al. J Neuroinflammation. .

Abstract

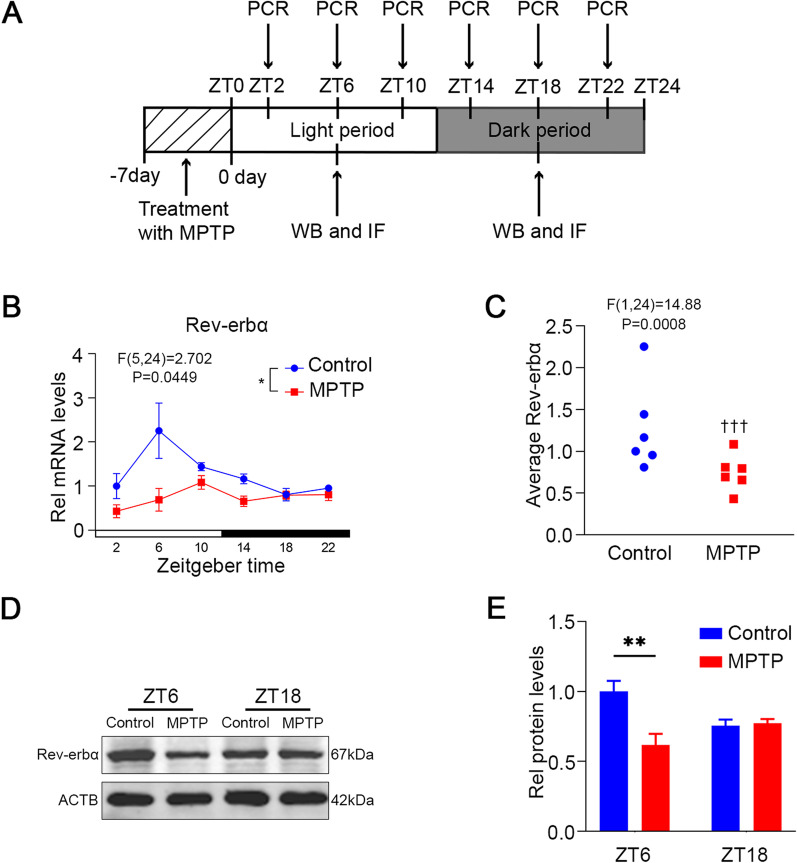
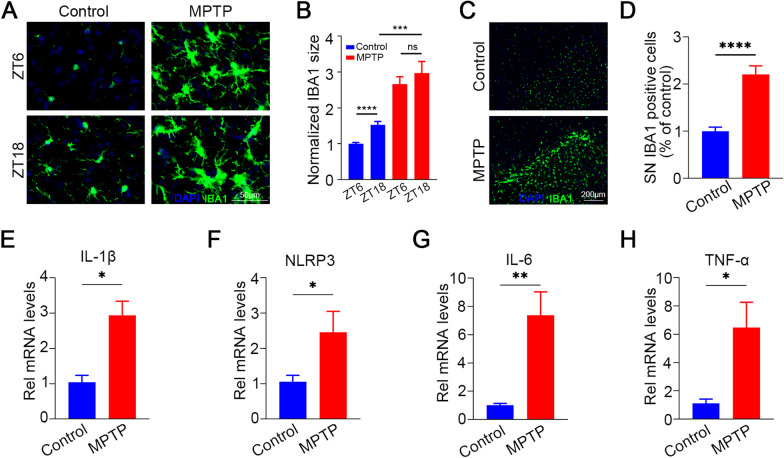
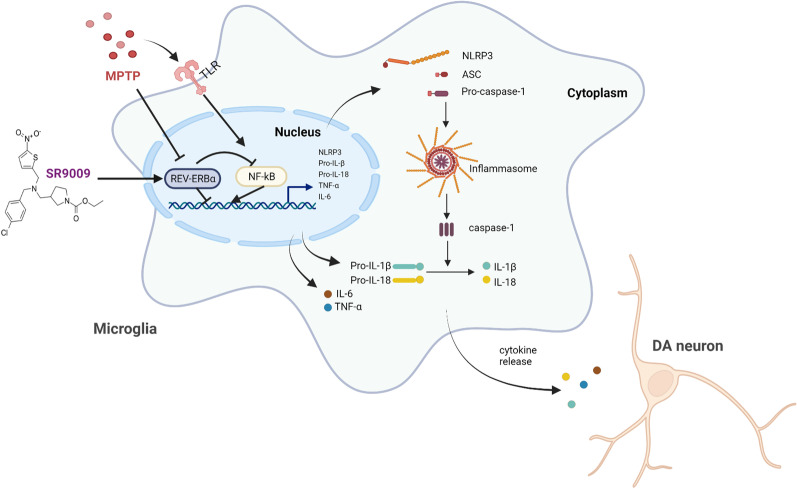
Background: Circadian disturbance is a common nonmotor complaint in Parkinson's disease (PD). The molecular basis underlying circadian rhythm in PD is poorly understood. Neuroinflammation has been identified as a key contributor to PD pathology. In this study, we explored the potential link between the core clock molecule Rev-erbα and the microglia-mediated NLR family pyrin domain-containing 3 (NLRP3) inflammasome in PD pathogenesis.

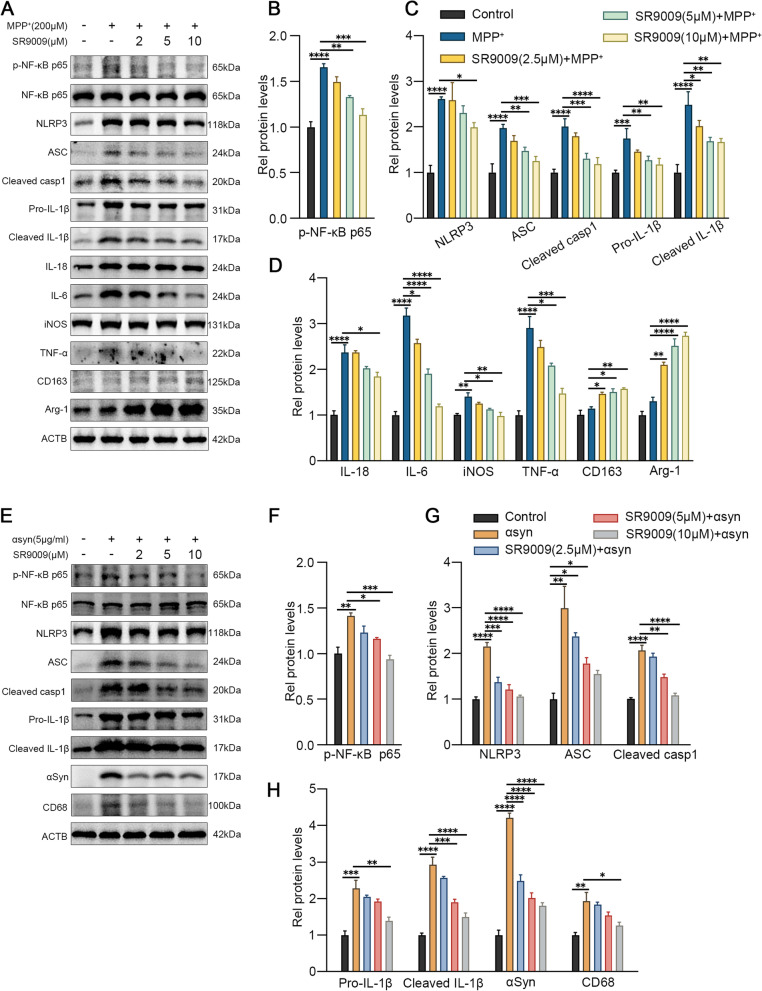
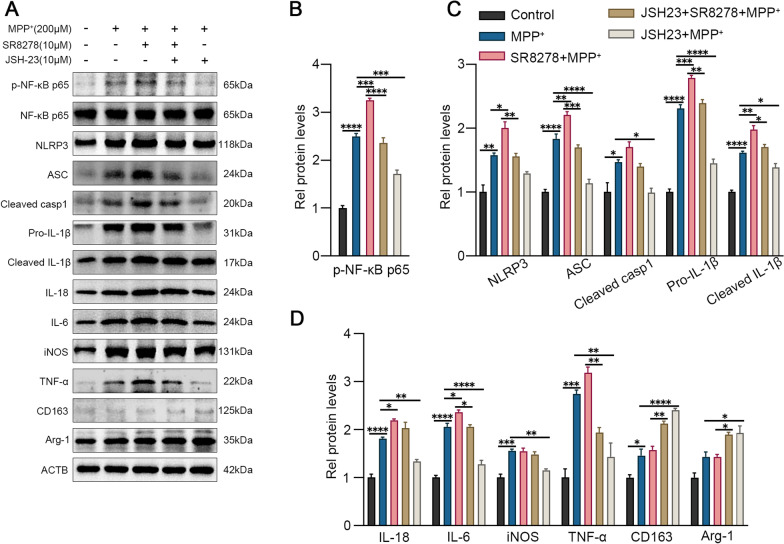
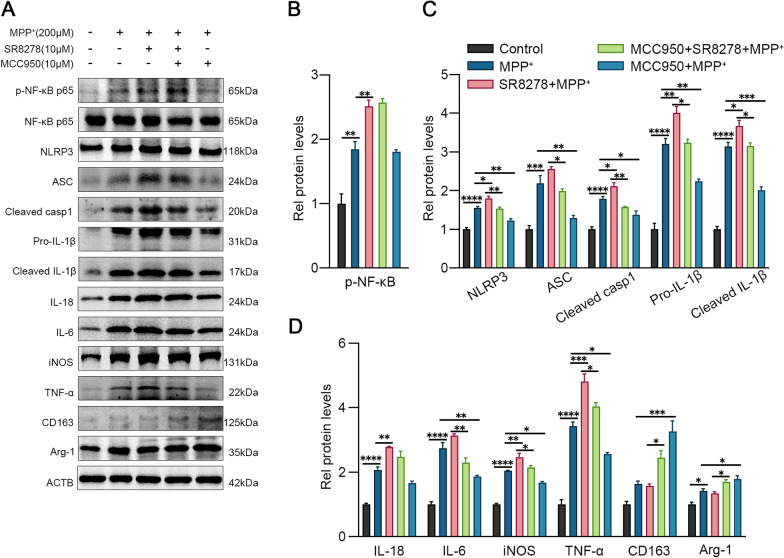
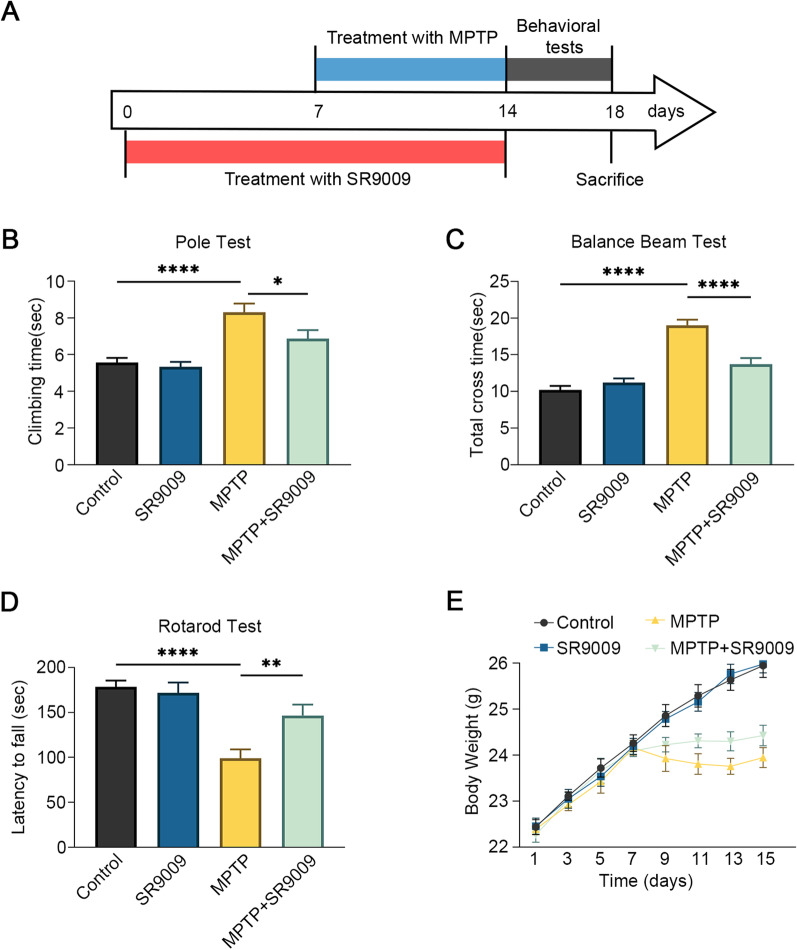
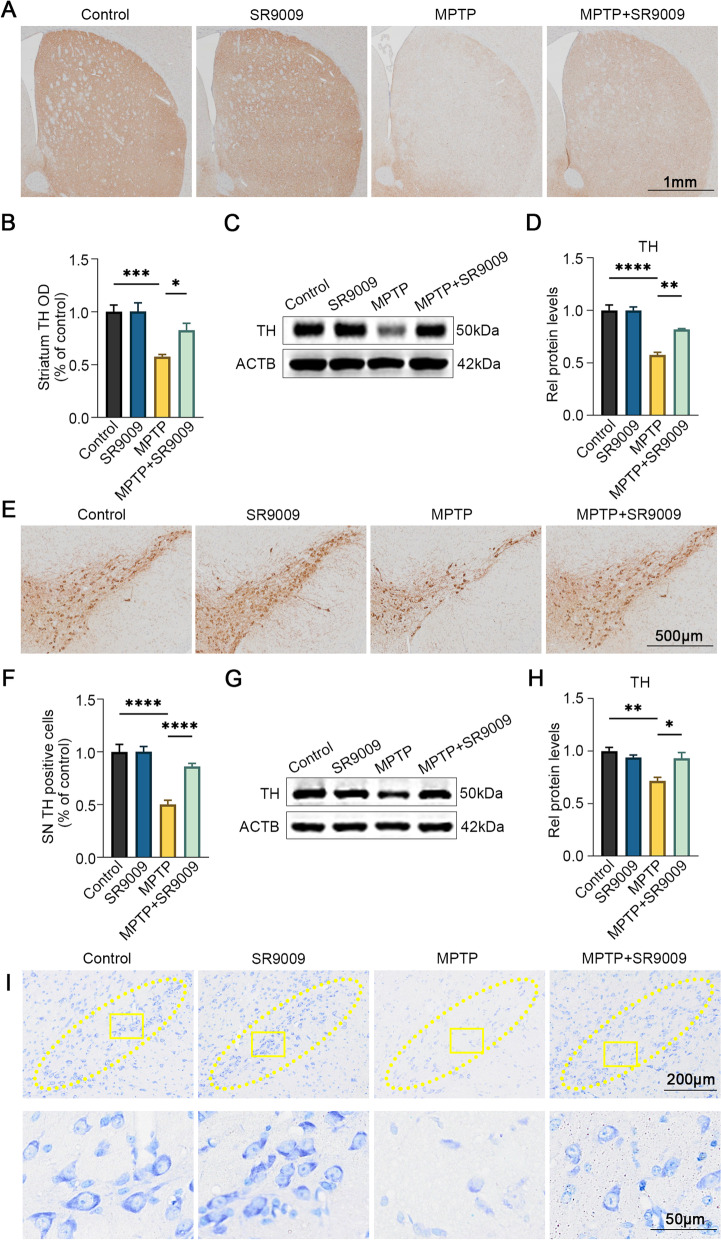
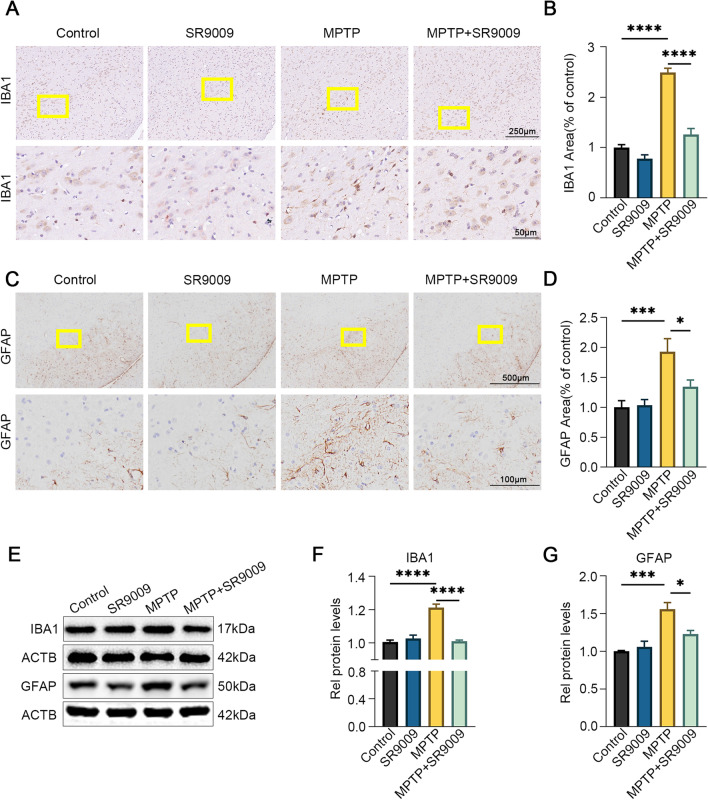
Methods: We first examined the diurnal Rev-erbα rhythms and diurnal changes in microglia-mediated inflammatory cytokines expression in the SN of MPTP-induced PD mice. Further, we used BV2 cell to investigate the impacts of Rev-erbα on NLRP3 inflammasome and microglial polarization induced by 1-methyl-4-phenylpyridinium (MPP+) and αsyn pre-formed fibril. The role of Rev-erbα in regulating microglial activation via NF-κB and NLRP3 inflammasome pathway was then explored. Effects of SR9009 against NLRP3 inflammasome activation, microgliosis and nigrostriatal dopaminergic degeneration in the SN and striatum of MPTP-induced PD mice were studied in detail.

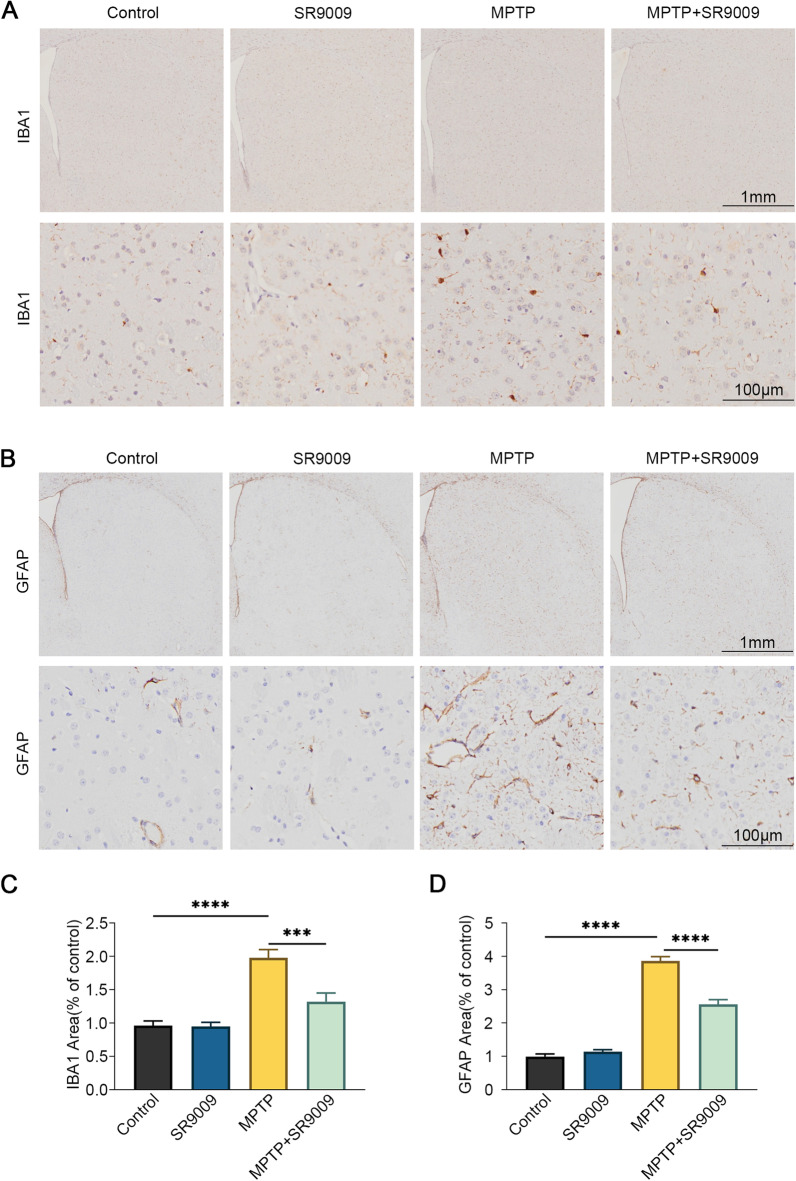
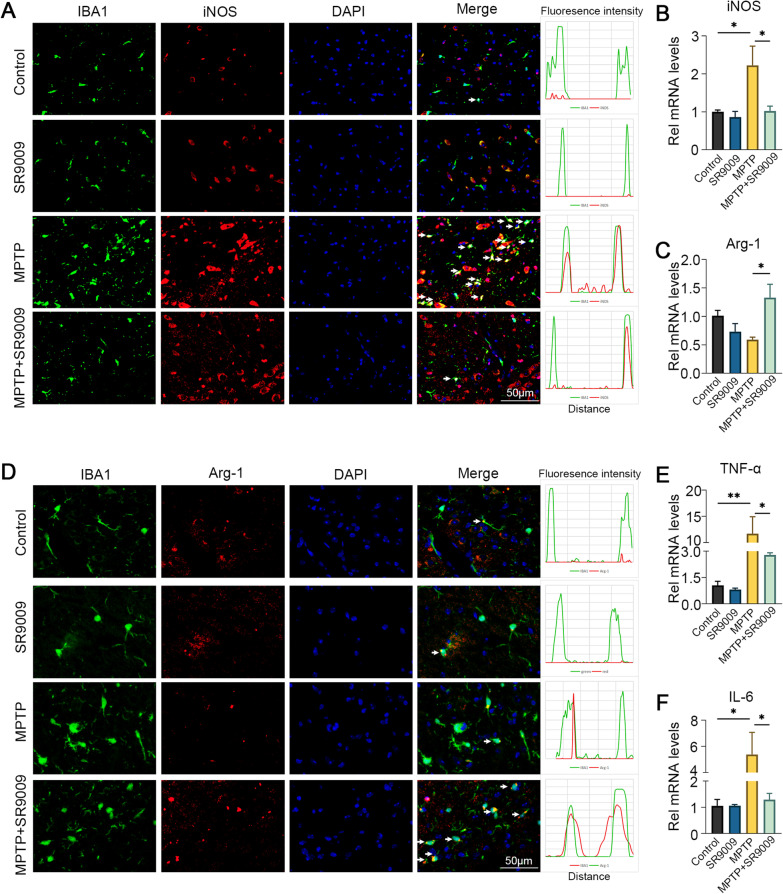
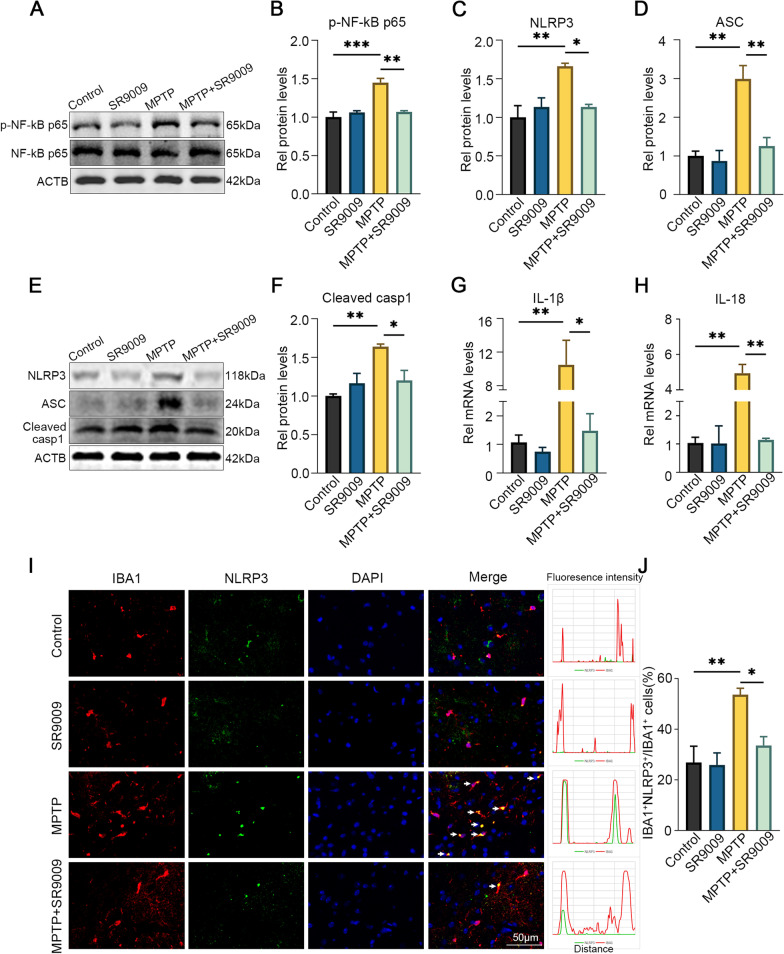
Results: BV2 cell-based experiments revealed the role of Rev-erbα in regulating microglial activation and polarization through the NF-κB and NLRP3 inflammasome pathways. Circadian oscillation of the core clock gene Rev-erbα in the substantia nigra (SN) disappeared in MPTP-induced PD mice, as well as diurnal changes in microglial morphology. The expression of inflammatory cytokines in SN of the MPTP-induced mice were significantly elevated. Furthermore, dopaminergic neurons loss in the nigrostriatal system were partially reversed by SR9009, a selective Rev-erbα agonist. In addition, SR9009 effectively reduced the MPTP-induced glial activation, microglial polarization and NLRP3 inflammasome activation in the nigrostriatal system.

Conclusions: These observations suggest that the circadian clock protein Rev-erbα plays an essential role in attenuating neuroinflammation in PD pathology, and provides a potential therapeutic target for PD treatment.

Keywords: Circadian rhythm; NLRP3; Neuroinflammation; Parkinson’s disease; Rev-erbα.


Conflict of interest statement

The authors declare no conflicts of interest.

Figures

Fig. 1
Fig. 1
Aberrant diurnal Rev-erbα rhythm in the SN of MPTP-induced Mice. A Schematic diagram of expression profiles of Rev-erbα. After 7-day continuous injection of MPTP (25 mg/kg) or 0.9% saline, mice were euthanized at 4-h intervals throughout the day at ZT2, 6, 10, 14, 18, 22. B The mRNA level of Rev-erbα in the SN was quantified using real-time PCR. (*p < 0.05, two-way ANOVA test, interaction between time and genotypes). C The average values of Rev-erbα over the course of the day were calculated. (†††p < 0.001, two-way ANOVA test, interaction between genotypes). A representative western blot image (D) and the statistical graph (E) of Rev-erbα expression at ZT6 and ZT18 in the SN. The protein level of Rev-erbα was normalized to β-actin. (##p < 0.01, two-way ANOVA test). n = 3–5 for each time point. Data were presented as mean ± SEM
Fig. 2
Fig. 2
Diurnal changes in microglia and the inflammatory-related genes in SN of MPTP-induced Mice. A Representative images of IBA1 staining in the SN of control and MPTP mouse with IBA1 size quantification (B). Scale bar, 50 μm. Mice were killed at ZT6 and ZT18. C Iba1 staining in the control and MPTP group with Iba1 number quantification (D). Scale bar, 200 μm. E–H RT-PCR analysis for microglial inflammatory genes from SN of Control and MPTP mice. n = 3–4 for each group. Data were presented as mean ± SEM. (*p < 0.05, **p < 0.01, or ****p < 0.0001 by two-tailed t test)
Fig. 3
Fig. 3
Activation of Rev-erbα inhibited microglial activation induced by MPP+ and αsyn PFF. The representative western blot bands (A) and the statistical graph (BD) of p-NF-κB p65, NLRP3, ASC, cleaved caspase-1, IL-1β, IL-18, IL-6, TNF-a, iNOS, Arg-1 and CD163 protein expressions. BV2 cells were pretreated with SR9009 (2 μM, 5 μM, 10 μM) for 1 h, then incubated with MPP+ for 24 h. The representative western blot bands (E) and the statistical graph (F–H) of p-NF-κB p65, NLRP3, ASC, cleaved caspase-1, IL-1β, CD68 and αsyn protein expressions. BV2 cells were pretreated with SR9009 (2 μM, 5 μM, 10 μM) for 1 h, then incubated with αsyn pre-formed-fibril for 6 h. The p-NF-κB p65 level was normalized to the total of NF-κB p65, and the rest protein levels were normalized to β-actin. Data were presented as mean ± SEM (n = 3). (*p < 0.05, **p < 0.01, ***p < 0.001, **** or p < 0.0001 by One-way ANOVA test)
Fig. 4
Fig. 4
Rev-erbα regulates microglial activation by NF-κB inflammasome pathway. The representative western blot bands (A) and the statistical graph (BD) of p-NF-κB p65, NLRP3, ASC, cleaved caspase-1, IL-1β, IL-18, IL-6, TNF-a, iNOS, Arg-1 and CD163 protein expressions. BV2 cells were pretreated with JSH-23 (10 μM) or SR8278 (10 μM) for 1 h, then incubated with MPP+ for 24 h. The p-NF-κB p65 level was normalized to the total of NF-κB p65, and the rest protein levels were normalized to β-actin. Data were presented as mean ± SEM (n = 3). (*p < 0.05, **p < 0.01, ***p < 0.001, **** or p < 0.0001 by One-way ANOVA test)
Fig. 5
Fig. 5
Rev-erbα regulates microglial activation by NLRP3 inflammasome pathway. The representative western blot bands (A) and the statistical graph (BD) of p-NF-κB p65, NLRP3, ASC, cleaved caspase-1, IL-1β, IL-18, IL-6, TNF-a, iNOS, Arg-1 and CD163 protein expressions. BV2 cells were pretreated with MCC950 (10 μM) or SR8278 (10 μM) for 1 h, then incubated with MPP+ for 24 h. The p-NF-κB p65 level was normalized to the total of NF-κB p65, and the rest protein levels were normalized to β-actin. Data were presented as mean ± SEM (n = 3). (*p < 0.05, **p < 0.01, ***p < 0.001, **** or p < 0.0001 by One-way ANOVA test)
Fig. 6
Fig. 6
SR9009 ameliorates behavioral impairments in MPTP-induced Mice. A Schematic representation of SR9009 intervention therapy. SR9009 was injected intraperitoneally (100 mg/kg/day) for 7 consecutive days prior to MPTP administration and was continued along with MPTP treatment. Behavioral tests began the day after completing 14 days of SR9009 treatment, and mice were killed after behavioral test (day 18). B Time spent in climbing of the pole test. C The time taken to cross the balance beam. D Latency to fall of the rotarod test. E Body-weight changes over time. n = 10 for each group. Data were presented as mean ± SEM. (*p < 0.05, **p < 0.01, or ****p < 0.0001 by One-way ANOVA test)
Fig. 7
Fig. 7
SR9009 protects against dopaminergic neurons degeneration in MPTP-induced mice. The representative immunohistochemical staining of TH (A) and the OD of TH staining (B) in the striatum. Scale bar, 1 mm. Representative western blot bands (C) and the statistical graph (D) of TH in the striatum. The representative immunohistochemical staining of TH (E) and the number of TH positive neurons (F) in the SN. Scale bar, 500 μm. Representative western blot bands (G) and the statistical graph (H) of TH in the SN. I The representative Nissl staining for neurons in the SN. Scale bars, 200 μm for the top row and 50 μm for the bottom row. The TH protein level was normalized to β-actin. n = 3–4 for each group. Data were presented as mean ± SEM. (*p < 0.05, **p < 0.01, or ***p < 0.001 by one-way ANOVA test)
Fig. 8
Fig. 8
SR9009 inhibits microgliosis and astrocytosis in the SN of MPTP-induced mice. The representative immunohistochemistry staining (A) and the statistical graph (B) of IBA1 in the SN. Scale bars, 250 μm for the top row and 50 μm for the bottom row. The representative immunohistochemistry staining (C) and the statistical graph (D) of GFAP in the SN. Scale bars, 500 μm for the top row and 100 μm for the bottom row. Representative western blot bands (E) and the statistical graph (F, G) of IBA1 and GFAP in the SN. The protein levels were normalized to β-actin. n = 3–4 for each group. Data were presented as mean ± SEM. (*p < 0.05, **p < 0.01, or ***p < 0.001 by one-way ANOVA test)
Fig. 9
Fig. 9
SR9009 inhibits microgliosis and astrocytosis in striatum of MPTP-induced mice. A The representative immunohistochemistry staining of IBA1 in the striatum. Scale bars, 1 mm for the top row and 100 μm for the bottom row. B The representative immunohistochemistry staining of GFAP in the striatum. Scale bars, 1 mm for the top row and 100 μm for the bottom row. C, D The statistical graph of IBA1 and GFAP in the striatum. (*p < 0.05, **p < 0.01, or ***p < 0.001 by One-way ANOVA test)
Fig. 10
Fig. 10
SR9009 reversed the phenotypic polarization of microglia in the SN of MPTP-induced mice. A Representative double-immunofluorescent staining of IBA1 (green) and iNOS (red) in the SN. Scale bar, 50 μm. D Representative double-immunofluorescent staining of IBA1 (green) and iNOS (Arg-1) in the SN. Scale bar, 50 μm. The real-time PCR results of iNOS (B), Arg-1 (C), TNF-α (E) and IL-6 (F) in the SN. n = 3–4 for each group. Data were presented as mean ± SEM. (*p < 0.05, **p < 0.01, or ***p < 0.001 by One-way ANOVA test)
Fig. 11
Fig. 11
SR9009 suppresses NLRP3 inflammasome activation in the SN of MPTP-induced mice. The representative western blot bands (A) and the statistical graph (B) of p-NF-κB p65 and NF-κB p65 in the SN. The representative western blot bands (E) and the statistical graph (CD, F) of NLRP3, ASC and cleaved-caspase-1 in the SN. The real-time PCR results of IL-1β (G) and IL-18 (H) in the SN. I Representative double-immunofluorescent staining of IBA1 (red) and NLRP3 (green) in the SN and the statistical graph (J) of IBA1+ NLRP3+/IBA1+ cells. Scale bar, 50 μm. n = 3–4 for each group. The p-NF-κB p65 level was normalized to the total of NF-κB p65, and the rest protein levels were normalized to β-actin. Data were presented as mean ± SEM. (*p < 0.05, **p < 0.01, or ***p < 0.001 by One-way ANOVA test)
Fig. 12
Fig. 12
The mechanism underlying Rev-erbα /NF-κB/NLRP3 axis in MPTP-induced microglia neuroinflammation and dopaminergic impairment. MPTP upregulates the phosphorylation of NF-κB, then activates the NLRP3 inflammasome and promotes the release of inflammatory cytokines. These result in glial proliferation and microglial polarization, ultimately induced dopaminergic impairment. In addition, Rev-erbα-specific small molecule agonist SR9009 alleviates neuroinflammation and improves neurologic outcomes in the MPTP model

Similar articles

Cited by

References

    1. Barone P, Antonini A, Colosimo C, et al. The PRIAMO study: a multicenter assessment of nonmotor symptoms and their impact on quality of life in Parkinson's disease. Mov Disord. 2009;24(11):1641–1649. doi: 10.1002/mds.22643. - DOI - PubMed
    1. Videnovic A, Lazar AS, Barker RA, Overeem S. 'The clocks that time us'—circadian rhythms in neurodegenerative disorders. Nat Rev Neurol. 2014;10(12):683–693. doi: 10.1038/nrneurol.2014.206. - DOI - PMC - PubMed
    1. Christopher L, Koshimori Y, Lang AE, Criaud M, Strafella AP. Uncovering the role of the insula in non-motor symptoms of Parkinson's disease. Brain. 2014;137(Pt 8):2143–2154. doi: 10.1093/brain/awu084. - DOI - PMC - PubMed
    1. Leng Y, Blackwell T, Cawthon PM, Ancoli-Israel S, Stone KL, Yaffe K. Association of circadian abnormalities in older adults with an increased risk of developing Parkinson disease. JAMA Neurol. 2020;77(10):1270–1278. doi: 10.1001/jamaneurol.2020.1623. - DOI - PMC - PubMed
    1. Leng Y, Musiek ES, Hu K, Cappuccio FP, Yaffe K. Association between circadian rhythms and neurodegenerative diseases. Lancet Neurol. 2019;18(3):307–318. doi: 10.1016/S1474-4422(18)30461-7. - DOI - PMC - PubMed