

Time to update the Japanese standard population for comparing mortality rates
- PMID: 35668536
- PMCID: PMC9169265
- DOI: 10.1186/s13690-022-00908-0
Time to update the Japanese standard population for comparing mortality rates
Abstract
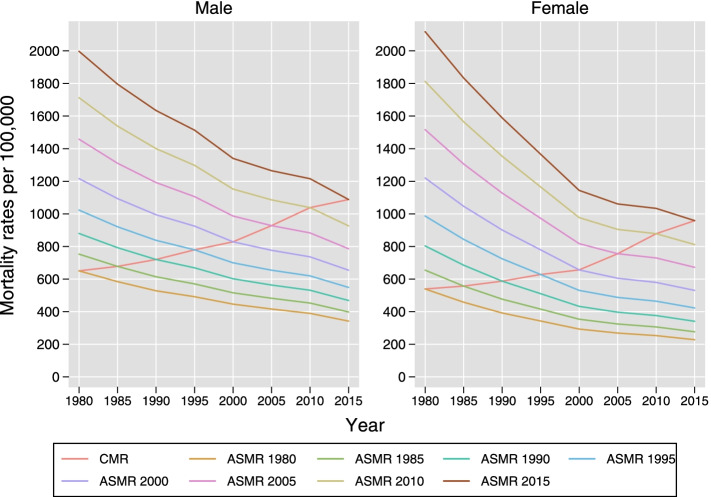
For the last three decades, Japan has been using the population of 1985 for age standardisation to compare mortality rates over time. With the population of Japan declining and ageing rapidly every year, there is a need to update the standard population to make the comparison representative of the current scenario. This is particularly relevant owing to declining mortality rates among the super-ageing Japanese elderly population and more data availability for older age groups. The choice of one population as standard over another is arbitrary because it does not make much difference to the trends in rates. The proportion of elderly in Japan is increasing rapidly and is expected to be one-third of the total population by 2030, in contrast to the proportion of 10% in the 1980s. Using a standard population with a lower proportion of elderly may weight the rates disproportionately for this age group. It is typically suitable to change the standard population every 25 to 30 years. It is advisable to choose the population of 2015 as the new standard population as suggested by the working group of the Ministry of Health, Labour and Welfare of Japan for revising the standard population. However, it should be noted that the newly calculated age-standardised mortality rates will no longer be comparable to those calculated using the older standard populations. Updating the standard population will produce age-standardised rates for recent years closer to the crude rates and would thus reduce the extent of misinterpreting decreased mortality risks using age-standardised rates that do not closely resemble the crude rates.
Keywords: Age standardisation; Japan; Mortality; Standard population; Standardise; Trends.
© 2022. The Author(s).
Conflict of interest statement
The authors declare that they have no competing interests.
Figures
References
-
- Ministry of Health labour and welfare of Japan. Study group for revision of standard population. 2019. https://www.mhlw.go.jp/stf/newpage_07161.html. Accessed 02 Oct. 2021.
-
- National Institute of Population and Social Security Research. Population Projections for Japan (2016–2065): Summary. http://www.ipss.go.jp/pp-zenkoku/e/zenkoku_e2017/pp_zenkoku2017e_gaiyou..... Accessed 07 Aug. 2021.
-
- Ministry of Health Labour and Welfare. Vital statistics of Japan 1980–2015. Vital Statistics 2016. https://www.mhlw.go.jp/english/database/db-hw/index.html. Accessed 24 Jan. 2021.
-
- Statistics Bureau of Japan. Population Census 1980–2015. Ministry of Internal Affairs and Communication. 2016. http://www.stat.go.jp/english/data/kokusei/index.html. Accessed 24 Jan. 2021.
Publication types
LinkOut - more resources
Full Text Sources
