

'Investing' in care for old age? An examination of long-term care expenditure dynamics and its spillovers
- PMID: 35668842
- PMCID: PMC9137442
- DOI: 10.1007/s00181-022-02246-0
'Investing' in care for old age? An examination of long-term care expenditure dynamics and its spillovers
Abstract
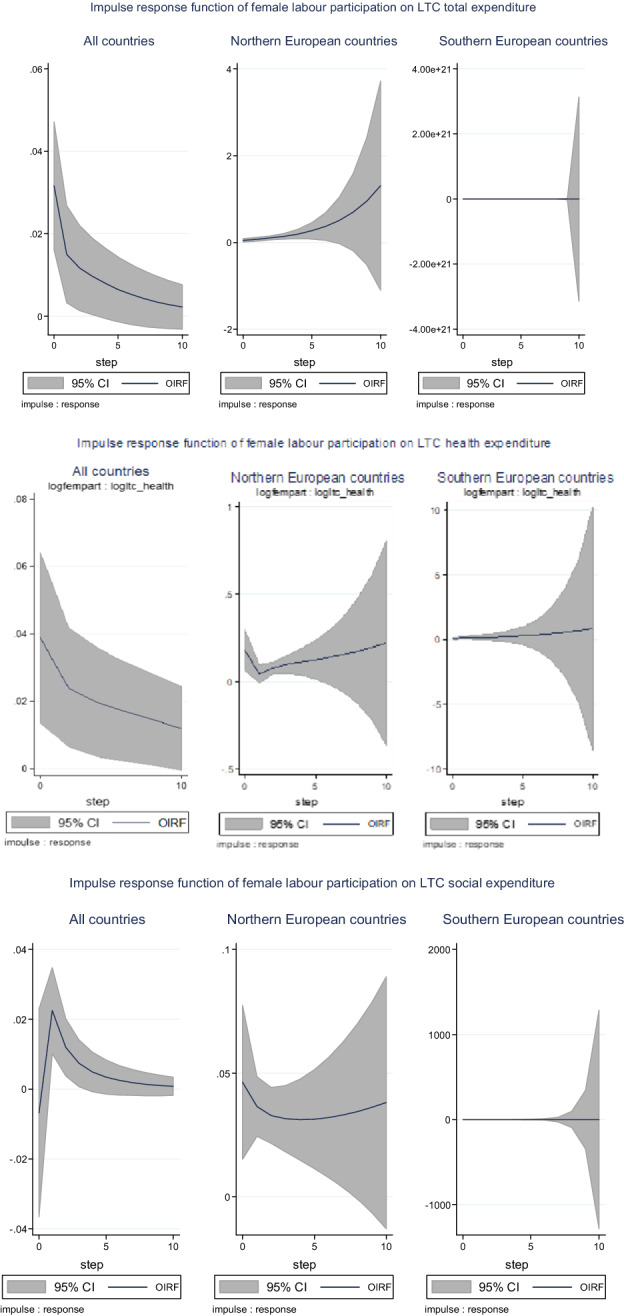
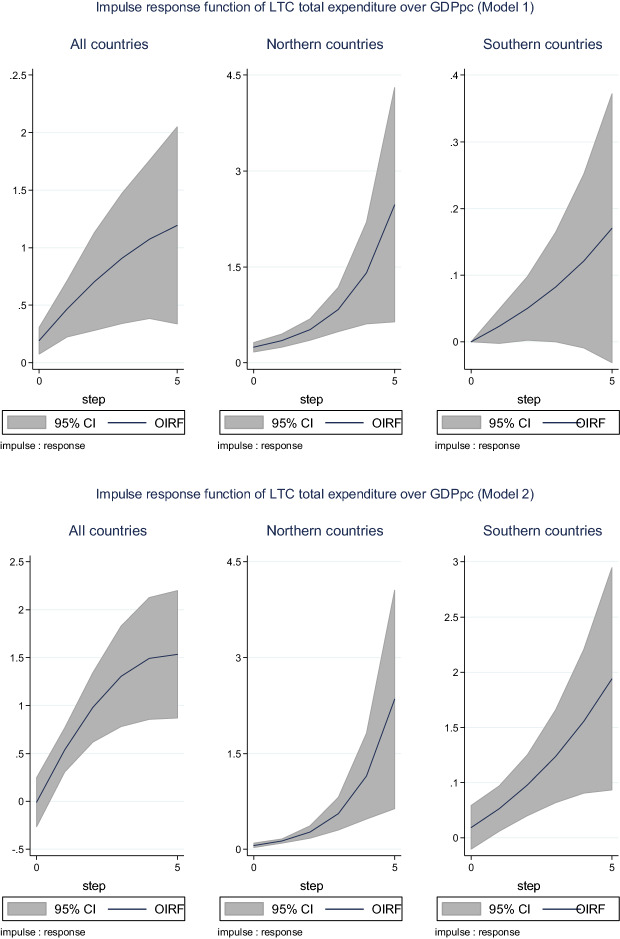
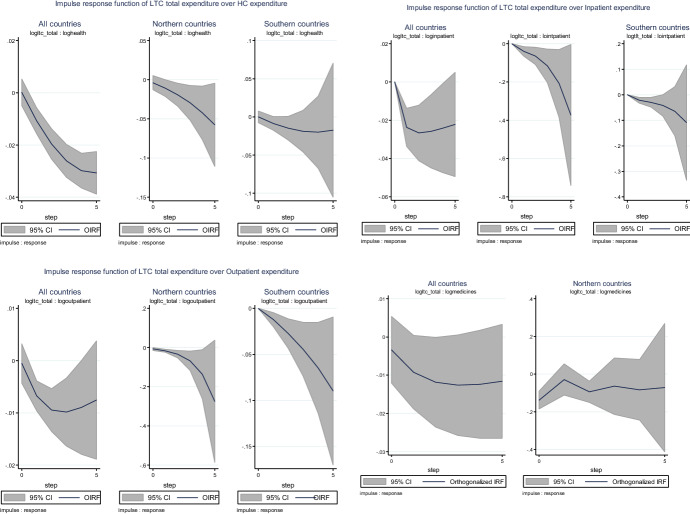
We study the dynamic drivers of expenditure on long-term care (LTC) programmes, and more specifically, the effects of labour market participation of traditional unpaid caregivers (women aged 40 and older) on LTC spending, alongside the spillover effects of a rise in LTC expenditure on health care expenditures (HCE) and the economy (per capita GDP). Our estimates draw from a panel of more than a decade worth of expenditure data from a sample of OECD countries. We use a panel vector auto-regressive (panel-VAR) system that considers the dynamics between the dependent variables. We find that LTC expenditure increases with the rise of the labour market participation of the traditional unpaid caregiver (women over 40 years of age), and that such expenditures rise exerts large spillover effects on health spending and the economy. We find that a 1% increase in female labour participation gives rise to a 1.48% increase in LTC expenditure and a 0.88% reduction in HCE. The effect of LTC spending over HCE is mainly driven by a reduction in inpatient and medicine expenditures, exhibiting large country heterogeneity. Finally, we document significant spillover effects of LTC expenditures on per capita GDP.
Supplementary information: The online version contains supplementary material available at 10.1007/s00181-022-02246-0.
Keywords: Care spillovers; Dynamic panel data; Female labour market participation; Health spending; Long-term care spending; Panel-VAR.
© The Author(s) 2022, corrected publication 2022.
Conflict of interest statement
Conflict of interestNone of the authors has any conflict of interest to disclose.
Figures
Similar articles
-
Impacts of informal caregiver availability on long-term care expenditures in OECD countries.Health Serv Res. 2004 Dec;39(6 Pt 2):1971-92. doi: 10.1111/j.1475-6773.2004.00328.x. Health Serv Res. 2004. PMID: 15544640 Free PMC article.
-
Hong Kong domestic health spending: financial years 1989/90 to 2011/12.Hong Kong Med J. 2015 Jun;21(3 Suppl 3):1-24. Hong Kong Med J. 2015. PMID: 26045183
-
Spending on medicines in Israel in an international context.Isr Med Assoc J. 2005 May;7(5):286-91. Isr Med Assoc J. 2005. PMID: 15909459
-
National health expenditures: a global analysis.Bull World Health Organ. 1994;72(4):623-37. Bull World Health Organ. 1994. PMID: 7923542 Free PMC article.
-
Hong Kong's domestic health spending--financial years 1989/90 through 2004/05.Hong Kong Med J. 2008 Apr;14 Suppl 2:2-23. Hong Kong Med J. 2008. PMID: 18587162 Review.
Cited by
-
Long-term care insurance, mental health of the elderly and its spillovers.Front Public Health. 2023 Mar 3;11:982656. doi: 10.3389/fpubh.2023.982656. eCollection 2023. Front Public Health. 2023. PMID: 36935677 Free PMC article.
-
Caregiving in long-term care before and during the COVID-19 pandemic: a scoping review.Eur Geriatr Med. 2024 Oct;15(5):1231-1243. doi: 10.1007/s41999-024-01029-3. Epub 2024 Aug 5. Eur Geriatr Med. 2024. PMID: 39103740
-
The Effect of Welfare State Policy Spending on the Equalization of Socioeconomic Status Disparities in Mental Health.J Health Soc Behav. 2023 Sep;64(3):336-353. doi: 10.1177/00221465231166334. Epub 2023 Apr 25. J Health Soc Behav. 2023. PMID: 37096773 Free PMC article.
-
Barriers to health, social and long-term care access among older adults: a systematic review of reviews.Int J Equity Health. 2025 Mar 12;24(1):72. doi: 10.1186/s12939-025-02429-y. Int J Equity Health. 2025. PMID: 40075452 Free PMC article.
-
Forecasting total and cause-specific health expenditures for 116 health conditions in Norway, 2022-2050.BMC Med. 2025 Feb 25;23(1):116. doi: 10.1186/s12916-025-03917-2. BMC Med. 2025. PMID: 40001030 Free PMC article.
References
-
- Abrigo M, Love I (2016) Estimation of panel vector autoregression in Stata. Stata J StataCorp LP 16(3):778–804
-
- Anderson M, Calltorp J. The Norrtaelje model: a unique model for integrated health and social care in Sweden. Integrating care to older people and those with complex needs: examining the lessons from international case studies from a project funded by the Commonwealth. Int J Integr Care. 2015;15:1–9. - PMC - PubMed
-
- Andrews D, Lu B. Consistent model and moment selection procedures for GMM estimation with application to dynamic panel data models. J Econom. 2001;101:123–164. doi: 10.1016/S0304-4076(00)00077-4. - DOI
-
- Arellano M, Bond S. Some test of specification for panel data: Monte Carlo evidence and application to employment equations. Rev Econ Stud. 1991;58:277–297. doi: 10.2307/2297968. - DOI
LinkOut - more resources
Full Text Sources