. 2022 May 20:12:904031.
doi: 10.3389/fonc.2022.904031. eCollection 2022.

Effect of CRISPR Knockout of AXIN1 or ARID1A on Proliferation and Migration of Porcine Hepatocellular Carcinoma

Affiliations

Effect of CRISPR Knockout of AXIN1 or ARID1A on Proliferation and Migration of Porcine Hepatocellular Carcinoma

Lobna Elkhadragy et al. Front Oncol. .

Abstract

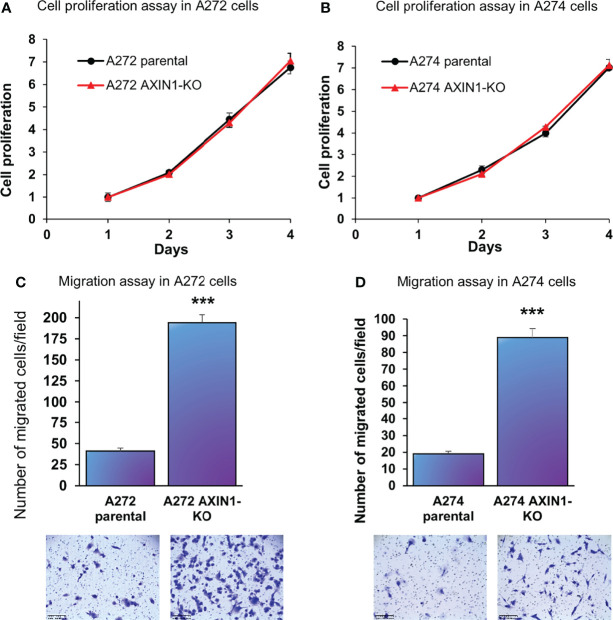
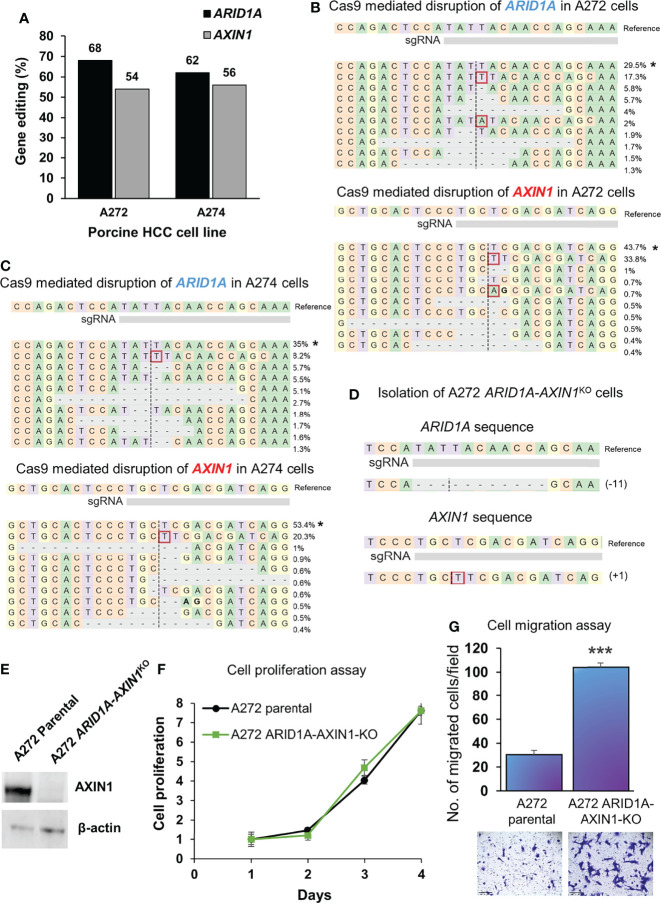
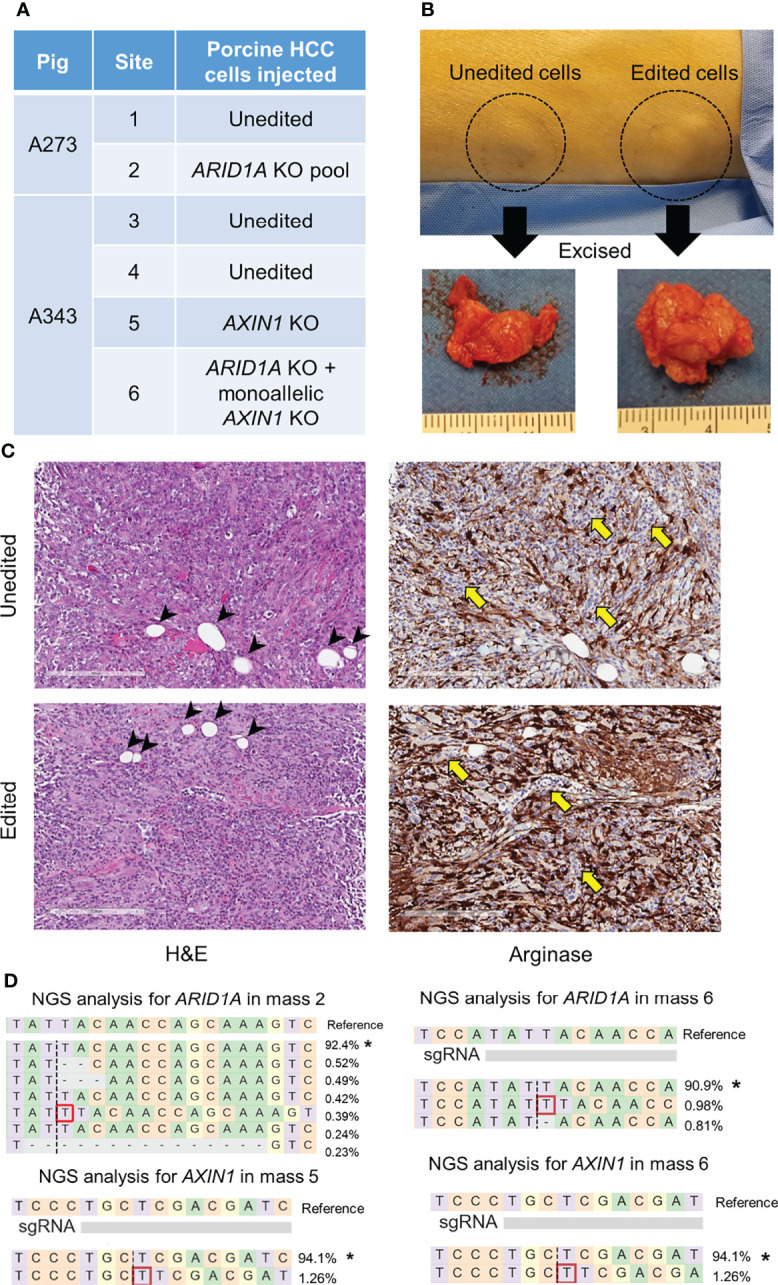
Hepatocellular carcinoma (HCC) is an aggressive disease lacking effective treatment. Animal models of HCC are necessary for preclinical evaluation of the safety and efficacy of novel therapeutics. Large animal models of HCC allow testing image-guided locoregional therapies, which are widely used in the management of HCC. Models with precise tumor mutations mimicking human HCC provide valuable tools for testing precision medicine. AXIN1 and ARID1A are two of the most frequently mutated genes in human HCC. Here, we investigated the effects of knockout of AXIN1 and/or ARID1A on proliferation, migration, and chemotherapeutic susceptibility of porcine HCC cells and we developed subcutaneous tumors harboring these mutations in pigs. Gene knockout was achieved by CRISPR/Cas9 and was validated by Next Generation Sequencing. AXIN1 knockout increased the migration of porcine HCC cells but did not alter the cell proliferation. Knockout of ARID1A increased both the proliferation and migration of porcine HCC cells. Simultaneous knockout of AXIN1 and ARID1A increased the migration, but did not alter the proliferation of porcine HCC cells. The effect of gene knockout on the response of porcine HCC cells to two of the most commonly used systemic and locoregional HCC treatments was investigated; sorafenib and doxorubicin, respectively. Knockout of AXIN1 and/or ARID1A did not alter the susceptibility of porcine HCC cells to sorafenib or doxorubicin. Autologous injection of CRISPR edited HCC cells resulted in development of subcutaneous tumors in pigs, which harbored the anticipated edits in AXIN1 and/or ARID1A. This study elucidates the effects of CRISPR-mediated knockout of HCC-associated genes in porcine HCC cells, and lays the foundation for development and utilization of genetically-tailored porcine HCC models for in vivo testing of novel therapeutic approaches in a clinically-relevant large animal model.

Keywords: ARID1A; AXIN1; CRISPR; gene knockout; hepatocellular carcinoma; liver cancer; porcine models.


Conflict of interest statement

LS, RG, and KS have received research support from the United States Department of Defense, the United States National Institutes of Health, Guerbet USA LLC, Janssen Research & Development LLC, NeoTherma Oncology, and TriSalus Life Sciences, and are scientific consultants for Sus Clinicals Inc. The remaining authors declare that the research was conducted in the absence of any commercial or financial relationships that could be construed as a potential conflict of interest.

Figures

Figure 1
Figure 1
CRISPR/Cas9 disruption of porcine AXIN1 gene. (A) Schematic representation of porcine AXIN1 locus showing the location of spacer sequences crRNA#1, crRNA#2, and crRNA#3 (underlined blue font). Protospacer adjacent motif (PAM) sequences are marked in red. (B) Comparing CRISPR/Cas9 editing efficiency of three individual AXIN1 targeting gRNAs. Porcine A272 HCC cells were transfected with ribonucleoproteins (RNPs) comprising Cas9 and each gRNA. Non-transfected cells were used as control. Genomic DNA was collected two days post-transfection and analyzed by targeted NGS. The bar graph depicts the percentages (%) of total reads that displayed indels at the gRNA target site occurring as a result of non-homologous end joining (NHEJ). (C) Type and frequency of AXIN1 indels detected by targeted NGS analysis mapped to the reference sequence. The percentage of reads for each sequence are shown on the right. The asterisk (*) indicates/marks non-edited reads. The top 10 reads are shown for cells transfected with gRNA#2 or gRNA#3. Dashed line, predicted Cas9 cleavage position; red box, insertion; dash, deleted base.
Figure 2
Figure 2
Generation of AXIN1 KO porcine HCC cells by CRISPR/Cas9. (A) CRISPR/Cas9-induced editing of AXIN1 in A272 and A274 porcine HCC cells using AXIN1 gRNA#2. Genomic DNA was collected two days post-transfection and analyzed by targeted NGS. The bar graph depicts the percentages (%) of total reads that displayed indels at the gRNA target site. (B) Top 10 reads detected by targeted NGS analysis in the two porcine HCC lines mapped to the reference sequence. The percentage of reads of each sequence are shown on the right. The asterisk (*) indicates/marks non-edited reads. Dashed line, predicted Cas9 cleavage position; red box, insertion; dash, deleted base. (C) Confirmation of AXIN1 protein depletion by Western blotting in A272 and A274 porcine HCC cell pools transfected with Cas9 and gRNA#2. The cells were lysed two days post-transfection and analyzed by Western blotting using an anti-AXIN1 antibody. β-actin was used as a loading control. (D–F) Analysis of AXIN1 KO single cell clones isolated from A272 and A274 porcine HCC cells transfected with Cas9 and AXIN1 gRNA#2. (D) Reads detected by targeted NGS analysis mapped to the reference sequence (top) for A272 and A274 AXIN1 KO cells. Dashed line, predicted Cas9 cleavage position; red box, insertion; dash, deleted base. (E) Schematic representation of predicted translation of AXIN1 protein in the isolated AXIN1 KO HCC cells. The dotted region represents amino acids with frameshift mutation. (F) Confirmation of complete loss of AXIN1 protein in A272 AXIN1 KO and A274 AXIN1 KO cells by Western blotting.
Figure 3
Figure 3
AXIN1 knockout increases the migration, but does not alter the proliferation, of porcine HCC cells. (A, B) Cell proliferation was determined for A272 (A) and A274 (B) parental and AXIN1 KO cells by MTS assay. Cell viability at different time points (days) was measured and expressed as A 490 normalized to values of day 1. Statistical analysis was conducted to compare viability of the different cell lines at each time point by two-way ANOVA. No significant difference was detected between the cell lines at p < 0.05. (C, D) Migration of A272 AXIN1 KO (C) and A274 AXIN1 KO (D) cells in comparison to parental cells was assessed by transwell cell migration assay. Quantitated migration ability is presented as the number of migrated cells per field. Values in the bar graph represent mean ± S.E. (n = 6 fields). ***, p < 0.0001. Representative images of migrated cells stained with crystal violet are shown below each bar graph. Scale bar, 250 μm.
Figure 4
Figure 4
Generation of ARID1A KO porcine HCC cells by CRISPR/Cas9. (A) CRISPR/Cas9-induced editing of ARID1A in A272 and A274 porcine HCC cells. Genomic DNA was collected two days post-transfection and analyzed by targeted NGS. The bar graph depicts the percentages (%) of total reads that displayed indels at the gRNA target site. (B) Top 10 reads detected by targeted NGS analysis in the two porcine HCC lines mapped to the reference sequence. The percentage of reads of each sequence are shown on the right. The asterisk (*) indicates/marks non-edited reads. Dashed line, predicted Cas9 cleavage position; red box, insertion; dash, deleted base. (C, D) Analysis of ARID1A KO single cell clones isolated from A272 and A274 porcine HCC cells transfected with Cas9 and ARID1A gRNA. (C) Reads detected by targeted NGS analysis mapped to the reference sequence for A272 and A274 ARID1A KO cells. Dashed line, predicted Cas9 cleavage position; red box, insertion; dash, deleted base. (D) Schematic representation of predicted translation of ARID1A protein in the isolated ARID1A KO HCC cells. The dotted region represents amino acids with frameshift mutation.
Figure 5
Figure 5
ARID1A knockout increases the proliferation and migration of porcine HCC cells. (A, B) Cell proliferation was determined for A272 (A) and A274 (B) parental and ARID1A KO cells by MTS assay. Cell viability at different time points (days) was measured and expressed as A 490 normalized to values of day 1. Statistical analysis was conducted to compare viability of the different cell lines at each time point by two-way ANOVA. *, p < 0.05; **, p < 0.005. (C, D) Migration of A272 ARID1A KO (C) and A274 ARID1A KO (D) cells in comparison to parental cells was assessed by transwell cell migration assay. Quantitated migration ability is presented as the number of migrated cells per field. Values in the bar graph represent mean ± S.E. (n = 6 fields). ***, p < 0.0001. Representative images of migrated cells stained with crystal violet are shown below each bar graph. Scale bar, 250 μm.
Figure 6
Figure 6
Simultaneous knockout of ARID1A and AXIN1 in Oncopig HCC cells increases the migration, but does not alter the proliferation of porcine HCC cells. (A) CRISPR/Cas9-induced editing of AXIN1 and ARID1A in A272 and A274 porcine HCC cells using AXIN1 gRNA#2 and ARID1A gRNA. Genomic DNA was collected two days post-transfection and analyzed by targeted NGS. The bar graph depicts the percentages (%) of total reads that displayed indels at the gRNA target site. (B, C) Top 10 reads detected by targeted NGS analysis in the two porcine HCC lines mapped to the reference sequence. The percentage of reads of each sequence are shown on the right. The asterisk (*) indicates/marks non-edited reads.. Dashed line, predicted Cas9 cleavage position; red box, insertion; dash, deleted base. (D) NGS Analysis of ARID1A-AXIN1 KO single cell clone isolated from A272 porcine HCC cells transfected with Cas9, AXIN1 gRNA#2, and ARID1A gRNA. Dashed line, predicted Cas9 cleavage position; red box, insertion; dash, deleted base. (E) Confirmation of complete loss of AXIN1 protein in A272 ARID1A-AXIN1 KO porcine HCC cells by Western blotting. The cells were lysed two days post-transfection and analyzed using an anti-AXIN1 antibody. β-actin was used as a loading control. (F) Cell proliferation was determined for A272 parental and ARID1A-AXIN1 KO cells by MTS assay. Cell viability at different time points (days) was measured and expressed as A 490 normalized to values of day 1. Statistical analysis was conducted to compare viability of the different cell lines at each time point by two-way ANOVA. No significant difference was detected between the cell lines at p < 0.05. (G) Migration of A272 ARID1A-AXIN1 KO cells in comparison to parental cells was assessed by transwell cell migration assay. Quantitated migration ability is presented as the number of migrated cells per field. Values in the bar graph represent mean ± S.E. (n = 6 fields). ***, p < 0.0001. Representative images of migrated cells stained with crystal violet are shown below each bar graph. Scale bar, 250 μm.
Figure 7
Figure 7
Knockout of ARID1A and/or AXIN1 does not alter the susceptibility of porcine HCC cells to sorafenib nor doxorubicin. A272 porcine HCC cells were incubated with serial dilutions of doxorubicin or sorafenib and viability was measured after 48 hours. Relative cell viability is plotted against log concentration of doxorubicin (A, C, E) or sorafenib (B, D, F). No significant difference was detected in log half-maximal inhibitory concentration (IC50) of parental A272 cells as compared to AXIN1 KO (A, B), ARID1A KO (C, D), or ARID1A-AXIN1 KO (E, F) cells at p < 0.05. IC50 values are shown in the figures.
Figure 8
Figure 8
Development of subcutaneous masses harboring CRISPR-induced ARID1A and/or AXIN1 edits in pigs. (A) Autologous unedited or CRISPR-edited porcine HCC cells were injected into distinct subcutaneous sites in 2 Oncopigs as presented in the table. (B) Representative image of two subcutaneous masses developed in pig flank 11 days post-injection of unedited or CRISPR-edited porcine HCC cells, at which point the masses were excised. (C) Representative microscopy images of H&E and Arginase staining of subcutaneous masses developed by injection of unedited or CRISPR-edited cells. The images show Arginase-stained porcine HCC cells (brown staining) surrounded by inflammatory cells (yellow arrows) and fat cells (arrow heads). Scale bar, 200 μm. (D) Reads detected by targeted NGS analysis in the three CRISPR-edited subcutaneous masses mapped to the reference sequences. The percentage of reads of each sequence are shown on the right. The asterisk (*) indicates/marks non-edited reads. Dashed line, predicted Cas9 cleavage position; red box, insertion; dash, deleted base.

References

    1. Sung H, Ferlay J, Siegel RL, Laversanne M, Soerjomataram I, Jemal A, et al. . Global Cancer Statistics 2020: GLOBOCAN Estimates of Incidence and Mortality Worldwide for 36 Cancers in 185 Countries. CA Cancer J Clin (2021) 71(3):209–49. doi: 10.3322/caac.21660 - DOI - PubMed
    1. Yarchoan M, Agarwal P, Villanueva A, Rao S, Dawson LA, Llovet JM, et al. . Recent Developments and Therapeutic Strategies Against Hepatocellular Carcinoma. Cancer Res (2019) 79(17):4326–30. doi: 10.1158/0008-5472.CAN-19-2958 - DOI - PMC - PubMed
    1. Llovet JM, Kelley RK, Villanueva A, Singal AG, Pikarsky E, Roayaie S, et al. . Hepatocellular Carcinoma. Nat Rev Dis Primers (2021) 7(1):6. doi: 10.1038/s41572-020-00240-3 - DOI - PubMed
    1. Llovet JM, De Baere T, Kulik L, Haber PK, Greten TF, Meyer T, et al. . Locoregional Therapies in the Era of Molecular and Immune Treatments for Hepatocellular Carcinoma. Nat Rev Gastroenterol Hepatol (2021) 18(5):293–313. doi: 10.1038/s41575-020-00395-0 - DOI - PubMed
    1. Nault JC, Martin Y, Caruso S, Hirsch TZ, Bayard Q, Calderaro J, et al. . Clinical Impact of Genomic Diversity From Early to Advanced Hepatocellular Carcinoma. Hepatology (2020) 71(1):164–82. doi: 10.1002/hep.30811 - DOI - PubMed

LinkOut - more resources