. 2022 May 20:13:892368.
doi: 10.3389/fimmu.2022.892368. eCollection 2022.

ZNF384: A Potential Therapeutic Target for Psoriasis and Alzheimer's Disease Through Inflammation and Metabolism

Affiliations

ZNF384: A Potential Therapeutic Target for Psoriasis and Alzheimer's Disease Through Inflammation and Metabolism

Shougang Liu et al. Front Immunol. .

Abstract

Background: Psoriasis is an immune-related skin disease notable for its chronic inflammation of the entire system. Alzheimer's disease (AD) is more prevalent in psoriasis than in the general population. Immune-mediated pathophysiologic processes may link these two diseases, but the mechanism is still unclear. This article aimed to explore potential molecular mechanisms in psoriasis and AD.

Methods: Gene expression profiling data of psoriasis and AD were acquired in the Gene Expression Omnibus (GEO) database. Gene Set Enrichment Analysis (GSEA) and single-sample GSEA (ssGSEA) were first applied in two datasets. Differentially expressed genes (DEGs) of two diseases were identified, and common DEGs were selected. Kyoto Encyclopedia of Genes and Genomes (KEGG) pathway enrichment analysis was performed to explore common biological pathways. Signature transcription factors (STFs) were identified and their diagnostic values was calculated by receiver operating characteristic (ROC) curve analysis in the exploration cohort and verified in the validation cohort. The expression levels of STFs were further investigated in the validation cohort and the GTEx Portal Database. Additionally, four kinds of interaction analysis were performed: correlation analysis among STFs, gene-gene, chemical-protein, and protein-ligand interaction analyses. In the end, we predicted the transcription factor that potentially regulates STFs.

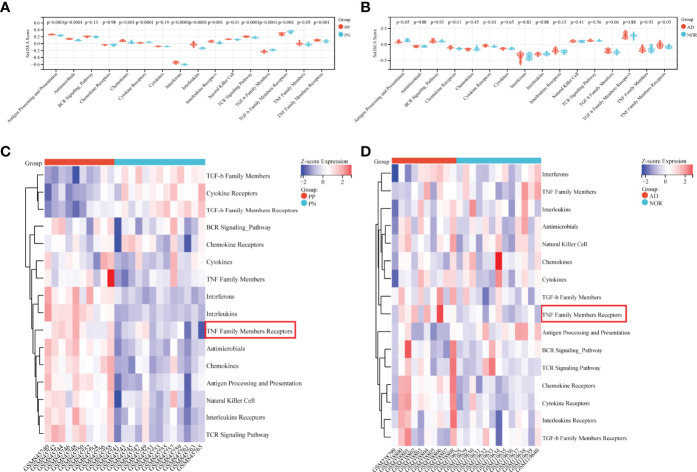
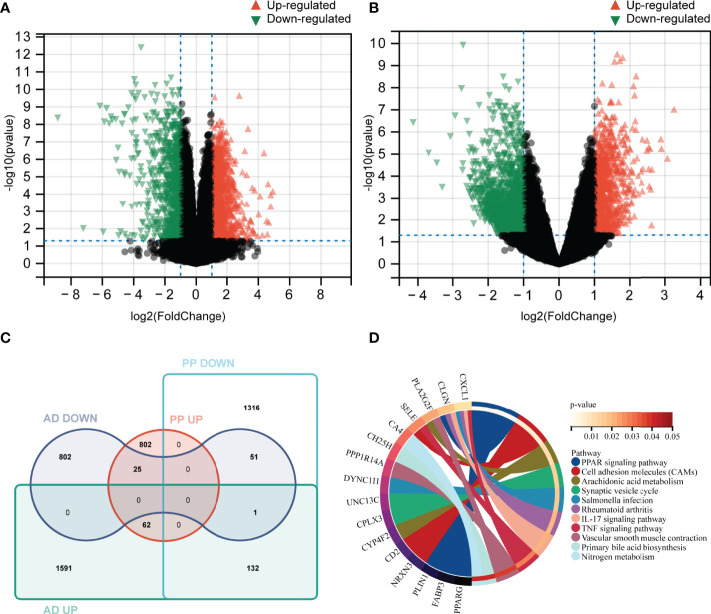
Results: Biosynthesis and metabolic pathways were enriched in GSEA analysis. In ssGSEA analysis, most immunoreaction gene lists exhibited differential enrichment in psoriasis cases, whereas three receptor-related gene lists did in AD. The KEGG analysis of common DEGs redetermined inflammatory and metabolic pathways essential in both diseases. 5 STFs (PPARG, ZFPM2, ZNF415, HLX, and ANHX) were screened from common DEGs. The ROC analysis indicated that all STFs have diagnostic values in two diseases, especially ZFPM2. The correlation analysis, gene-gene, chemical-protein, and protein-ligand interaction analyses suggested that STFs interplay and involve inflammation and aberrant metabolism. Eventually, ZNF384 was the predicted transcription factor regulating PPARG, ZNF415, HLX, and ANHX.

Conclusions: The STFs (PPARG, ZFPM2, ZNF415, HLX, and ANHX) may increase the morbidity rate of AD in psoriasis by initiating a positive feedback loop of excessive inflammation and metabolic disorders. ZNF384 is a potential therapeutic target for psoriasis and AD by regulating PPARG, ZNF415, HLX, and ANHX.

Keywords: Alzheimer’s disease; inflammation; metabolic disorders; psoriasis; transcription factors.


Conflict of interest statement

The authors declare that the research was conducted in the absence of any commercial or financial relationships that could be construed as a potential conflict of interest.

Figures

Figure 1
Figure 1
GSEA analysis in exploration cohort (GSE41664 for psoriasis and GSE5281 for AD). (A, B) GSEA plots for five KEGG pathways significantly enriched in GSE41664 and GSE5281. Screening criteria of selected KEGG pathways: biological functions of pathways, FDR value < 0.25, and p-value < 0.05. ES, Enrichment Score, FDR, False Discovery Rate.
Figure 2
Figure 2
Immunoreaction-related ssGSEA analysis in GSE41664 and GSE5281. (A, B) SsGSEA scores of immunoreaction gene lists in each subgroup in GSE41664 and GSE5281. (C, D) Heatmap of immunoreaction gene lists in GSE41664 and GSE5281. P-value < 0.05 were considered statistically significant. PN, non-lesion skin tissue of plaque psoriasis; PP, lesion skin tissue of plaque psoriasis; NOR, hippocampus tissue of the normal aged; AD, hippocampus tissue of AD.
Figure 3
Figure 3
Identification of DEGs and common DEGs, KEGG pathways analysis. (A, B) Volcano plot of differentially expressed genes between case and control groups in GSE41664 and GSE5281 (|log2FC| > 1 and p-value < 0.05). (C) identification of common DEGs in psoriasis and AD using Venn tools. (D) Enriched signature KEGG pathways of common DEGs (p-value <0.05). PP UP, upregulated gene set in lesion skin of plaque psoriasis; PP DOWN, down-regulated gene set in lesion skin of plaque psoriasis; AD UP, upregulated gene set in AD; AD DOWN, down-regulated gene set in AD.
Figure 4
Figure 4
Identification, ROC curve analysis, and correlation analysis of STFs in exploration cohort. (A) identification of STFs by Venn diagrams. (B, C) ROC curve analysis of each STFs in GSE41664 and GSE5281. STF whose AUC values > 0.60 in psoriasis and AD was considered with diagnostic value; STF whose AUC values > 0.80 was considered with high diagnostic values. (D, E) correlation analysis among STFs in GSE41664 and GSE5281. Each cell contains the Pearson correlation coefficient and p-value. P-value < 0.05 and Pearson correlation coefficient (PCC) > 0. 85 were considered as correlated, while p-value < 0.05 and PCC > 0. 95 strongly correlated. * p-value <0.05; ** p-value <0.01. TFs, transcription factors from the Human Transcription Factors Database.
Figure 5
Figure 5
STFs diagnostic values and gene expression level in the validation cohort. (A, B) ROC curve analysis of STFs in GSE53552 and GSE48350. (C, D) gene expression levels of STFs in GSE53552 and GSE48350. Gene expression levels differentiated (p-value < 0.05) between case and control groups were regarded as statistically significant.
Figure 6
Figure 6
STFs expression levels in GTEx Portal database. (A–E) STFs expression levels in skin and hippocampus tissue. Skin tissue contained cultured fibroblasts cells, not sun exposed and sun exposed skin. TPM, Transcripts Per Million.
Figure 7
Figure 7
Gene-gene interactions networks of each STF. (A–D) Gene networks of 4 STFs. The networks were constructed by the UCSC database, and visualized in circle maps by Cytoscape version 3.9.0.
Figure 8
Figure 8
Chemical-protein interaction networks of each STF. (A–E) STFs Chemical-protein networks performed in the STITCH database. Stronger associations were represented by thicker lines; protein-protein interactions were shown in grey; chemical-protein interactions in green; and interactions between chemicals in red.
Figure 9
Figure 9
Protein-ligand docking pockets of each STF. (A–E) Binding pockets with highest affinities while 5 STFs docking with the IL-17A or the TNF-α antagonist. LYS, Lysine residue; GLU, Glutamate residue; TYR, Tyrosine residue; SER, Serine residue; PHE, Phenylalanine residue; HIS, Histidine residue; THR, Threonine residue; TRP, Tryptophan residue.
Figure 10
Figure 10
Prediction of upstream transcription factors regulating STFs. (A–D) potential upstream transcription factors of STFs. The diagram above presented the gene location in the chromosome; the red line indicated the promoter binding regions (2100bps); the diagram below is a zoomed-in view of the potential promoter regions; all predicted transcription factors that qualified for the threshold were located in their potential binding positions.

Similar articles

Cited by

References

    1. Boehncke W-H, Schön MP. Psoriasis. Lancet Lond Engl (2015) 386:983–94. doi: 10.1016/s0140-6736(14)61909-7 - DOI - PubMed
    1. Griffiths CE, Barker JN. Pathogenesis and Clinical Features of Psoriasis. Lancet Lond Engl (2007) 370:263–71. doi: 10.1016/s0140-6736(07)61128-3 - DOI - PubMed
    1. Griffiths CEM, Armstrong AW, Gudjonsson JE, Barker JNWN. Psoriasis. Lancet Lond Engl (2021) 397:1301–15. doi: 10.1016/s0140-6736(20)32549-6 - DOI - PubMed
    1. Greb JE, Goldminz AM, Elder JT, Lebwohl MG, Gladman DD, Wu JJ, et al. . Psoriasis. Nat Rev Dis Primer (2016) 2:16082. doi: 10.1038/nrdp.2016.82 - DOI - PubMed
    1. Dauden E, Blasco AJ, Bonanad C, Botella R, Carrascosa JM, González-Parra E, et al. . Position Statement for the Management of Comorbidities in Psoriasis. J Eur Acad Dermatol Venereol JEADV (2018) 32:2058–73. doi: 10.1111/jdv.15177 - DOI - PubMed