. 2022 May 20:13:914236.
doi: 10.3389/fimmu.2022.914236. eCollection 2022.

Single-Cell Transcriptomics Revealed Subtype-Specific Tumor Immune Microenvironments in Human Glioblastomas

Affiliations

Single-Cell Transcriptomics Revealed Subtype-Specific Tumor Immune Microenvironments in Human Glioblastomas

Yong Xiao et al. Front Immunol. .

Abstract

Human glioblastoma (GBM), the most aggressive brain tumor, comprises six major subtypes of malignant cells, giving rise to both inter-patient and intra-tumor heterogeneity. The interaction between different tumor subtypes and non-malignant cells to collectively shape a tumor microenvironment has not been systematically characterized. Herein, we sampled the cellular milieu of surgically resected primary tumors from 7 GBM patients using single-cell transcriptome sequencing. A lineage relationship analysis revealed that a neural-progenitor-2-like (NPC2-like) state with high metabolic activity was associated with the tumor cells of origin. Mesenchymal-1-like (MES1-like) and mesenchymal-2-like (MES2-like) tumor cells correlated strongly with immune infiltration and chronic hypoxia niche responses. We identified four subsets of tumor-associated macrophages/microglia (TAMs), among which TAM-1 co-opted both acute and chronic hypoxia-response signatures, implicated in tumor angiogenesis, invasion, and poor prognosis. MES-like GBM cells expressed the highest number of M2-promoting ligands compared to other cellular states while all six states were associated with TAM M2-type polarization and immunosuppression via a set of 10 ligand-receptor signaling pathways. Our results provide new insights into the differential roles of GBM cell subtypes in the tumor immune microenvironment that may be deployed for patient stratification and personalized treatment.

Keywords: M2-type polarization; cell-to-cell interaction; cellular state; glioblastoma; hypoxia; single-cell RNA sequencing; tumor-associated macrophage.


Conflict of interest statement

RF is co-founder of IsoPlexis and Singleron Biotechnologies with financial interest. The remaining authors declare that the research was conducted in the absence of any commercial or financial relationships that could be construed as a potential conflict of interest.

Figures

Figure 1
Figure 1
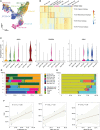
Dissection of primary GBM by scRNA-seq. (A) Scheme of the workflow in our study. (B) UMAP projection of all 20,289 GBM cells including tumor cells and stromal cells. Eight clusters were found when index Resolution in Seurat FindClusters was set as 0.05. (C) UMAP visualization showing cells of individuals. (D) UMAP of malignancy scores. Transformed cells had higher malignancy scores and were colored with red, while non-tumor cells had lower malignancy scores and were in blue. (E) Evaluation of copy number variations (CNVs). Compared to oligodendrocytes, malignant cells presented with obvious CNVs. Red, amplification; blue, deletion. (F) Dot plot of cell marker gene expression level. (G) Annotation of cell types in GBM. The majority of GBM cells were malignant cells and TAMs, and GBM still had a small number of normal oligodendrocytes, endothelial cells, pericytes, and T cells. (H) Composition ratio of cell types in individual GBM. See also Supplementary Figure 1 .
Figure 2
Figure 2
Identification of six GBM tumor cell cellular states. (A) UMAP projection of the six GBM tumor cell cellular states and stem-like cells. (B) Heatmap of the four GBM TCGA transcription subtype scores. (C) Violin plot of EGFR, PDGFRA, and CDK4 expression level in different cellular states. (D) Composition ratio of the six cellular states in tumor cells. (E) Composition ratio of stromal cells in non-tumor cells. (F) Correlation between the number of MES-like cells and TAMs. See also Supplementary Figure 2 and Supplementary Table 3 .
Figure 3
Figure 3
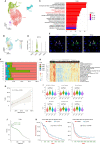
NPC2-like cells, the original root cell of GBM. (A) Inferred developmental trajectory of the six GBM tumor cell cellular states by RNA velocity, which implied that the NPC2-like cells, like stem-like cells, were the root cell of the developmental trajectory. (B) The activated regulons ranked by regulon specificity score from high to low in the NPC2-like cells. (C) Heatmap of cancer-specific gene sets in the six cellular states and stem-like cells. (D) Violin plot of the Mitotic Spindle, Cell Cycle, and G2M Check Point gene set scores in the six cellular states and stem-like cells. NPC2-like cells, like stem-like cells, were in the cell cycle. (E) Heatmap of metabolism gene sets in the six cellular states and stem-like cells. NPC2-like cells had a higher metabolism level than other cellular states. Gray dash line, average score; ****p < 0.0001. See also Supplementary Figure 3 and Supplementary Table 4 .
Figure 4
Figure 4
Hypoxia-response tumor cells in GBM. (A) Heatmap of cancer-specific gene sets in the six cellular states and stem-like cells. (B) Upregulated immune gene pattern in MES1-like and MES2-like cells. (C) High expressed genes related to angiogenesis, hypoxia, and invasion in MES1-like and MES2-like cells. Violin plot of the hypoxia (D), and epithelial–mesenchymal transition and metastasis (E) gene set scores in the six cellular states and stem-like cells. MES1-like and MES2-like cells were the hypoxia-response tumor cells in GBM. The activated regulons in the MES1-like (F) and MES2-like (G) cells ranked by regulon specificity score from high to low. Survival analysis of the MES1-like (H) and MES2-like (I) cell signatures in TCGA and CGGA GBM databases, respectively. Gray dash line, average score; ns, no significance; **p < 0.01; ****p < 0.0001. See also Supplementary Figure 4 and Supplementary Table 4 .
Figure 5
Figure 5
Hypoxia-response TAMs in GBM. (A) UMAP visualization of TAMs. (B) UMAP visualization showing TAMs of individuals. (C) Top 20 function analysis results of TAM-1 cluster. Hypoxia-related biological processes were colored in red. (D) Violin plot of ERO1A expression level in different TAM clusters. (E) Immunofluorescence staining for TAM-1 cluster (CD14+ERO1A+) in patient tumor sample. The staining was performed for seven patients, one section each, and a representative image from patient 6 with TAM-1 pointed out by white arrows was shown; scale, 10 μm. The other images are shown in Supplementary Supplementary Figure 6 . (F) Composition ratio of the TAM clusters in individual GBM. (G) Correlation between the number of MES-like and TAM-1 cells. (H) Heatmap of specific gene sets in TAMs. (I) Violin plot of the hypoxia gene set scores in TAMs. TAM-1 was the hypoxia-response cluster in TAMs. (J) The activated regulons in the TAM-1 cluster ranked by the regulon specificity score from high to low. (K) Survival analysis of the TAM-1 cluster signatures in TCGA and CGGA GBM databases, respectively. Gray dash line, average score; ****p < 0.0001. See also Supplementary Figures 5 and 6 , and Supplementary Tables 3 and 6 .
Figure 6
Figure 6
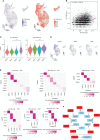
Role of hypoxia-response cells in angiogenesis. (A) Cluster of GBM cell types according to the source cell functions in cell–cell communication. Hypoxia-response cell types, namely, MES1-like, MES2-like, and TAM-1 cells, were in the same pattern 5. (B) Compared to oligodendrocytes, TAM-1 cells presented with obvious CNVs in chromosome 6, but no CNVs in chromosomes 7 and 10. Red, amplification; blue, deletion. (C) Cell–cell communication-related pathways in different outgoing cell patterns. (D) Dot plot of outgoing cell pattern 5-related ligand–receptor pairs. (E) Violin plot of VEGF pathway-related ligand expression levels. (F) Violin plot of the angiogenesis gene set scores in GBM tumor cells and TAMs, respectively. Hypoxia-response cells, namely, MES1-like, MES2-like, and TAM-1 cells, had the highest score. Commun., communication; Prob., probability; gray dash line, average score; **p < 0.01; ****p < 0.0001. See also Supplementary Figure 7 .
Figure 7
Figure 7
Role of GBM tumor cells in promoting TAM M2-type polarization. (A) UMAP projection showed the M1-TAM score and M2-TAM score in TAMs. (B) Correlation between M1-TAM score and M2-TAM score in TAMs. (C) Violin plot of the M1-TAM score and M2-TAM score in different TAM clusters. (D) Expression levels of M2-TAM marker genes, namely, CD163, MRC1, and CD36, in TAMs. (E) Ligand–receptor pairs from different GBM tumor cellular state cells to TAMs took part in TAM M2-type polarization. (F) Ten L–R pairs, in total, could promote TAM M2-type polarization. Gray dash line, average score; ****p < 0.0001. See also Supplementary Figure 8 .

References

    1. Dagogo-Jack I, Shaw AT. Tumour Heterogeneity and Resistance to Cancer Therapies. Nat Rev Clin Oncol (2018) 15(2):81–94. doi: 10.1038/nrclinonc.2017.166 - DOI - PubMed
    1. Tirosh I, Suva ML. Dissecting Human Gliomas by Single-Cell Rna Sequencing. Neuro Oncol (2018) 20(1):37–43. doi: 10.1093/neuonc/nox126 - DOI - PMC - PubMed
    1. Verhaak RG, Hoadley KA, Purdom E, Wang V, Qi Y, Wilkerson MD, et al. . Integrated Genomic Analysis Identifies Clinically Relevant Subtypes of Glioblastoma Characterized by Abnormalities in Pdgfra, Idh1, Egfr, and Nf1. Cancer Cell (2010) 17(1):98–110. doi: 10.1016/j.ccr.2009.12.020 - DOI - PMC - PubMed
    1. Wang Q, Hu B, Hu X, Kim H, Squatrito M, Scarpace L, et al. . Tumor Evolution of Glioma-Intrinsic Gene Expression Subtypes Associates With Immunological Changes in the Microenvironment. Cancer Cell (2018) 33(1):152. doi: 10.1016/j.ccell.2017.12.012 - DOI - PMC - PubMed
    1. Neftel C, Laffy J, Filbin MG, Hara T, Shore ME, Rahme GJ, et al. . An Integrative Model of Cellular States, Plasticity, and Genetics for Glioblastoma. Cell (2019) 178(4):835–49.e21. doi: 10.1016/j.cell.2019.06.024 - DOI - PMC - PubMed

Publication types