. 2022;64(2):147-190.
doi: 10.1007/s11166-022-09375-y. Epub 2022 Jun 2.

Fatalism, beliefs, and behaviors during the COVID-19 pandemic

Affiliations

Fatalism, beliefs, and behaviors during the COVID-19 pandemic

Jesper Akesson et al. J Risk Uncertain. 2022.

Abstract

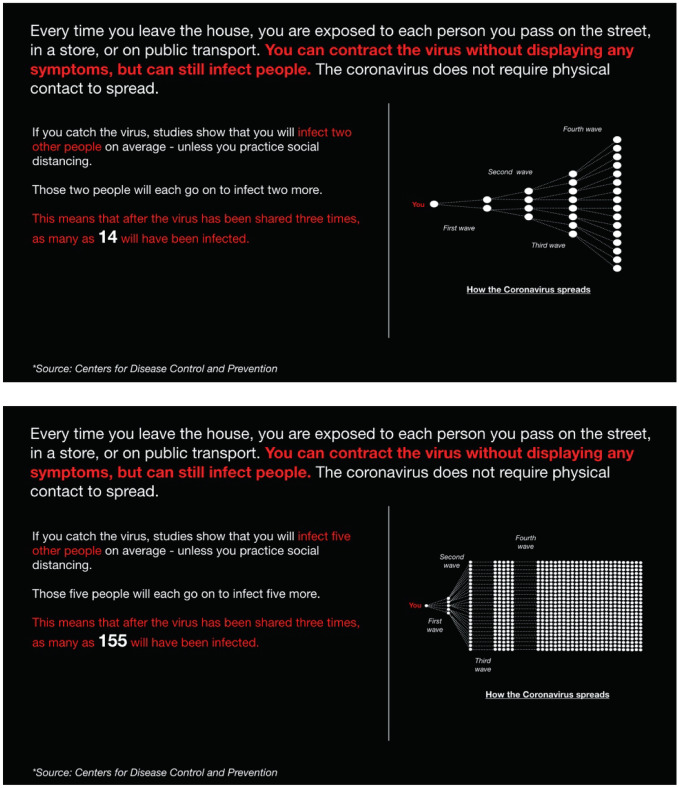
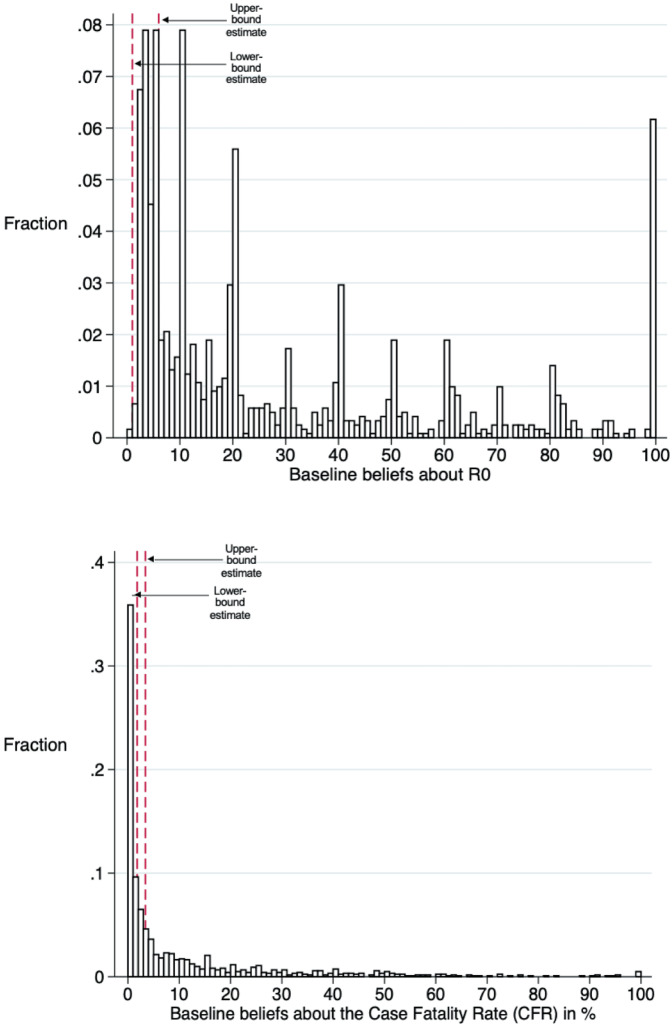
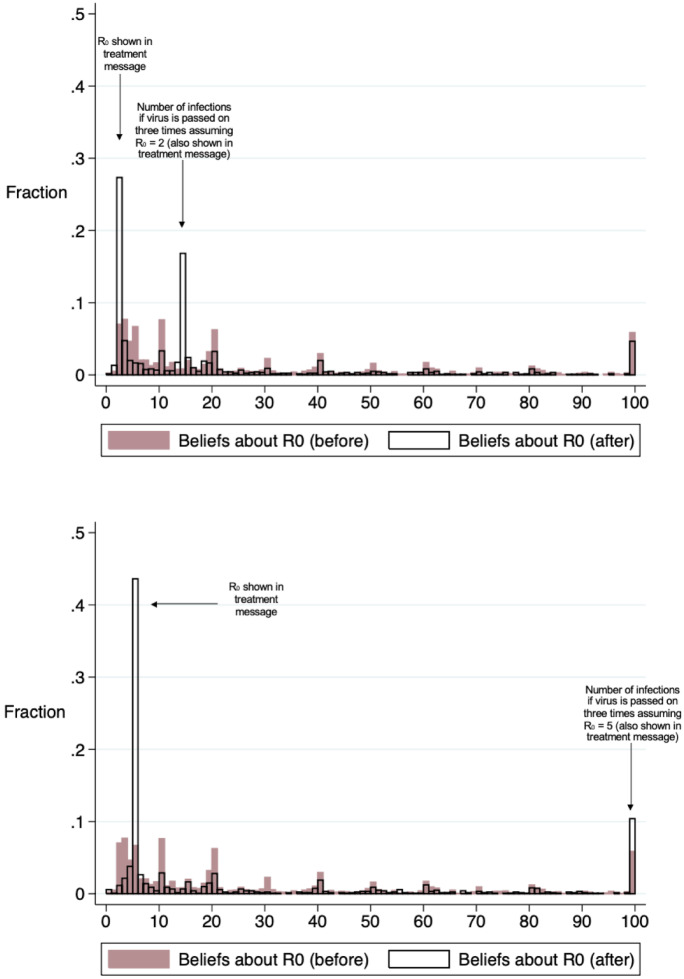
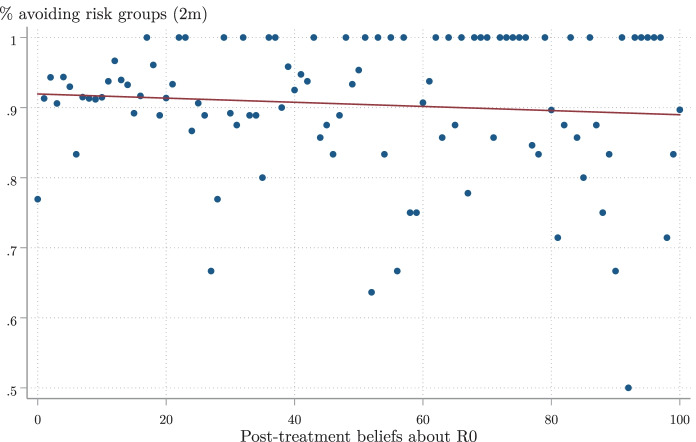
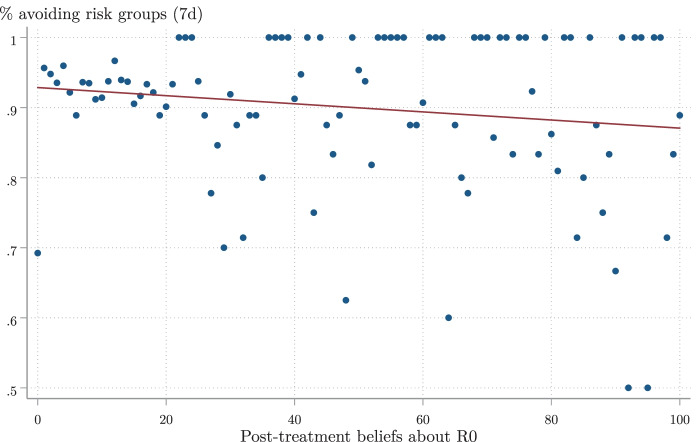
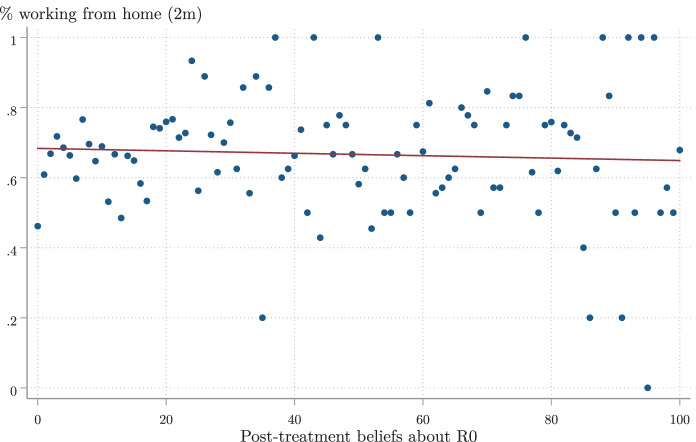
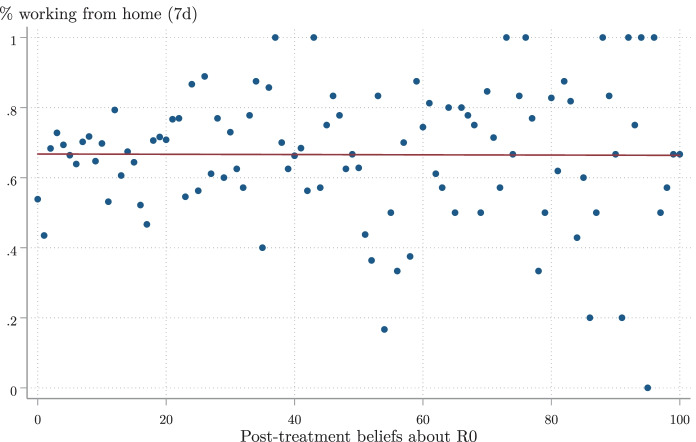
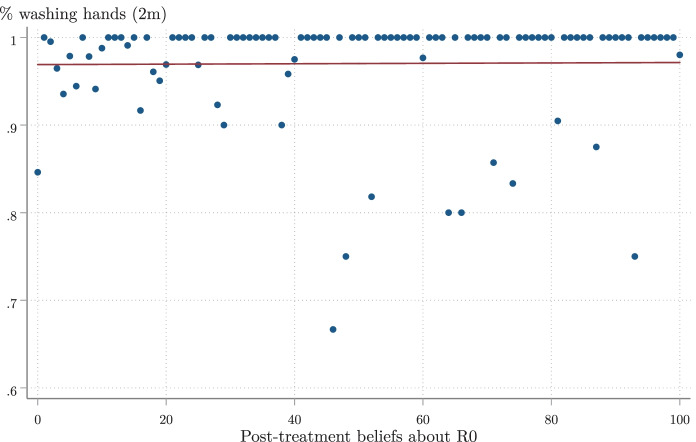
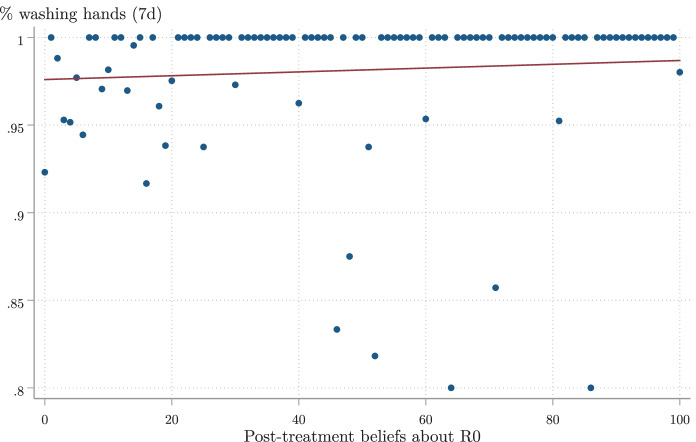
Little is known about how people's beliefs concerning the Coronavirus Disease 2019 (COVID-19) influence their behavior. To shed light on this, we conduct an online experiment ( n = 3 , 610 ) with US and UK residents. Participants are randomly allocated to a control group or to one of two treatment groups. The treatment groups are shown upper- or lower-bound expert estimates of the infectiousness of the virus. We present three main empirical findings. First, individuals dramatically overestimate the dangerousness and infectiousness of COVID-19 relative to expert opinion. Second, providing people with expert information partially corrects their beliefs about the virus. Third, the more infectious people believe that COVID-19 is, the less willing they are to take protective measures, a finding we dub the "fatalism effect". We develop a formal model that can explain the fatalism effect and discuss its implications for optimal policy during the pandemic.

Keywords: Beliefs; COVID-19; Fatalism; Online experiment.


Conflict of interest statement

Conflict of interestWe have no conflicts of interest or competing interests to declare.

Figures

Fig. 1
Fig. 1
Treatment messages. Notes. The first image displays the treatment message showed to the lower-bound group. The second image displays the treatment message showed to the upper-bound group
Fig. 2
Fig. 2
Baseline prior beliefs about R0 and the CFR. Notes. The first diagram displays the distribution of beliefs regarding the infectiousness of COVID-19 (R0) at baseline. The second displays the distribution of beliefs regarding case fatality rate (CFR) at baseline. Participants’ perceived CFR is calculated by multiplying their belief regarding the risk of being hospitalized conditional on contracting COVID-19 by the risk of dying conditional on being hospitalized for COVID-19. See Appendix F for the exact questions that were used to construct these variables
Fig. 3
Fig. 3
Effect of treatments on posterior beliefs of R0. Notes. The first diagram displays the distribution of beliefs about R0 in the lower-bound group pre- (prior) and post-treatment (posterior). The second diagram displays the distribution of beliefs about R0 in the upper-bound group pre- and post-treatment. Participants can enter any number between 0 and 100 when stating their beliefs about R0
Fig. 4
Fig. 4
Raw associations I. Notes. This figure plots the share who state that they are willing to avoid high-risk groups within the next two months given every possible value of R0. No attempt is made to control for confounding variables
Fig. 5
Fig. 5
Raw associations II. Notes. This figure plots the share who state that they are willing to avoid high-risk groups within the next seven days given every possible value of R0. No attempt is made to control for confounding variables
Fig. 6
Fig. 6
Raw associations III. Notes. This figure plots the share who state that they will work from home within the next two months given every possible value of R0. No attempt is made to control for confounding variables
Fig. 7
Fig. 7
Raw associations IV. Notes. This figure plots the share who state that they will work from home within the next seven days given every possible value of R0. No attempt is made to control for confounding variables
Fig. 8
Fig. 8
Raw associations V. Notes. This figure plots the share who state that they will regularly wash their hands over the next two months given every possible value of R0. No attempt is made to control for confounding variables
Fig. 9
Fig. 9
Raw associations VI. Notes. This figure plots the share who state that they will regularly wash their hands over the next seven days given every possible value of R0. No attempt is made to control for confounding variables

References

    1. Abeler J, Nosenzo D, Raymond C. Preferences for truth-telling. Econometrica. 2019;87:1115–1153. doi: 10.3982/ECTA14673. - DOI
    1. Acemoglu, D., Chernozhukov, V., Werning, I., & Whinston, M. D. (2020). A multi-risk SIR model with optimally targeted lockdown. NBER Working Papers.
    1. Akerlof, G. A., & Shiller, R. J. (2010). Animal spirits: How human psychology drives the economy, and why it matters for global capitalism. Princeton University Press.
    1. Alvarez, F. E., Argente, D., & Lippi, F. (2020). A simple planning problem for COVID-19 lockdown. NBER Working Papers.
    1. Anderson RM, Heesterbeek H, Klinkenberg D, Hollingsworth TD. How will country-based mitigation measures influence the course of the Covid-19 epidemic? The Lancet. 2020;395:931–934. doi: 10.1016/S0140-6736(20)30567-5. - DOI - PMC - PubMed

LinkOut - more resources