. 2022 Jun 28;7(3):e0017222.
doi: 10.1128/msystems.00172-22. Epub 2022 Jun 7.

Dietary Exposure to Antibiotic Residues Facilitates Metabolic Disorder by Altering the Gut Microbiota and Bile Acid Composition

Affiliations

Dietary Exposure to Antibiotic Residues Facilitates Metabolic Disorder by Altering the Gut Microbiota and Bile Acid Composition

Rou-An Chen et al. mSystems. .

Abstract

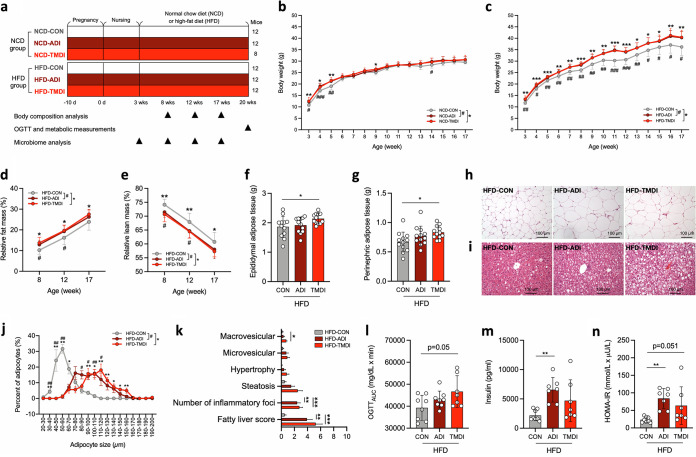
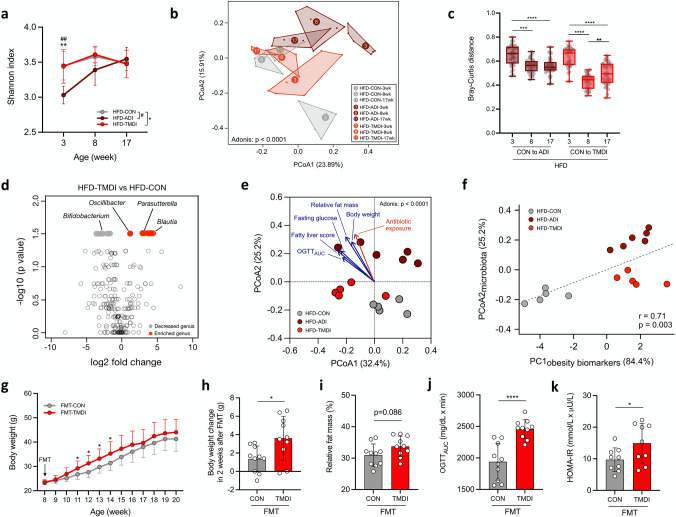
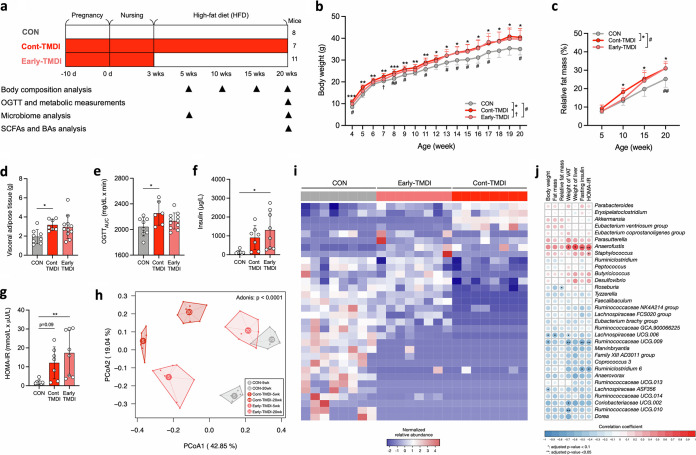
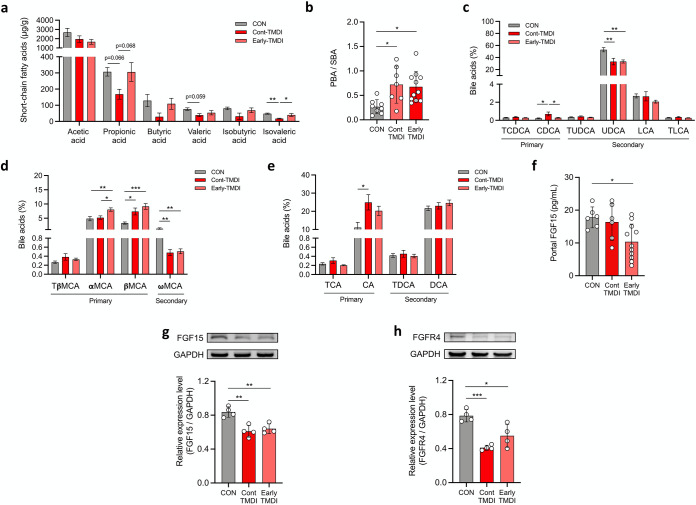
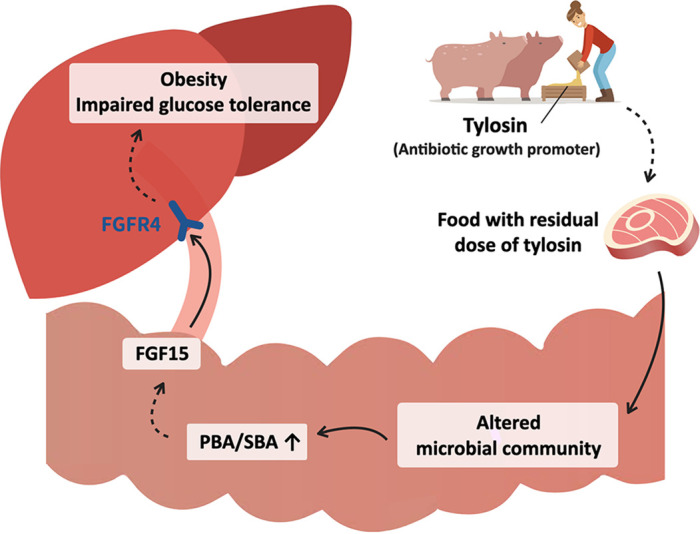
Antibiotics used as growth promoters in livestock and animal husbandry can be detected in animal-derived food. Epidemiological studies have indicated that exposure to these antibiotic residues in food may be associated with childhood obesity. Herein, the effect of exposure to a residual dose of tylosin-an antibiotic growth promoter-on host metabolism and gut microbiota was explored in vivo. Theoretical maximal daily intake (TMDI) doses of tylosin were found to facilitate high-fat-diet-induced obesity, induce insulin resistance, and perturb gut microbiota composition in mice. The obesity-related phenotypes were transferrable to germfree recipient mice, indicating that the effects of a TMDI dose of tylosin on obesity and insulin resistance occurred mainly via alteration of the gut microbiota. Tylosin TMDI exposure restricted to early life, the critical period of gut microbiota development, altered the abundance of specific bacteria related to host metabolic homeostasis later in life. Moreover, early-life exposure to tylosin TMDI doses was sufficient to modify the ratio of primary to secondary bile acids, thereby inducing lasting metabolic consequences via the downstream FGF15 signaling pathway. Altogether, these findings demonstrate that exposure to very low doses of antibiotic residues, whether continuously or in early life, could exert long-lasting effects on host metabolism by altering the gut microbiota and its metabolites. IMPORTANCE This study demonstrates that even with limited exposure in early life, a residual dose of tylosin might cause long-lasting metabolic disturbances by altering the gut microbiota and its metabolites. Our findings reveal that the gut microbiota is susceptible to previously ignored environmental factors.

Keywords: bile acid metabolism; dietary exposure; early life; food safety; gut microbiota; low-dose antibiotic; metabolic disorder; obesity.


Conflict of interest statement

The authors declare no conflict of interest.

Figures

FIG 1
FIG 1
Residual dose of tylosin facilitates HFD-induced obesity and metabolic disorders. (a) Experimental design of antibiotic residue exposure model. (b) Body weight changes in NCD (n = 12, 12, and 8 mice per group) and (c) HFD-fed mice (n = 12 mice per group). (d) Relative fat mass and (e) relative lean mass changes in HFD mice (n = 12 mice per group). (f) Weight of epididymal adipose tissue and (g) perinephric adipose tissue (n = 12 mice per group). (h) Representative histological features of H&E stained epididymal adipose tissue and (i) and liver. (j) Adipocyte diameter of epididymal adipose tissue (n = 6 mice per group). (k) Fatty liver score, including steatosis (macrovesicular, microvesicular, and hypertrophy) and inflammation (number of inflammatory foci) (n = 12, 12, and 8 mice per group). (l) Area under the curve (AUC) derived from the OGTT (n = 8, 8, and 7 mice per group). (m) Plasma insulin level after overnight fasting (n = 8, 7, and 7 mice per group). (n) HOMA-IR index represented as an indicator of insulin resistance (n = 8, 7, and 7 mice per group). Data are means and SD. For panels b to e and j, statistical analyses were performed by one-way ANOVA with Tukey’s range test within diet groups (NCD or HFD) as follows: CON versus ADI (#, P < 0.05; ##, P < 0.01); CON versus TMDI (*, P < 0.05; **, P < 0.01; ***, P < 0.001). For panels f, g, and k to n, one-way ANOVA with Tukey’s range test was performed (*, P < 0.05; **, P < 0.01; ***, P < 0.001). Abbreviations: ADI, acceptable daily intake; AUC, area under the curve; CON, control; HFD, high-fat diet; HOMA-IR, homeostatic model assessment of insulin resistance; NCD, normal chow diet; OGTT, oral glucose tolerance test; TMDI, theoretical maximum daily intake.
FIG 2
FIG 2
Residual dose of tylosin remodels the gut microbiota composition, and their microbiota shift verifies its pathogenesis on generating the obesogenic and metabolic phenotype in germfree mice. (a) Change in Shannon diversity index in 3-, 8-, and 17-week-old HFD-fed mice (n = 6 mice per group). (b) Gut microbiota composition as represented by principal-coordinate analysis (PCoA) of Bray-Curtis distances for 3-, 8-, and 17-week-old HFD-fed mice (n = 6 mice per group). The PCoA analysis of data from both HFD and NCD mice is shown in Fig. S3a. (c) Bray-Curtis dissimilarity index comparing distances of tylosin-treated groups to CON at different time points (n = 6 mice per group). (d) Volcano plot showing bacterial taxa whose abundance was increased or decreased (based on a log2 fold change of >1) and significant difference (P < 0.05) estimated using the Wilcoxon signed-rank test (n = 6 mice per group). (e) Bray-Curtis distance-based PCoA of 17-week-old HFD-fed mice’s gut microbiota and the fitted antibiotic exposure/obesity-related variables, which significantly correlated with the shifted microbiome (P < 0.05) using the envfit package in R (n = 5, 5, and 6 mice per group). (f) Spearman’s correlation of PCoA2microbiota and PC1obesity biomarkers (n = 5, 5, and 6 mice per group). (g) Body weight change in germ-free mice transplanted with feces of HFD-CON and HFD-TMDI mice (n = 10 mice per group). (h) Body weight change 2 weeks posttransplantation (n = 10 mice per group). (i) Relative fat mass at 20 weeks of age (n = 10 mice per group). (j) AUC derived from the OGTT (n = 9 mice per group). (k) HOMA-IR index (n = 9 mice per group). Data are means and SD. For panel a, statistical analyses were performed with the Wilcoxon signed-rank test as follows: HFD-CON versus HFD-ADI (##, P < 0.01) and HFD-CON versus HFD-TMDI (**, P < 0.01). For panel b and e, Adonis was performed to test the difference among groups. For panel c, one-way ANOVA with Tukey’s range test was performed (**, P < 0.01; ***, P < 0.001; ****, P < 0.0001). For panel e, envfit was performed to fit obesity-related variables and tylosin doses onto PCoA ordination of gut microbiota composition. For panels g to k, unpaired two-tailed t test was performed (*, P < 0.05; ****, P < 0.0001). Abbreviations: AUC, area under the curve; CON, control; FMT, fecal microbiota transplantation; HOMA-IR, homeostatic model assessment of insulin resistance; OGTT, oral glucose tolerance test; TMDI, theoretical maximum daily intake.
FIG 3
FIG 3
Early-life exposure to tylosin residue sufficiently induces obesity and metabolic disorder disease and modifies gut microbiota composition by enhancing the restructuring of obesity-related genera with deep-rooted changes. (a) Experimental design of early-life exposure model. (b) Body weight change (n = 8, 7, and 11 mice per group). (c) Relative fat mass change (n = 8, 7, and 11 mice per group). (d) Weight of visceral adipose tissue (n = 8, 7, and 11 mice per group). (e) AUC derived from the OGTT (n = 8, 6, and 11 mice per group). (f) Fasting Insulin (n = 7, 7, and 8 mice per group). (g) HOMA-IR index (n = 7, 7, and 8 mice per group). (h) PCoA based on Bray-Curtis distances of gut microbiota at 5 and 20 weeks of age (n = 8 mice per group). (i) Heat map showing 32 bacterial genus with significant differences (q < 0.05) among groups and (j) their Spearman’s correlation with obesity-related variables (n = 8 mice per group). Data are means and SD. For panels b and c, statistical analyses were performed with one-way ANOVA with Tukey’s range test as follows: CON versus early-TMDI (#, P < 0.05; ##, P < 0.01), CON versus Cont-TMDI (*, P < 0.05; **, P < 0.01; ***, P < 0.001), or Cont-TMDI versus early-TMDI (†, P < 0.05). For panels d to g, one-way ANOVA with Tukey’s range test was performed (*, P < 0.05; **, P < 0.01). For panel h, Adonis was performed to test the difference among groups. For panel i, a Kruskal-Wallis test with an FDR-adjusted P value was performed (q < 0.05). For panel j, Spearman’s correlation was performed with an FDR-adjusted P value (*, q < 0.1; **, q < 0.05). Abbreviations: AUC, area under the curve; CON, control; HFD, high-fat diet; HOMA-IR, homeostatic model assessment of insulin resistance; OGTT, oral glucose tolerance test; TMDI, theoretical maximum daily intake.
FIG 4
FIG 4
The modification of the fecal primary-secondary bile acid ratio by the gut microbiota and downregulation of the FGF15 signaling pathway are involved in the obesogenic and metabolic dysfunctions caused by tylosin residue exposure at TMDI dose. (a) Fecal short-chain-fatty-acid levels (n = 7 mice per group). (b) Ratio of fecal primary bile acids to secondary bile acids (n = 8, 7, and 11 mice per group). Levels of (c) non-12-OH bile acids, (d) muricholic acids, and (e) 12-OH bile acids (n = 8, 7, and 11 mice per group). (f) Portal-vein FGF15 levels (n = 6, 6, and 11 mice per group). (g) Western blotting of ileal FGF15 expression normalized to GAPDH (n = 4 mice per group). (h) Western blotting of hepatic FGFR4 level normalized to GAPDH (n = 4 mice per group). For a, c, d and e, data are means and SEM. For b, f, g and h, data are means and SD. For panels a to h, statistical analyses were performed with one-way ANOVA with Tukey’s range test (*, P < 0.05; **, P < 0.01; ***, P < 0.001). Abbreviations: AGP, antibiotic growth promoter; α-MCA, α-muricholic acid; β-MCA, β-muricholic acid; ω-MCA, ω-muricholic acid; CON, control; CDCA, chenodeoxycholic acid; FGF15, fibroblast growth factor 15; FGFR4, fibroblast growth factor receptor 4; GAPDH, glyceraldehyde 3-phosphate dehydrogenase; LCA, lithocholic acid; PBA, primary bile acid; SBA, secondary bile acid; T-β-MCA, tauro-beta-muricholic acid; TCDCA, taurochenodeoxycholic acid; TLCA, taurolithocholic acid; TMDI, theoretical maximum daily intake; TUDCA, tauroursodeoxycholic acid; UDCA, ursodeoxycholic acid.
FIG 5
FIG 5
A residual dose of antibiotic growth promoter exacerbates HFD-induced metabolic disorder by altering the gut microbiota, microbial metabolites, and downstream signaling pathway. Abbreviations: AGP, antibiotic growth promoter; FGF15, fibroblast growth factor 15; FGFR4, fibroblast growth factor receptor 4; PBA, primary bile acid; SBA, secondary bile acid.

References

    1. Brown K, Uwiera RRE, Kalmokoff ML, Brooks SPJ, Inglis GD. 2017. Antimicrobial growth promoter use in livestock: a requirement to understand their modes of action to develop effective alternatives. Int J Antimicrob Agents 49:12–24. doi: 10.1016/j.ijantimicag.2016.08.006. - DOI - PubMed
    1. Brussow H. 2015. Growth promotion and gut microbiota: insights from antibiotic use. Environ Microbiol 17:2216–2227. doi: 10.1111/1462-2920.12786. - DOI - PubMed
    1. Riley LW, Raphael E, Faerstein E. 2013. Obesity in the United States—dysbiosis from exposure to low-dose antibiotics? Front Public Health 1:69. - PMC - PubMed
    1. Hao H, Cheng G, Iqbal Z, Ai X, Hussain HI, Huang L, Dai M, Wang Y, Liu Z, Yuan Z. 2014. Benefits and risks of antimicrobial use in food-producing animals. Front Microbiol 5:288. doi: 10.3389/fmicb.2014.00288. - DOI - PMC - PubMed
    1. Ryan AM. 2013. Preserving antibiotics, rationally. N Engl J Med 369:2472–2474. doi: 10.1056/NEJMp1312654. - DOI - PubMed

Publication types

LinkOut - more resources