. 2022 Jun 7:11:e72871.
doi: 10.7554/eLife.72871.

The control and training of single motor units in isometric tasks are constrained by a common input signal

Affiliations

The control and training of single motor units in isometric tasks are constrained by a common input signal

Mario Bräcklein et al. Elife. .

Abstract

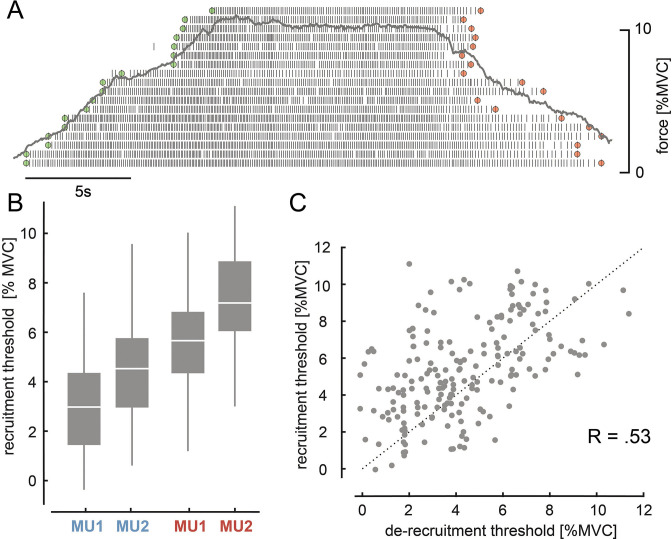
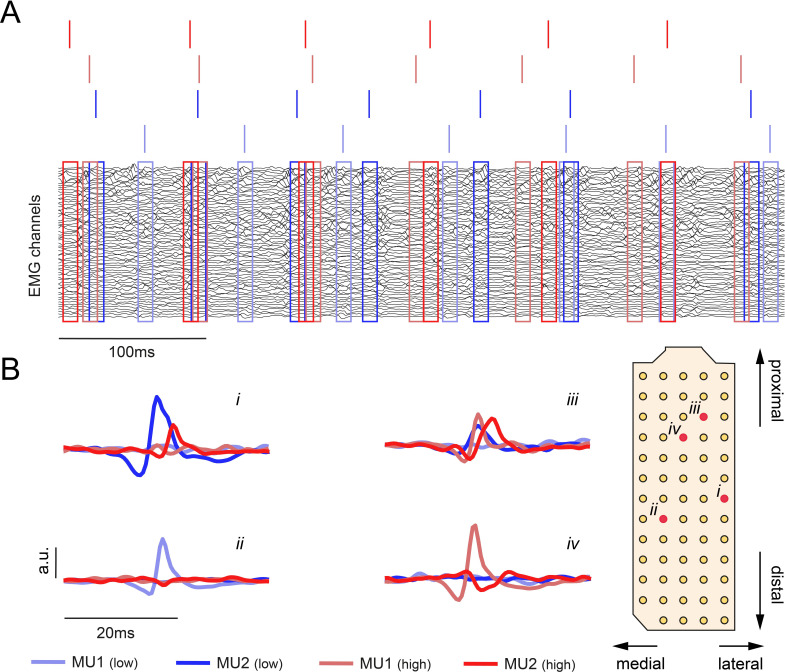
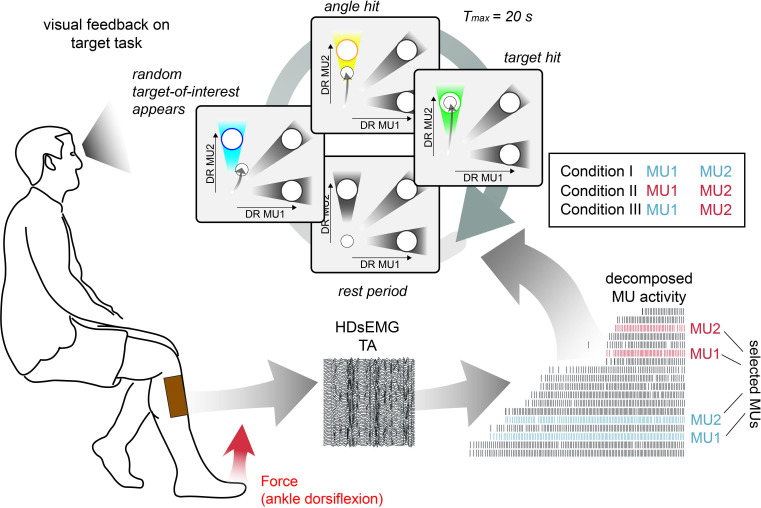
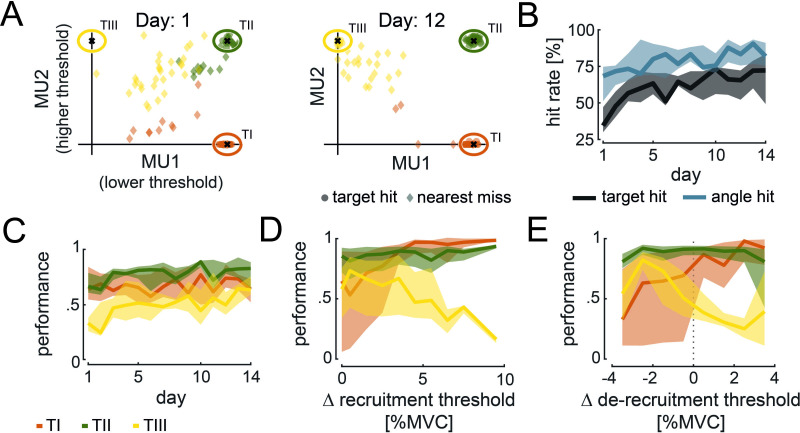
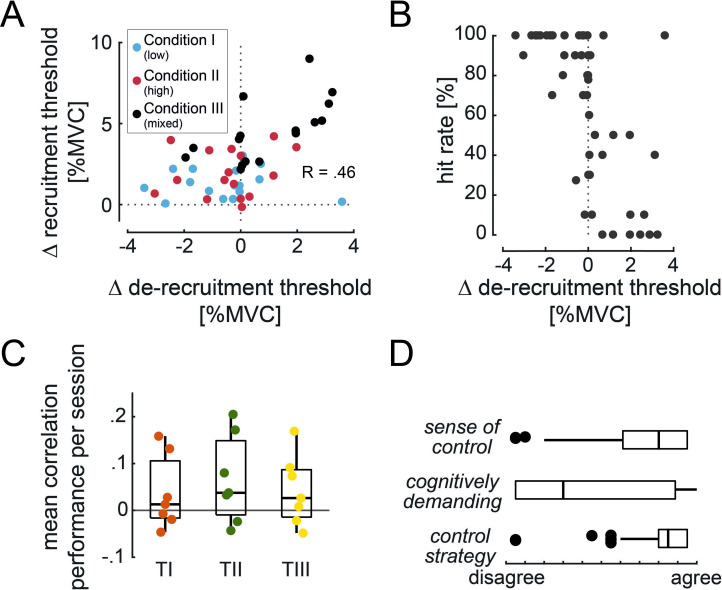
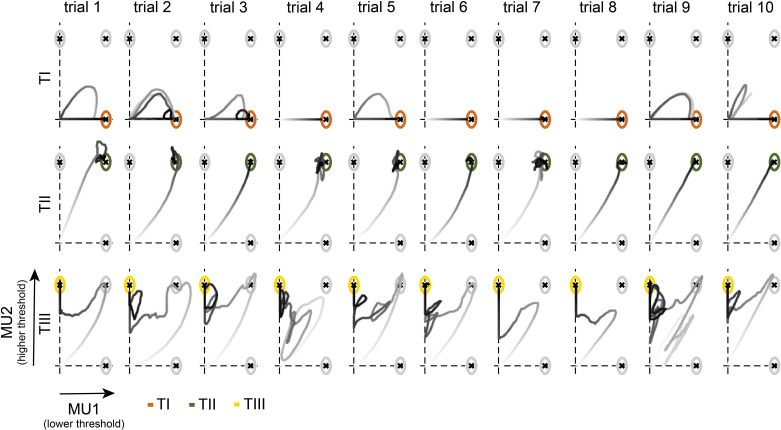
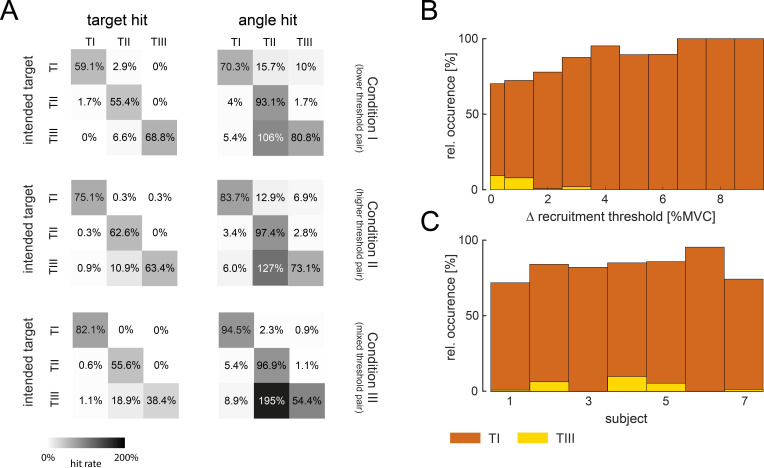
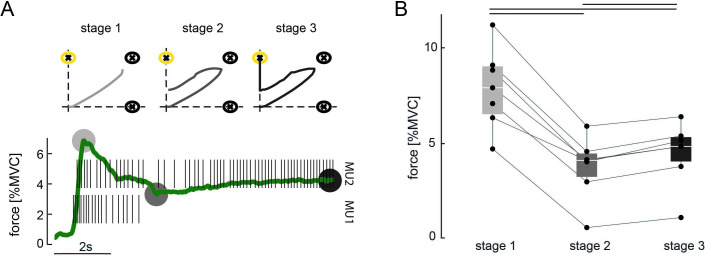
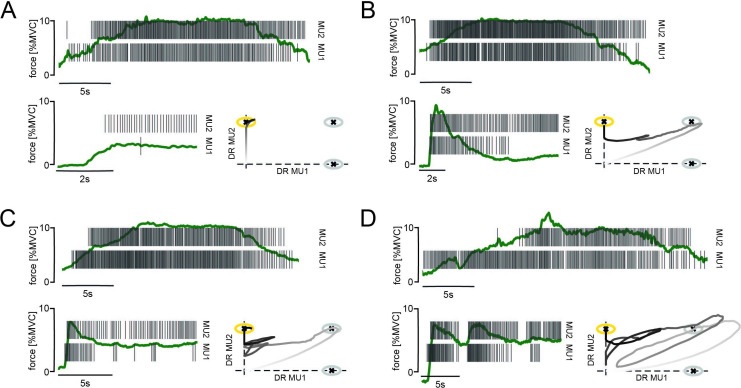
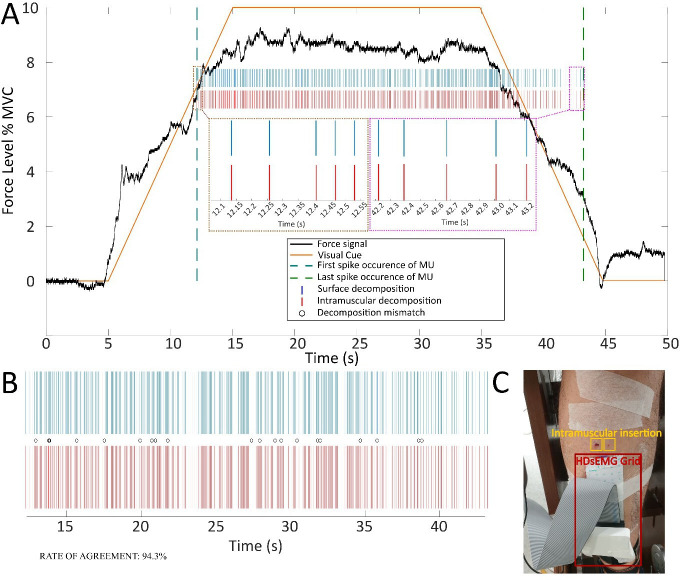
Recent developments in neural interfaces enable the real-time and non-invasive tracking of motor neuron spiking activity. Such novel interfaces could provide a promising basis for human motor augmentation by extracting potentially high-dimensional control signals directly from the human nervous system. However, it is unclear how flexibly humans can control the activity of individual motor neurons to effectively increase the number of degrees of freedom available to coordinate multiple effectors simultaneously. Here, we provided human subjects (N = 7) with real-time feedback on the discharge patterns of pairs of motor units (MUs) innervating a single muscle (tibialis anterior) and encouraged them to independently control the MUs by tracking targets in a 2D space. Subjects learned control strategies to achieve the target-tracking task for various combinations of MUs. These strategies rarely corresponded to a volitional control of independent input signals to individual MUs during the onset of neural activity. Conversely, MU activation was consistent with a common input to the MU pair, while individual activation of the MUs in the pair was predominantly achieved by alterations in de-recruitment order that could be explained by history-dependent changes in motor neuron excitability. These results suggest that flexible MU recruitment based on independent synaptic inputs to single MUs is unlikely, although de-recruitment might reflect varying inputs or modulations in the neuron's intrinsic excitability.

Keywords: common synaptic input; human; motor control; motor unit; neuroscience; real-time decomposition.


Conflict of interest statement

MB, DB, JI, JE, EB, CM, DF No competing interests declared

Figures

Figure 1.
Figure 1.. Motor unit (MU) recruitment and de-recruitment.
(A) The identified MU pool ranked on the recruitment order of one representative subject is shown with the underlying force profile (grey). Time points of recruitment (green) and de-recruitment (red) for each MU are marked. (B) Recruitment levels for MU1 and MU2 of the lower (blue) and higher threshold pair (red) across all subjects and days are shown with their median and quartiles. (C) Recruitment and de-recruitment threshold for the selected MUs across all days showed a significant relationship (p<0.001). Dashed line indicates the diagonal. The three subjects for whom no de-recruitment thresholds were determined were neglected in this correlation analysis.
Figure 1—figure supplement 1.
Figure 1—figure supplement 1.. High-density surface electromyogram (HDsEMG) from a single subject.
(A) HDsEMG at 10% maximum voluntary contraction (MVC) during the initial force task overlayed with the spike timing of the four selected motor units (MUs). Rectangles indicate a 10 ms window centred at the time of a detected MU action potential. (B) Spike-triggered average of the four selected MUs over 10 s at 10% MVC at the initial force task for four different locations i–iv. The locations are indicated on the schematic electrode layout on the right. Double differential signals are displayed for visualisation purposes.
Figure 2.
Figure 2.. Schematic overview of the target task.
High-density surface electromyogram (HDsEMG) of tibialis anterior muscle (TA) was acquired and decomposed from the underlying neural activity in real time. Concurrently, the force due to dorsiflexion of the ankle (red arrow) and bipolar electromyogram (EMG) of fibularis longus (FL), lateral head of the gastrocnemius muscle (GL), and medial head of the gastrocnemius muscle (GM) were recorded. The identified motor unit (MU) pool was ranked accordingly to the recruitment order. Two pairs of MUs with a similar recruitment threshold were selected from the initial (blue) and the latter recruited half (red). During the target task, subjects were instructed to navigate a cursor inside a 2D space by modulating the normalised discharge rate (DR) of MU1 and MU2. The selection of MU1 and MU2 was determined by three different conditions. In condition I, MU1 and MU2 were coming from the low recruitment threshold pair (blue), in condition II from the high recruitment threshold pair (red), while in condition III, the lowest threshold MU of the low threshold pair was pooled with the highest threshold MU of the high threshold pair. During the target task, subjects were asked to stay inside the origin until the target-of-interest (blue) appeared (randomly selected). By navigating the cursor inside the angle area around the target-of-interest, subjects were granted an angle hit (yellow). The trial was terminated when either the subject managed to place and hold the cursor inside the target area (target hit, green) or more than 20 s had passed since the target-of-interest appeared. In each condition, 30 targets are shown, that is, each target 10 times.
Figure 3.
Figure 3.. Cursor movement and performance during target task.
(A) Average cursor position during target hits (circle) and nearest misses (diamond) across conditions is shown for the 1st and 12th day of experiments for TI (orange), TII (green), and TIII (yellow) of one subject. (B) Target (black) and angle hit rate (blue) across subjects, conditions, and targets-of-interest are shown with their medians (solid line) and 25 and 75% quartiles (shaded areas) across days. (C) Performance values across subjects and conditions for TI (orange), TII (green), and TIII (yellow) are shown with their medians (solid line) and 25 and 75% quartiles (shaded areas) across days. (D, E) Performance values corresponding to the difference in recruitment threshold (D) and de-recruitment threshold (E) between motor unit (MU)2 and MU1 are shown across subjects and conditions for the last 5 days of training. The median (solid line) and 25 and 75% quartiles (shaded area) for TI (orange), TII (green), and TIII (yellow) are illustrated in steps of 1% maximum voluntary contraction (MVC).
Figure 3—figure supplement 1.
Figure 3—figure supplement 1.. Additional metrics concerning the target-tracking task.
(A) Difference in recruitment threshold of the selected motor unit (MU) pair versus their difference in the de-recruitment threshold for the last 5 days of training (Spearman’s correlation coefficient R=0.46, p=0.001). Each dot represents a MU pair coloured based on the condition. (B) Angle hit rate of all TIII instructed trials during the last 5 days of training versus the within-pair difference in the de-recruitment threshold. (C) Estimation of within-session learning grouped by the three targets TI (orange), TII (green), and TIII (yellow). Learning was estimated by calculating Spearman’s correlation coefficient between performance and consecutive trails per target and condition. Each dot represents the mean correlation coefficient for one subject averaged across conditions and all 14 days of training. A Friedman test revealed no difference between targets (p=0.103). The positive median values indicate small learning within one session across subjects for each target. (D) Subjective experience of controlling MU2 when reaching towards TIII based on the questionnaire response during the last 5 days of training across subjects and conditions are shown by their medians and quartiles.
Figure 4.
Figure 4.. Cursor trajectories of one subject during the target task.
Cursor movement towards TI (orange, top), TII (green, centre), and TIII (yellow, bottom) in each trial for condition I on the 14th day of one representative subject is shown. Trials 1–10 indicate the 1st to the 10th appearance of each target-of-interest. The grey intensity of the cursor trajectories increases over time within the trial.
Figure 5.
Figure 5.. Movement towards targets-of-interest.
(A) Relative hit rates of intended and unintended hits (grey) of targets and angles are shown for the targets-of-interest TI, TII, and TIII during the last 5 days of training across subjects for condition I (top), condition II (centre), and condition III (bottom). Note that the hit rates above 100% can be reached for unintended hits when subjects re-entered the target before the trial ended. Colour intensity corresponds to the hit rate. Relative occurrence of direct movement towards TI (orange), that is, only activating motor unit (MU)1 without MU2, and TIII (yellow), that is, only activating MU2 without MU1, during successful attempts (at least angle hits), is shown with respect to the difference in recruitment threshold between MU2 and MU1 (B) and across subjects (C).
Figure 6.
Figure 6.. Three-stage approach to hit TIII.
(A) Force due to ankle dorsiflexion (green) and the discharge behaviour of the selected motor unit (MU) pair during a successful attempt of hitting TIII (yellow) for a representative subject. The subject used a three-stage approach to achieve the target task: stage 1: increasing the force to orderly recruit both MUs; stage 2: reducing the force until MU1 stops firing while the cursor is placed along the vertical axis; stage 3: slightly increasing the force again to manoeuvre the cursor inside TIII. Grey circles mark the characteristic force values of each stage. Stage 1: maximum force while both MUs are active; stage 2: minimum force after MU1 stopped firing; stage 3: force during hit of TIII. The corresponding cursor movement for each stage is shown on the top. Grey intensity increases with stages. (B) Characteristic forces (due to ankle dorsiflexion) are shown with their median and quartiles at each stage of control for all subjects across all conditions during all TIII hits in the last 5 days of training. Each dot represents a subject, and corresponding values are connected via the lines. Black bars indicate a significant difference with p<0.05.
Figure 6—figure supplement 1.
Figure 6—figure supplement 1.. Various successful trials of hitting TIII for different subjects, conditions, and training days.
The top figure in each segment shows the discharge activity of motor unit (MU)1 and MU2 (selected MU pair) and force due to dorsiflexion (green) during the initial force task. The bottom-left figure shows the discharge activity of MU1 and MU2 and the force (green) during a single successful TIII instructed trial, while the bottom-right figure shows the corresponding cursor movement towards TIII (yellow). The grey intensity of the cursor trajectories increases over time within the trial. (A) Direct movement towards TIII besides the initial difference in recruitment threshold. (B) Indirect movement towards TIII. (C, D) Indirect movement towards TIII for an MU pair in which the higher threshold MU (MU2) was initially recruited after and de-recruited before the lower threshold one (MU1). DR: discharge rate.
Figure 7.
Figure 7.. An example two-source validation of surface and intramuscular recorded electromyogram (EMG) signals during recruitment/de-recruitment.
(A) The visual cue provided to the user during the trial (orange solid line), the force feedback on the ankle dorsiflexion (black solid line), the first and last occurrence of motor unit (MU) firing (teal and green dashed lines, respectively) and two subpanels showing the first and last five MU discharges identified for intramuscular and surface decomposed signals (brown and magenta subpanels). (B) The decomposed MU spike train from surface EMG (blue) and intramuscular EMG (red), as well as decomposition mismatches, identified (black circles). (C) The experimental setup for concurrent intramuscular and surface EMG recordings.

References

    1. Adam A, De Luca CJ. Recruitment order of motor units in human vastus lateralis muscle is maintained during fatiguing contractions. Journal of Neurophysiology. 2003;90:2919–2927. doi: 10.1152/jn.00179.2003. - DOI - PubMed
    1. Barsakcioglu DY, Bracklein M, Holobar A, Farina D. Control of Spinal Motoneurons by Feedback From a Non-Invasive Real-Time Interface. IEEE Transactions on Bio-Medical Engineering. 2021;68:926–935. doi: 10.1109/TBME.2020.3001942. - DOI - PubMed
    1. Basmajian JV. Control and training of individual motor units. Science (New York, N.Y.) 1963;141:440–441. doi: 10.1126/science.141.3579.440. - DOI - PubMed
    1. Binder MD, Powers RK, Heckman CJ. Nonlinear Input-Output Functions of Motoneurons. Physiology (Bethesda, Md.) 2020;35:31–39. doi: 10.1152/physiol.00026.2019. - DOI - PMC - PubMed
    1. Bräcklein M, Ibáñez J, Barsakcioglu DY, Farina D. Towards human motor augmentation by voluntary decoupling beta activity in the neural drive to muscle and force production. Journal of Neural Engineering. 2021;18:016001. doi: 10.1088/1741-2552/abcdbf. - DOI - PubMed

Publication types