18F-NaF PET/MRI for Detection of Carotid Atheroma in Acute Neurovascular Syndrome
- PMID: 35670715
- PMCID: PMC9523682
- DOI: 10.1148/radiol.212283
18F-NaF PET/MRI for Detection of Carotid Atheroma in Acute Neurovascular Syndrome
Abstract
Background MRI and fluorine 18-labeled sodium fluoride (18F-NaF) PET can be used to identify features of plaque instability, rupture, and disease activity, but large studies have not been performed. Purpose To evaluate the association between 18F-NaF activity and culprit carotid plaque in acute neurovascular syndrome. Materials and Methods In this prospective observational cohort study (October 2017 to January 2020), participants underwent 18F-NaF PET/MRI. An experienced clinician determined the culprit carotid artery based on symptoms and record review. 18F-NaF uptake was quantified using standardized uptake values and tissue-to-background ratios. Statistical significance was assessed with the Welch, χ2, Wilcoxon, or Fisher test. Multivariable models were used to evaluate the relationship between the imaging markers and the culprit versus nonculprit vessel. Results A total of 110 participants were evaluated (mean age, 68 years ± 10 [SD]; 70 men and 40 women). Of the 110, 34 (32%) had prior cerebrovascular disease, and 26 (24%) presented with amaurosis fugax, 54 (49%) with transient ischemic attack, and 30 (27%) with stroke. Compared with nonculprit carotids, culprit carotids had greater stenoses (≥50% stenosis: 30% vs 15% [P = .02]; ≥70% stenosis: 25% vs 4.5% [P < .001]) and had increased prevalence of MRI-derived adverse plaque features, including intraplaque hemorrhage (42% vs 23%; P = .004), necrotic core (36% vs 18%; P = .004), thrombus (7.3% vs 0%; P = .01), ulceration (18% vs 3.6%; P = .001), and higher 18F-NaF uptake (maximum tissue-to-background ratio, 1.38 [IQR, 1.12-1.82] vs 1.26 [IQR, 0.99-1.66], respectively; P = .04). Higher 18F-NaF uptake was positively associated with necrosis, intraplaque hemorrhage, ulceration, and calcification and inversely associated with fibrosis (P = .04 to P < .001). In multivariable analysis, carotid stenosis at or over 70% (odds ratio, 5.72 [95% CI: 2.2, 18]) and MRI-derived adverse plaque characteristics (odds ratio, 2.16 [95% CI: 1.2, 3.9]) were both associated with the culprit versus nonculprit carotid vessel. Conclusion Fluorine 18-labeled sodium fluoride PET/MRI characteristics were associated with the culprit carotid vessel in study participants with acute neurovascular syndrome. Clinical trial registration no. NCT03215550 and NCT03215563 © RSNA, 2022 Online supplemental material is available for this article.
Conflict of interest statement
Figures


![Fluorine 18–labeled sodium fluoride (18F-NaF) PET/MRI carotid
scans and ex vivo histologic analysis sample in a patient who experienced a
left hemispheric transient ischemic attack. MR angiograph in a 60-year-old
woman with left hemispheric transient ischemic attack shows a left carotid
artery stenosis of greater than or equal to 70% severity (box, MR
angiography [MRA] panel; arrow, time-of-flight [TOF] panel). MRI plaque
analysis was used to identify intraplaque hemorrhage (arrow, T1 panel),
lipid-rich necrotic core (arrow, T2 panel), and calcification (arrow, proton
density [PD] panel). 18F-NaF PET/MRI showed focal uptake in the region of
the intraplaque hemorrhage and lipid-rich necrotic core (orange arrow). The
carotid plaque was excised at operation. Cross-sectional images through the
carotid plaque are shown, with hematoxylin and eosin (H & E) and
Movat pentachrome stains. The red arrow indicates the thin fibrous cap, the
blue arrow highlights plaque erosion, the star denotes a rupture, the purple
arrow shows intraplaque hemorrhage with a thrombus, the yellow arrowheads
denote inflammation (shoulder and central regions), and the green arrowheads
indicate lipid-rich necrotic cores.](https://cdn.ncbi.nlm.nih.gov/pmc/blobs/f27a/9523682/14b710754586/radiol.212283.fig2.gif)
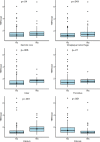
![Tukey box and whisker plots show fluorine 18–labeled sodium
fluoride uptake (mean tissue-to-background ratio [TBRmean] and maximum
tissue-to-background ratio [TBRmax]) stratified by the degree of carotid
stenosis (expressed as percentages) in culprit (red) and nonculprit (blue)
vessels. The box bounds the IQR (upper and lower quartile) divided by the
median (solid horizontal midline); whiskers extend to the most extreme data
points from the edge of the box; outliers beyond the whiskers are
individually plotted by the solid dots.](https://cdn.ncbi.nlm.nih.gov/pmc/blobs/f27a/9523682/b7385ef7af10/radiol.212283.fig3.gif)


![Multivariable models were constructed for the identification of
culprit compared with nonculprit vessels, which included as covariates the
presence of MRI-derived stenosis greater than or equal to 70%, one or more
MRI-derived adverse plaque characteristics, and either mean
tissue-to-background ratio (TBRmean) or maximum tissue-to-background ratio
(TBRmax). Dot plots show odds ratios, with blue lines representing 95% CIs.
TBRmean is per doubling [log2(TBRmean)]. *** = P
< .001, ** = P < .01, * = P < .05,
no asterisk = P ≥ .05.](https://cdn.ncbi.nlm.nih.gov/pmc/blobs/f27a/9523682/0561e9483c7e/radiol.212283.fig6.gif)
References
-
- Huibers A , de Borst GJ , Wan S , et al. . Non-invasive carotid artery imaging to identify the vulnerable plaque: current status and future goals. Eur J Vasc Endovasc Surg 2015; 50(5):563–572. - PubMed
-
- Hyafil F , Schindler A , Sepp D , et al. . High-risk plaque features can be detected in non-stenotic carotid plaques of patients with ischaemic stroke classified as cryptogenic using combined (18)F-FDG PET/MR imaging. Eur J Nucl Med Mol Imaging 2016; 43(2):270–279. - PubMed
Publication types
MeSH terms
Substances
Associated data
Grants and funding
- PG/21/10461/BHF_/British Heart Foundation/United Kingdom
- FS/18/31/33676/BHF_/British Heart Foundation/United Kingdom
- WT103782AIA/WT_/Wellcome Trust/United Kingdom
- FS/19/34/34354/BHF_/British Heart Foundation/United Kingdom
- MR/M024717/1/MRC_/Medical Research Council/United Kingdom
- CH/09/002/BHF_/British Heart Foundation/United Kingdom
- WT_/Wellcome Trust/United Kingdom
- FS/ICRF/20/26002/BHF_/British Heart Foundation/United Kingdom
- FS/17/50/33061/BHF_/British Heart Foundation/United Kingdom
- FS/14/78/31020/BHF_/British Heart Foundation/United Kingdom
- RG/16/10/32375/BHF_/British Heart Foundation/United Kingdom
- 221295/Z/20/Z/WT_/Wellcome Trust/United Kingdom
- RE/18/5/34216/BHF_/British Heart Foundation/United Kingdom
LinkOut - more resources
Full Text Sources
Medical

