. 2022 Aug;78(3):689-701.
doi: 10.1007/s13105-022-00897-2. Epub 2022 Jun 7.

Intestinal serotonergic system is modulated by Toll-like receptor 9

Affiliations

Intestinal serotonergic system is modulated by Toll-like receptor 9

Elena Layunta et al. J Physiol Biochem. 2022 Aug.

Abstract

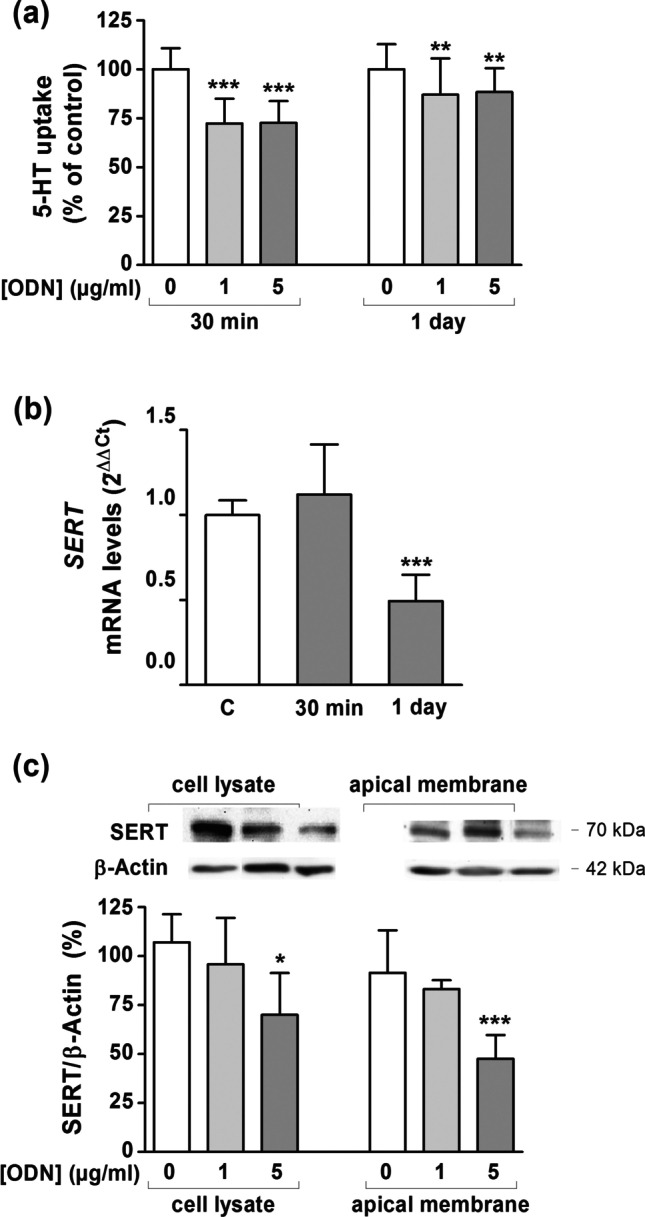
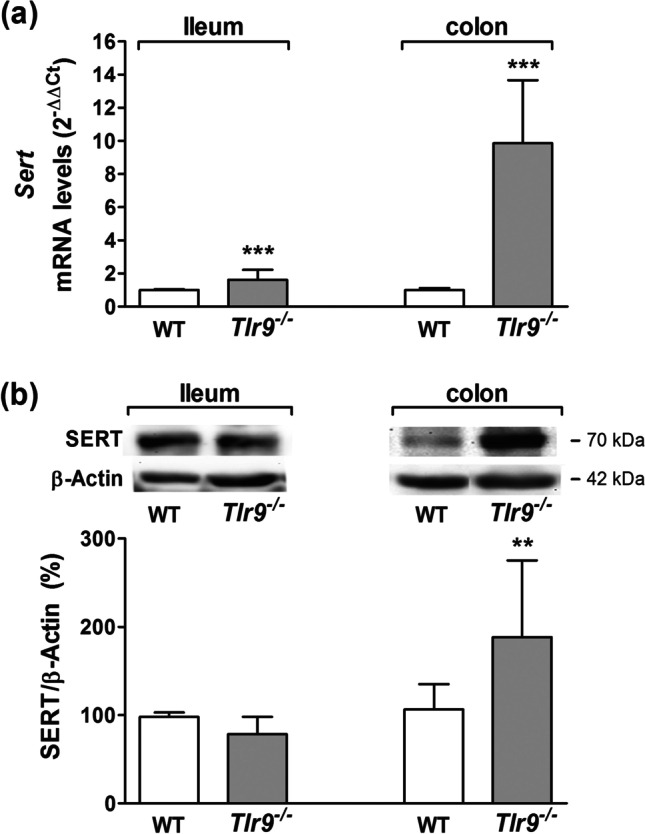
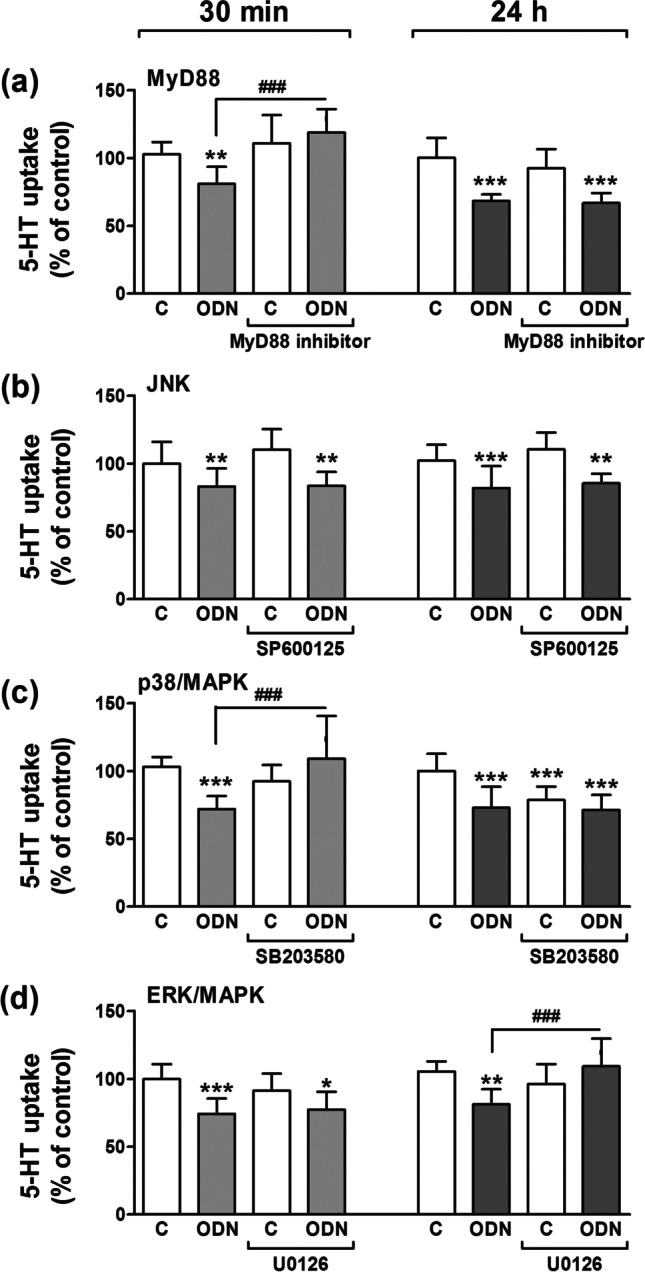
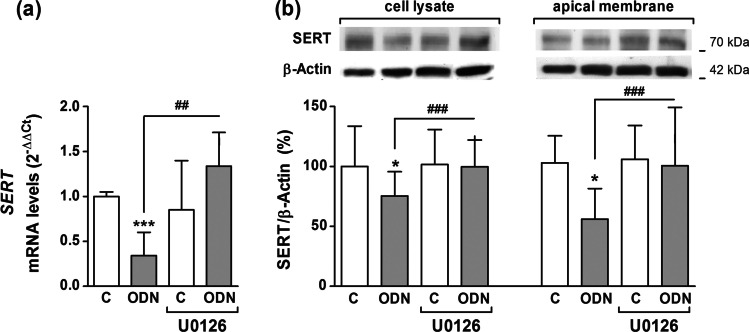
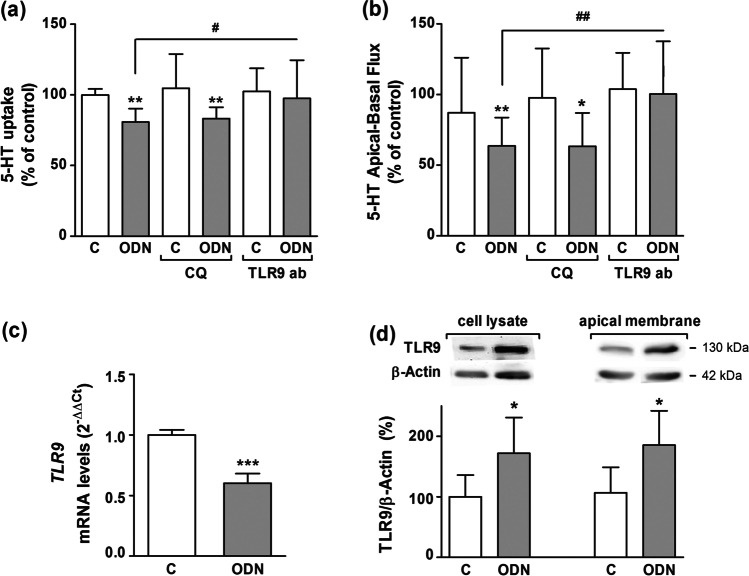
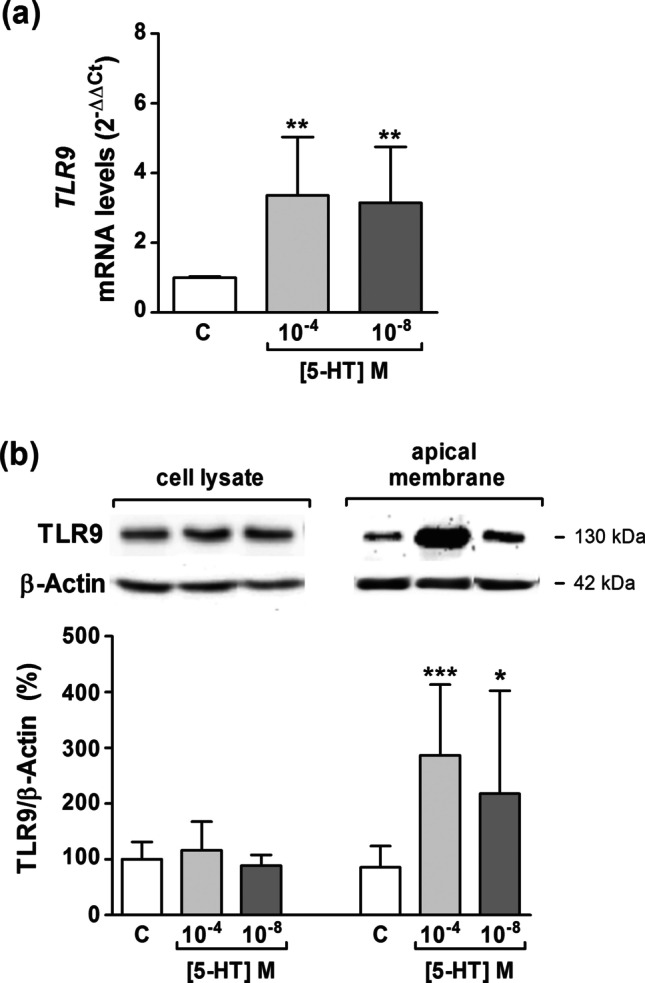
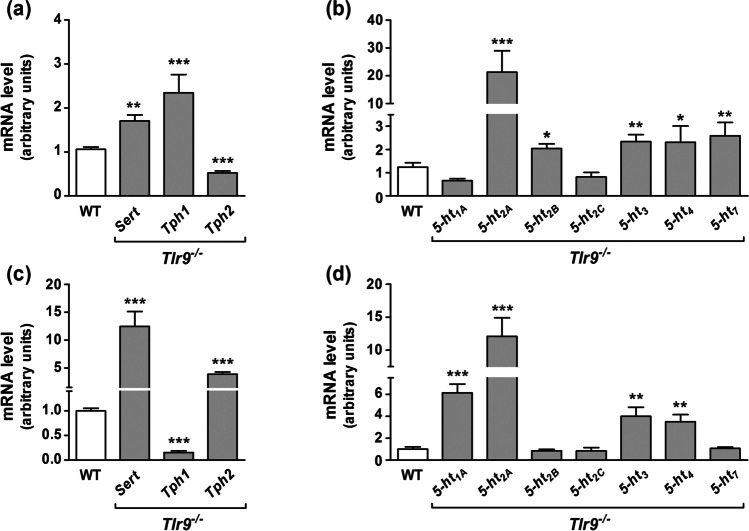
Intestinal serotonergic system is a key modulator of intestinal homeostasis; however, its regulation is still unclear. Toll-like receptor 9 (TLR9), an innate immune receptor, detects different external agents in the intestine, preserving intestinal integrity. Since little is known about TLR9 role in the intestine, our aim was to address the potential regulation between TLR9 and intestinal serotonergic system. Caco-2/TC7 cell line and intestinal tract of Tlr9-/- mice were used in this study. Serotonin uptake studies were performed, and molecular expression of different serotonergic components was analyzed by western blot and real-time PCR. Our results show that TLR9 activation inhibits serotonin transporter activity and expression, involving p38/MAPK and ERK/MAPK intracellular pathways, and reciprocally, serotonin increases TLR9 expression. Supporting this interaction, serotonin transporter, serotonin receptors and serotonin producer enzymes were found altered in intestinal tract of Tlr9-/- mice. We conclude that TLR9 could contribute to intestinal homeostasis by modulation of intestinal serotonergic system.

Keywords: Intestine; Microbiota; PRRs; SERT; Serotonin; TPH.


Conflict of interest statement

The authors declare that there is no conflict of interests. The data that support the findings of this study are available from the corresponding author upon request.

Figures

Fig. 1
Fig. 1
TLR9 activation by ODN inhibits SERT function and expression. a. 5-HT uptake was measured after 6-min incubation of 5-HT 0.2 μM. ODN concentrations assayed were 1 and 5 μg/ml. The stimulation periods were 30 min (short-term) and 1 day (long-term). The results are expressed as the percentage of the control (100%) and are the mean plus SD of seven independent experiments. Absolute control values were 7.77 ± 0.74 and 8.72 ± 0.68 pmol 5-HT/mg protein at 30 min and 1 day, respectively. b. Real-time PCR analysis of SERT mRNA expression level in cells treated for 30 min and 1 day with ODN 5 μg/ml. Relative quantification was performed with the comparative Ct method (2.–ΔΔCt) normalized by HPRT1 and GAPDH mean. Results are expressed as arbitrary units (control = 1) and are the mean plus SD of six independent experiments. c. Immunodetection and quantification of SERT protein expression by western blot in cell lysate and apical membrane from Caco-2/TC7 cells treated with ODN 1 and 5 μg/ml for 1 day using β-actin as an internal control of the protein load (SERT/β-actin ratio). The results are expressed as percentage of the control value and are the mean plus SD of four independent experiments. *P < 0.05, **P < 0.01 and ***P < 0.001 compared with the control value
Fig. 2
Fig. 2
SERT expression on intestinal tract of Tlr9−/− mice. Sert mRNA and protein expression was measured in ileum and colon from WT (wild type) and Tlr9−/− mice. a. Sert mRNA was measured by real-time PCR using the specific primers shown in Table 1. Relative quantification was performed in triplicate with the comparative Ct method (2.–ΔΔCt) normalized by HPRT1 and GAPDH mean. Results are expressed as arbitrary units (control = 1) and are the mean plus SD of five animals. b. SERT protein expression was quantified by western blot using β-actin as internal control of the protein load (SERT/β-actin ratio). The results are expressed as percentage of the control value and are the mean plus SD of five animals. **P < 0.01 and ***P < 0.001 compared with the control value
Fig. 3
Fig. 3
Analysis of intracellular pathways involved in TLR9 activation on SERT function. Caco-2/TC7 cells were treated for 30 min and 1 day with ODN 5 μg/ml with or without the pre-treatment with the corresponding inhibitor of the intracellular pathways assayed. Uptake of 5-HT was measured after 6 min of incubation with 5-HT 0.2 μM. The results are expressed as percentage of the control (100%). a. MyD88 pathway. Cells were 1 h pre-treated with or without MyD88 inhibitor (Pepinh-MYD; 40 µM). Results are the mean plus SD of five independent experiments. b. JNK pathway. Cells were 1 h pre-treated with or without SP600125 1 μM (JNK inhibitor). Results are the mean plus SD of seven independent experiments. c. p38/MAPK pathway. Cells were 1 h pre-treated with or without SB203580 1 μM (p38/MAPK inhibitor). Results are the mean plus SD of seven independent experiments. d. ERK/MAPK pathway. Cells were 1 h pre-treated with or without U0126 1 μM (ERK/MAPK inhibitor). Results are the mean plus SD of seven independent experiments. *P < 0.05, **P < 0.01 and ***P < 0.001 compared with the control value; ###P < 0.001 compared with ODN-treated cells
Fig. 4
Fig. 4
Role of ERK/MAPK on SERT expression after TLR9 long-term activation. Caco-2/TC7 cells were treated for 1 day with ODN 5 μg/ml with or without 1-h pre-treatment with U0126 1 μM (ERK/MAPK inhibitor). a. Real-time PCR analysis of SERT mRNA expression. Relative quantification was performed in triplicate with the comparative Ct method (2.–ΔΔCt) normalized by HPRT1 and GAPDH mean. Results are expressed as arbitrary units (control = 1) and are the mean plus SD of four independent experiments. b. Immunodetection and quantification of SERT protein expression by western blot in cell lysate and apical membrane from Caco-2/TC7 cells. Results are expressed as SERT/β-actin ratio and are the mean plus SD of four independent experiments. *P < 0.05, **< 0.01 and ***P < 0.001 compared with the control value; ###P < 0.001 compared with ODN-treated cells
Fig. 5
Fig. 5
TLR9 located in cell membrane is involved in SERT inhibition. Caco-2/TC7 cells were treated for 1 day with ODN 5 μg/ml with or without a 1-h pre-treatment with chloroquine (CQ) 20 μM or TLR9 antibody (TLR9 Ab) 1:100. a. Uptake of 5-HT was measured after 6 min of incubation with 5-HT 0.2 μM. The results are expressed as the percentage of the control (100%). Results are the mean plus SD of four independent experiments. Absolute control value was 1.584 ± 0.35 pmol 5-HT/mg protein. b. 5-HT apical-to-basal fluxes. 5-HT was used at 0.1 μM, and samples were taken every 10 min from the basal side. The results are expressed as the percentage of the control value (100%) and are the mean plus SD of five independent experiments. Absolute control values in pmol 5 HT/10 min were 0.31 ± 0.04. c. Real-time PCR analysis of TLR9 mRNA expression in Caco-2/TC7 cells treated during 1 day with ODN 5 μg/ml. Relative quantification was performed in triplicate with the comparative Ct method (2–ΔΔCt) normalized by HPRT1 and GAPDH mean. Results are expressed as arbitrary units (control = 1) and are the mean plus SD of three independent experiments. d. Immunodetection and quantification of TLR9 protein expression by western blot in cell lysate and apical membrane from Caco-2/TC7 cells treated with ODN 5 μg/ml for 1 day. Results are expressed as SERT/β-actin ratio and are the mean plus SD of three independent experiments. *P < 0.05, **P < 0.01 and ***P < 0.001 compared with the control value, unless otherwise indicated; #P < 0.05 and.##P < 0.01 compared with ODN-treated cells
Fig. 6
Fig. 6
TLR9 expression is modulated by 5-HT. Caco-2/TC7 cells were treated for 1 day with 5-HT 10–4 and 10–8 M a. Real-time PCR analysis of TLR9 mRNA expression. Relative quantification was performed in triplicate with the comparative Ct method (2.–ΔΔCt) normalized by HPRT1 and GAPDH mean. Results are expressed as arbitrary units (control = 1) and are the mean plus SD of three independent experiments. b. Immunodetection and quantification of TLR9 protein expression by western blot in cell lysate and apical membrane. Results are expressed as TLR9/β-actin ratio and are the mean plus SD of four independent experiments. *P < 0.05, **P < 0.01 and ***P < 0.001 compared with the control value
Fig. 7
Fig. 7
Gene expression of serotonergic system in ileum and colon of Tlr9−/− mice. Sert, TPH enzymes (Tph1 and Tph2) (a, c) and 5-HT receptors (1A, 2A, 2B, 2C, 3, 4, and 7) (b, d) mRNA expression was measured in ileum (a, b) and colon (c, d) of wild type (WT) and Tlr9−/− mice by real-time PCR. Relative quantification was performed in triplicate with the comparative Ct method (2.–ΔΔCt) normalized by HPRT1 and GAPDH mean. Results are expressed as arbitrary units (control = 1) and are the mean plus SD of five animals. *P < 0.05, **P < 0.01 and ***P < 0.001 compared with the control value (WT)

References

    1. Layunta E, et al. Crosstalk Between Intestinal Serotonergic System and Pattern Recognition Receptors on the Microbiota-Gut-Brain Axis. Front Endocrinol (Lausanne) 2021;12:748254. doi: 10.3389/fendo.2021.748254. - DOI - PMC - PubMed
    1. Hug H, Mohajeri MH, La Fata G. Toll-Like Receptors: Regulators of the Immune Response in the Human Gut. Nutrients. 2018;10(2):203. doi: 10.3390/nu10020203. - DOI - PMC - PubMed
    1. Zarember KA, Godowski PJ. Tissue expression of human Toll-like receptors and differential regulation of Toll-like receptor mRNAs in leukocytes in response to microbes, their products, and cytokines. J Immunol. 2002;168(2):554–561. doi: 10.4049/jimmunol.168.2.554. - DOI - PubMed
    1. Mielcarska MB, Bossowska-Nowicka M, Toka FN. Cell Surface Expression of Endosomal Toll-Like Receptors-A Necessity or a Superfluous Duplication? Front Immunol. 2020;11:620972. doi: 10.3389/fimmu.2020.620972. - DOI - PMC - PubMed
    1. Mendoza C, et al. Toll-like receptor 3 activation affects serotonin transporter activity and expression in human enterocyte-like Caco-2 cells. Cell Physiol Biochem. 2012;30(1):187–198. doi: 10.1159/000339057. - DOI - PubMed

LinkOut - more resources