Clinical Trial
. 2022 Jul 15;132(14):e158800.
doi: 10.1172/JCI158800.

Epigenetic priming enhances antitumor immunity in platinum-resistant ovarian cancer

Affiliations
Clinical Trial

Epigenetic priming enhances antitumor immunity in platinum-resistant ovarian cancer

Siqi Chen et al. J Clin Invest. .

Abstract

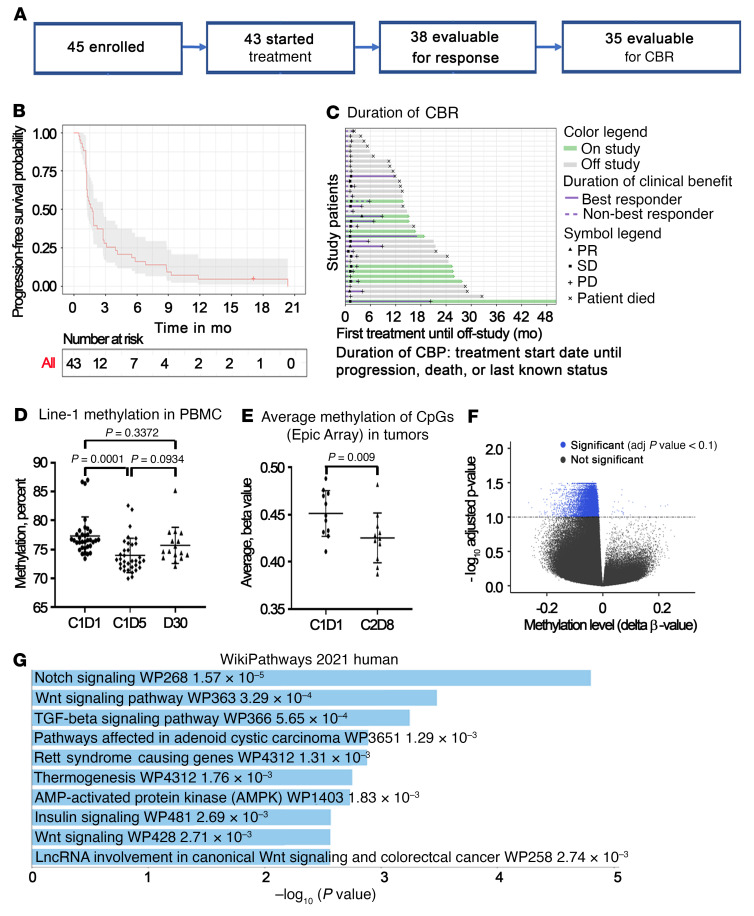
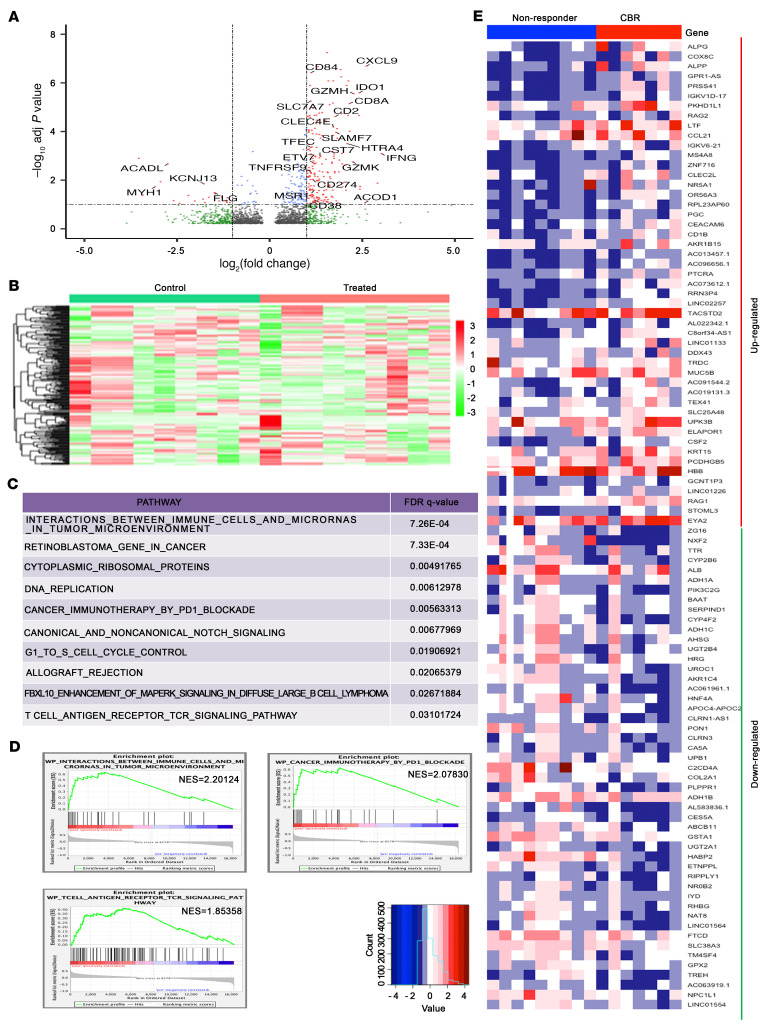
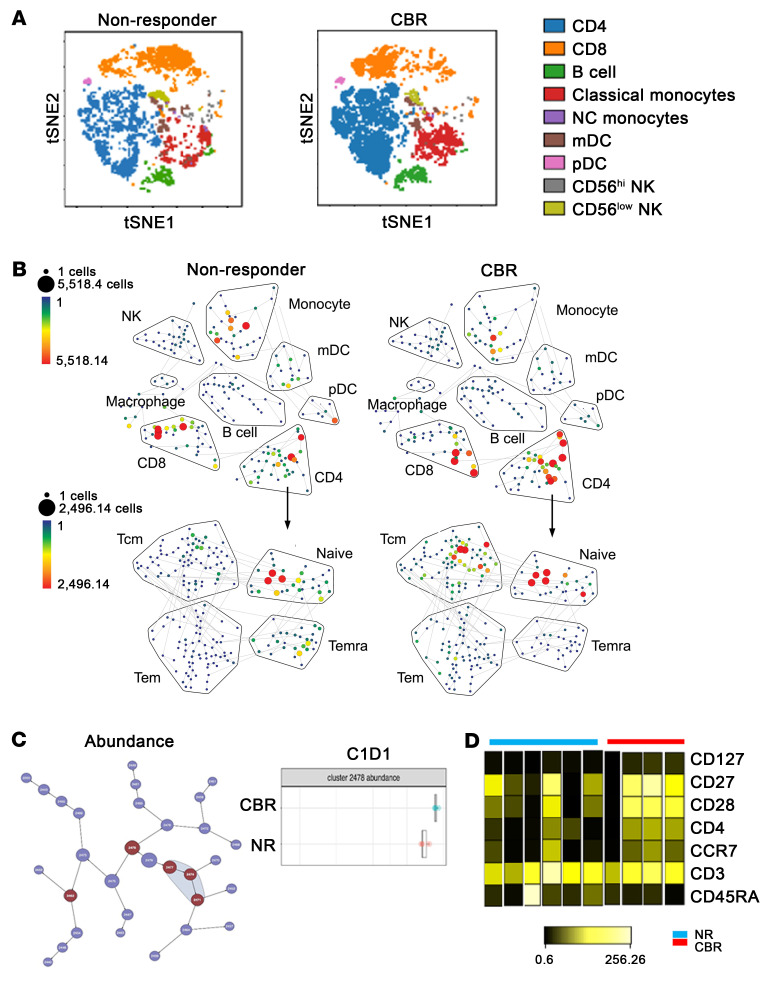
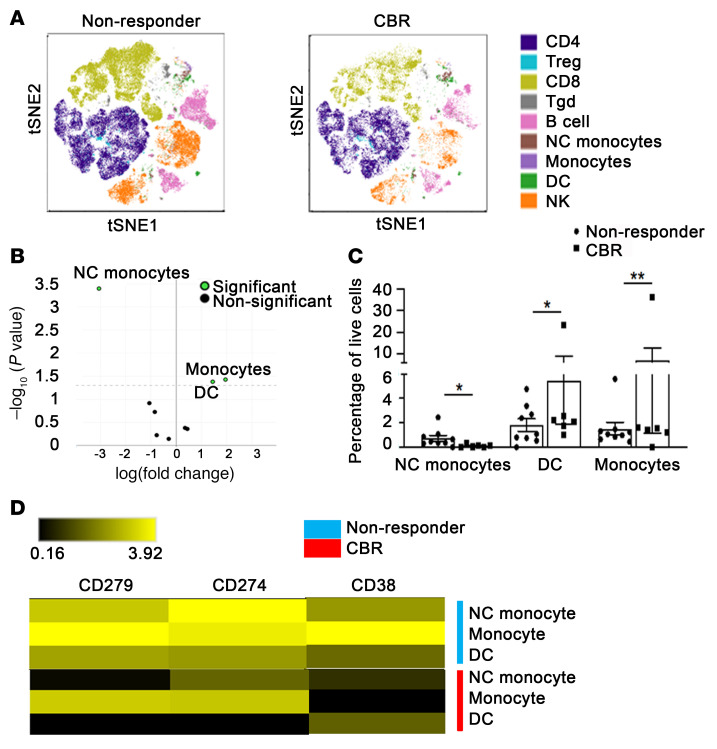
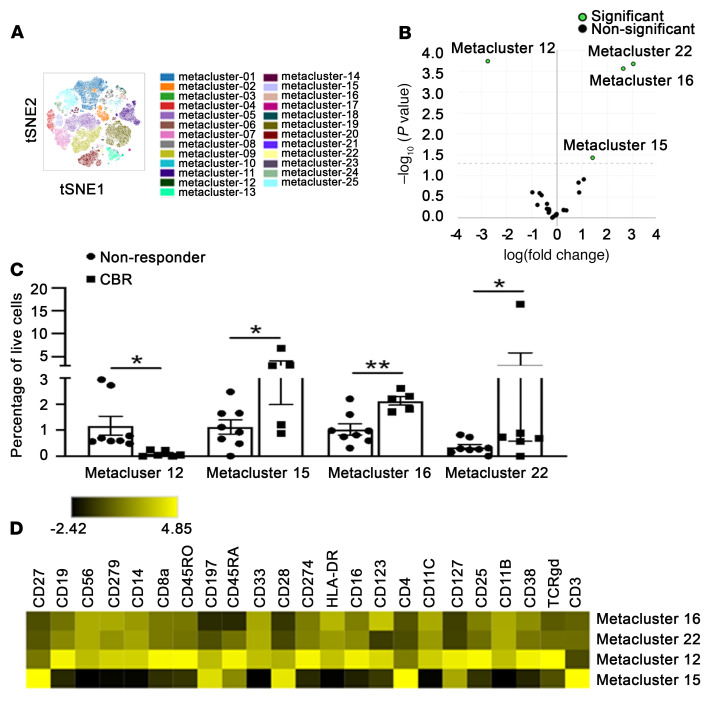
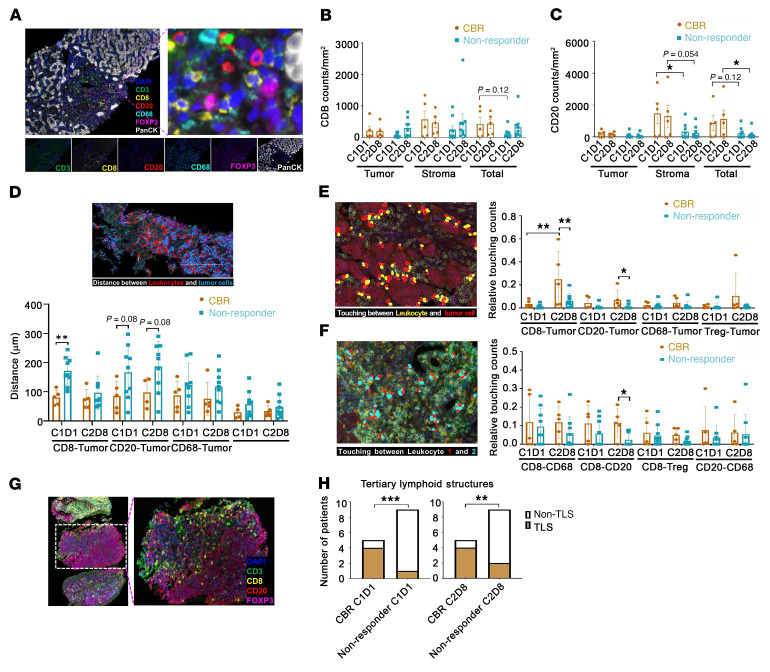
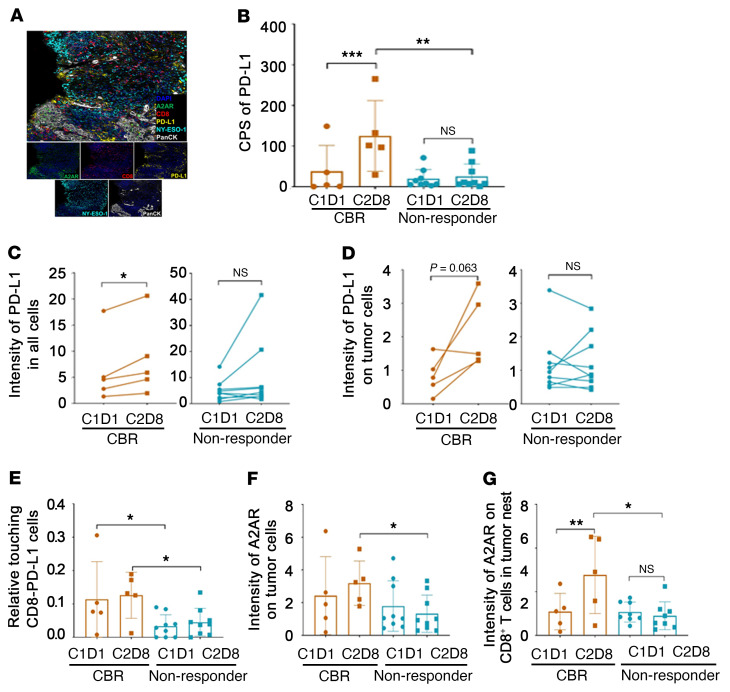
BackgroundImmune checkpoint inhibitors (ICIs) have modest activity in ovarian cancer (OC). To augment their activity, we used priming with the hypomethylating agent guadecitabine in a phase II study.MethodsEligible patients had platinum-resistant OC, normal organ function, measurable disease, and received up to 5 prior regimens. The treatment included guadecitabine (30 mg/m2) on days 1-4, and pembrolizumab (200 mg i.v.) on day 5, every 21 days. The primary endpoint was the response rate. Tumor biopsies, plasma, and PBMCs were obtained at baseline and after treatment.ResultsAmong 35 evaluable patients, 3 patients had partial responses (8.6%), and 8 (22.9%) patients had stable disease, resulting in a clinical benefit rate of 31.4% (95% CI: 16.9%-49.3%). The median duration of clinical benefit was 6.8 months. Long-interspersed element 1 (LINE1) was hypomethylated in post-treatment PBMCs, and methylomic and transcriptomic analyses showed activation of antitumor immunity in post-treatment biopsies. High-dimensional immune profiling of PBMCs showed a higher frequency of naive and/or central memory CD4+ T cells and of classical monocytes in patients with a durable clinical benefit or response (CBR). A higher baseline density of CD8+ T cells and CD20+ B cells and the presence of tertiary lymphoid structures in tumors were associated with a durable CBR.ConclusionEpigenetic priming using a hypomethylating agent with an ICI was feasible and resulted in a durable clinical benefit associated with immune responses in selected patients with recurrent OC.Trial registrationClinicalTrials.gov NCT02901899.FundingUS Army Medical Research and Material Command/Congressionally Directed Medical Research Programs (USAMRMC/CDMRP) grant W81XWH-17-0141; the Diana Princess of Wales Endowed Professorship and LCCTRAC funds from the Robert H. Lurie Comprehensive Cancer Center; Walter S. and Lucienne Driskill Immunotherapy Research funds; Astex Pharmaceuticals; Merck & Co.; National Cancer Institute (NCI), NIH grants CCSG P30 CA060553, CCSG P30 CA060553, and CA060553.

Keywords: Cancer; Cancer immunotherapy; Epigenetics; Immunology; Oncology.


Figures

Figure 1
Figure 1. G+P in recurrent OC.
(A) CONSORT diagram. CBR, clinical benefit or response. (B) Kaplan-Meier estimates of PFS (n = 43). (C) Duration of clinical benefit or response (months). PD, progressive disease. (D) LINE-1 methylation in PBMCs before G+P treatment (C1D1), after G+P treatment (C1D5), and 30 days after treatment discontinuation (D30). Data indicate the mean ± standard deviation. P values were determined with a mixed-effects model and Tukey’s multiple-comparison test. n = 34 pairs for C1D1 versus C1D5; n = 16 pairs for C1D1 versus D30. (E) Average methylation of CpGs (β values) measured using Epic arrays in C2D8 versus C1D1 tumor biopsies. Data indicate the mean ± standard deviation. P value was determined by paired t test. n = 11 pairs. (F) Volcano plot of DNA methylation (β values) in C2D8 versus C1D1 tumor biopsies (n = 11 pairs). adj, adjusted. (G) Top 10 pathways identified by WikiPathways enrichment analysis using 767 genes containing DM CpGs associated with CpG islands located in the gene body or promoter-associated region TSS200+TSS1500 (Illumina nomenclature) in C2D8 versus C1D1 tumor biopsies (n = 11 pairs).
Figure 2
Figure 2. Transcriptomic changes induced by G+P treatment in recurrent OC.
(A) Volcano plot shows DEGs in post-treatment (C2D8) versus pretreatment (C1D1) tumor biopsies (n = 9 pairs). (B) Hierarchical clustering and heatmap show the 300 most variable genes between pre- and post-treatment biopsies. (C) Top 10 enriched biological pathways determined by GSEA of DEGs between pre- and post-treatment biopsies. (D) GSEA enrichment plots for the following biological pathways: “interactions between immune cells and microRNAs in tumor microenvironment,” “cancer immunotherapy by the PD1 blockade,” and “T cell antigen receptor TCR signaling pathway.” NES, normalized enrichment score. (E) Heatmap showing mRNA expression levels of the top 50 up- and downregulated genes (FDR <0.10) in pretreatment tumors from patients categorized as responders (durable CBR, n = 9) versus nonresponders (n = 7).
Figure 3
Figure 3. Mass spectrometric identification of differences in subsets of PBMCs from patients with a durable CBR and nonresponders before treatment with G+P.
(A) Exemplified tSNE visualization of overlaid cell population composition in PBMCs from an initial cohort of nonresponders (n = 6) and durable CBR patients (n = 4) before the initiation of therapy (C1D1). (B) SPADE analysis of total immune cell populations in PBMCs from nonresponders (upper left) and durable CBR patients (upper right); as well as the subsets among total CD4+ T cells from nonresponders (lower left, n = 6) and durable CBR patients (lower right, n = 4) at C1D1. The size and color of each node correspond to the number of cells. (C) Left: CITRUS analysis showing a visual representation of unsupervised hierarchical clustering of CD4 cells and visualization of the clusters that were part of the significant results (in red). Right: Abundance plots for the significant cluster 2478 (of CD4 cells) in nonresponders (NR) and responders (CBR). (D) Heatmap represents the median expression levels of indicated markers within the cluster 2478 from nonresponders and responders (CBR).
Figure 4
Figure 4. Differences in the frequencies of myeloid cell populations between patients with a durable CBR and nonresponders before treatment with G+P, by spectral cytometry.
(A) Exemplified tSNE visualization of the overlaid cell population composition in PBMCs from an extended cohort of nonresponders (n = 9) and patients with durable CBRs (n = 6) before the initiation of therapy (C1D1). (B) edgeR analysis identified myeloid cellular populations with significant differences in relative abundance between nonresponders and patients with a durable CBR. (C) Differences in the percentages of NC monocytes, DCs, and classical monocytes among live PBMCs from nonresponders or durable CBR patients at C1D1. Data indicate the mean ± standard deviation. *P < 0.05 and **P < 0.01, by 2-tailed t test with multiple-comparison correction using the Benjamini-Hochberg adjustment. (D) Heatmap represents the median expression for markers (CD279, CD274, and CD38) that were differentially expressed (adjusted P < 0.05) in NC monocytes, DCs, and classical monocytes between nonresponders and durable CBR patients.
Figure 5
Figure 5. Identification of metaclusters in PBMCs with a significant difference between patients with a durable CBR and nonresponders before treatment with G+P.
(A) Exemplified tSNE visualization of overlaid unsupervised metaclusters in PBMCs using the FlowSOM algorithm from an extended cohort of nonresponders (n = 9) and patients with a durable CBR (n = 6) at C1D1, prior to therapy. (B) edgeR analysis identified metaclusters with significant differences in relative abundance between nonresponders and patients with a durable CBR. (C) Differences in the percentages of unsupervised metaclusters in PBMCs from nonresponders and patients with a durable CBR at C1D1. Data indicate the mean ± standard deviation. *P < 0.05 and **P < 0.01, by 2-tailed t test with multiple-comparison correction using the Benjamini-Hochberg adjustment. (D) Heatmap represents the median expression levels of the indicated markers within the metaclusters that had significant differences in relative abundance between nonresponders and patients with a durable CBR.
Figure 6
Figure 6. Distinct features of TILs between nonresponders and patients with a durable CBR.
(A) Representative multiplex image (upper left panel) with inset (upper right) of cytotoxic T cells (CD3+CD8+), B cells (CD20+), macrophages (CD68+), and Tregs (CD3+CD8FOXP3+) in a responder patient after treatment with G+P, measured by mIHC. (B and C) Density of tumor-infiltrating CD8+ T cells (B) and CD20+ B cells (C) in the compartments of the tumor nest and stroma from patients with a durable CBR (n = 5) and nonresponders (n = 9). (DF) Spatial characterization among TILs and tumor cells from patients with a durable CBR (n = 5) and nonresponders (n = 9). (D) Distance from TILs (red) to tumor cells (blue). (E) Touching events between TILs (yellow) and tumor cells (red). (F) Touching events among TILs. (G) Representative image of mIHC staining of putative TLSs in a patient with a durable CBR after treatment with G+P. (H) Comparison of putative TLSs at C1D1 (left) and C2D8 (right) between patients with a durable CBR (n = 5) and nonresponders (n = 9). Box and whiskers represent the mean ± standard deviation, and each dot represents 1 patient. Original magnification, ×40 (A and DG). Higher-magnification images in and A and G were generated in Photoshop by selecting the indicated areas using the crop tool, and then expanding the areas. *P < 0.05, **P < 0.01, and ***P < 0.001, by 2-way ANOVA followed by multiple-comparison correction (BF) and the Mann-Whitney U test (H).
Figure 7
Figure 7. Increased expression levels of PD-L1 and A2AR within tumors related to a favorable clinical response to G+P treatment.
(A) Representative multiplex (upper panel) and singlet immunostaining (lower panels) images for the following markers: PD-L1, NY-ESO-1, A2AR, CD8, PanCK, and DAPI. Original magnification, ×40. (B) Comparison of PD-L1 expression in tumors by combined positive score (CPS) between patients with a durable CBR (n = 5) and nonresponders (n = 9). (C and D) Expression levels of PD-L1 on total cells (C) and on PanCK+ tumor cells (D) at C1D1 and C2D8 between patients with a durable CBR (n = 5) and nonresponders (n = 9). (E) Touching events between PD-L1+ cells and CD8+ cells at C1D1 and C2D8 in cells from patients with a durable CBR (n = 5) and nonresponders (n = 9). (F and G) Expression levels of A2AR on tumor cells (F) or on tumor nest–infiltrating CD8+ T cells (G) at C1D1 and C2D8 between patients with a durable CBR (n = 5) and nonresponders (n = 9). Box and whiskers represent the mean ± standard deviation, and each point represents 1 patient. *P < 0.05, **P < 0.01, and ***P < 0.001, by 2-way ANOVA with multiple-comparison correction (B and EG), and 2-tailed paired t test (C and D).

Comment in

References

    1. Garon EB, et al. Pembrolizumab for the treatment of non-small-cell lung cancer. N Engl J Med. 2015;372(21):2018–2028. doi: 10.1056/NEJMoa1501824. - DOI - PubMed
    1. Barber E, Matei D. Immunotherapy in ovarian cancer: we are not there yet. Lancet Oncol. 2021;22(7):903–905. doi: 10.1016/S1470-2045(21)00303-X. - DOI - PMC - PubMed
    1. Varga A, et al. Pembrolizumab in patients with programmed death ligand 1-positive advanced ovarian cancer: analysis of KEYNOTE-028. Gynecol Oncol. 2019;152(2):243–250. doi: 10.1016/j.ygyno.2018.11.017. - DOI - PubMed
    1. Disis ML, et al. Efficacy and safety of avelumab for patients with recurrent or refractory ovarian cancer: phase 1b results from the JAVELIN Solid Tumor Trial. JAMA Oncol. 2019;5(3):393–401. doi: 10.1001/jamaoncol.2018.6258. - DOI - PMC - PubMed
    1. Pujade-Lauraine E, et al. Avelumab alone or in combination with chemotherapy versus chemotherapy alone in platinum-resistant or platinum-refractory ovarian cancer (JAVELIN Ovarian 200): an open-label, three-arm, randomised, phase 3 study. Lancet Oncol. 2021;22(7):1034–1046. doi: 10.1016/S1470-2045(21)00216-3. - DOI - PubMed

Publication types

Associated data