. 2022 Oct;22(10):2306-2322.
doi: 10.1111/ajt.17116. Epub 2022 Jun 15.

Murine cytomegalovirus promotes renal allograft inflammation via Th1/17 cells and IL-17A

Affiliations

Murine cytomegalovirus promotes renal allograft inflammation via Th1/17 cells and IL-17A

Ravi Dhital et al. Am J Transplant. 2022 Oct.

Abstract

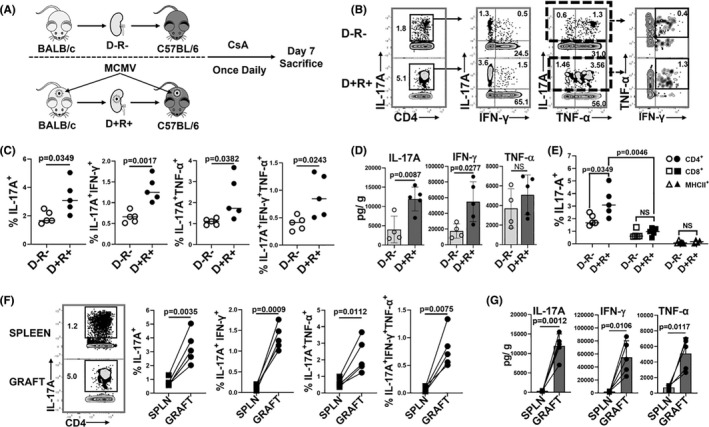
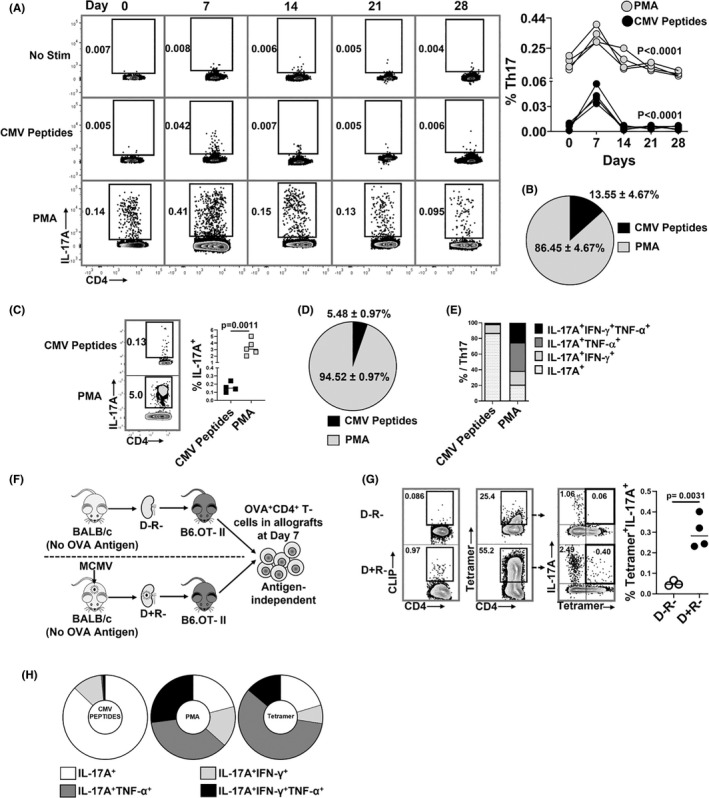
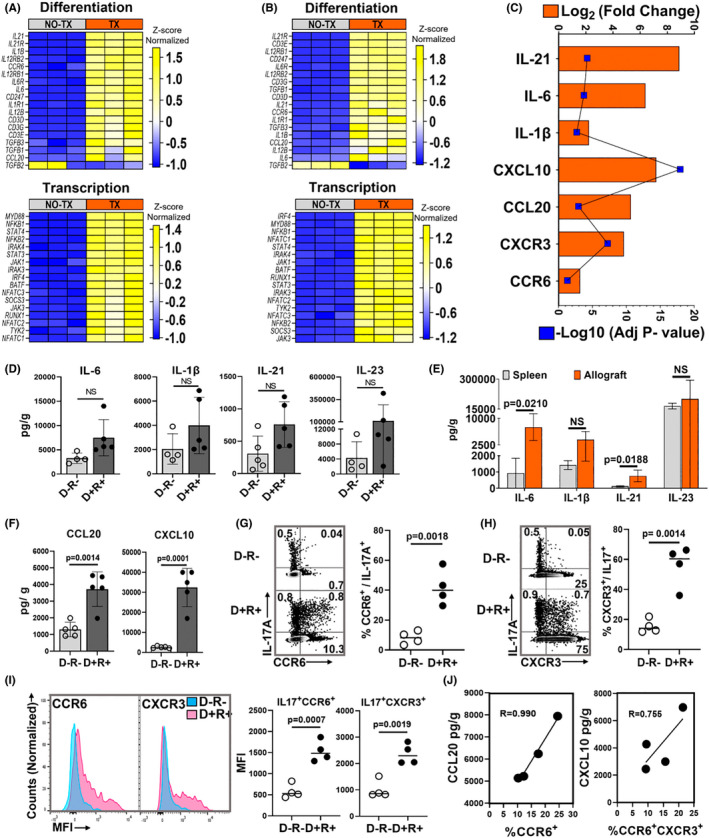
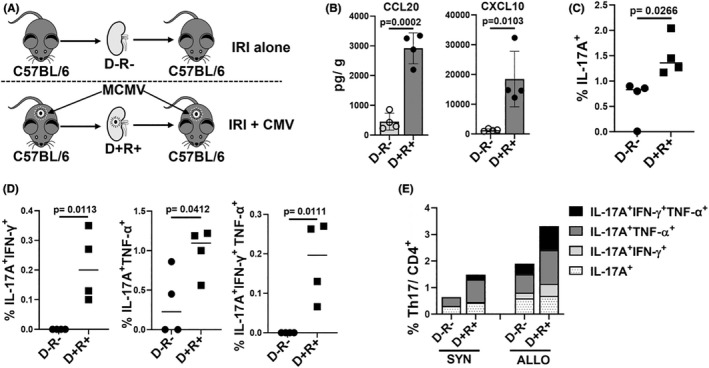
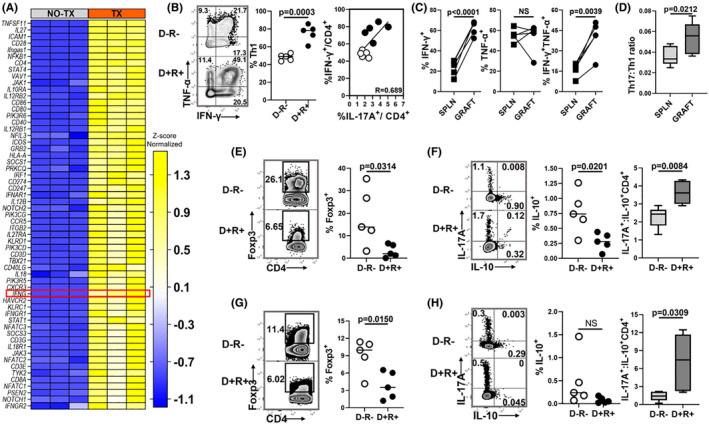
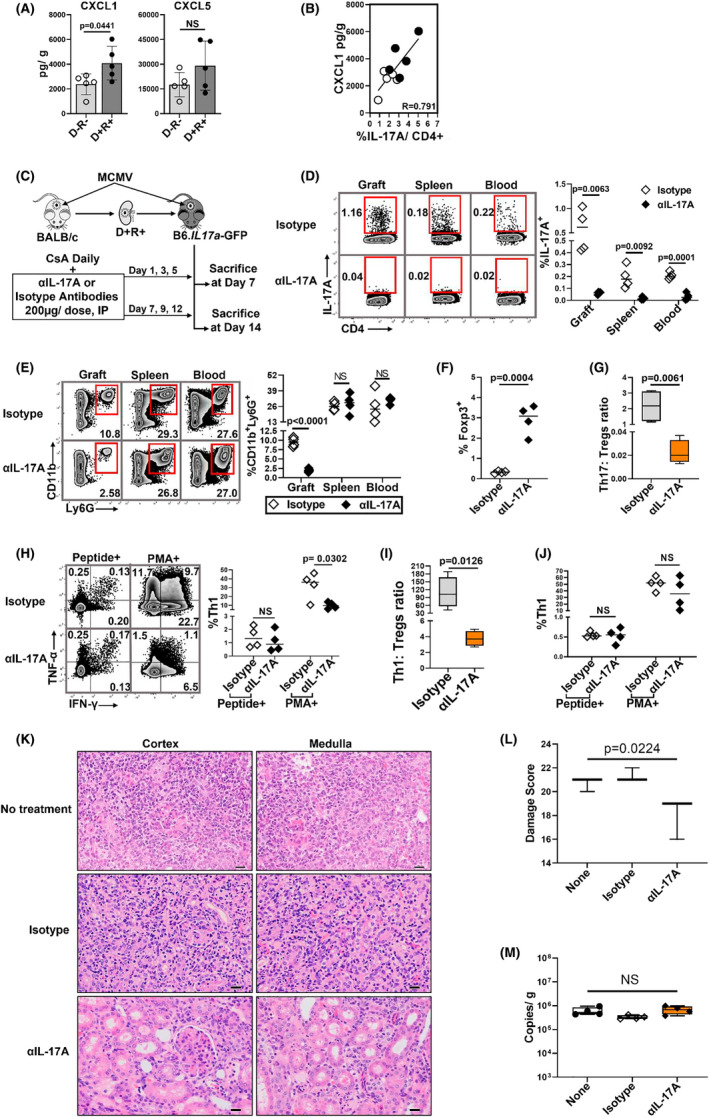
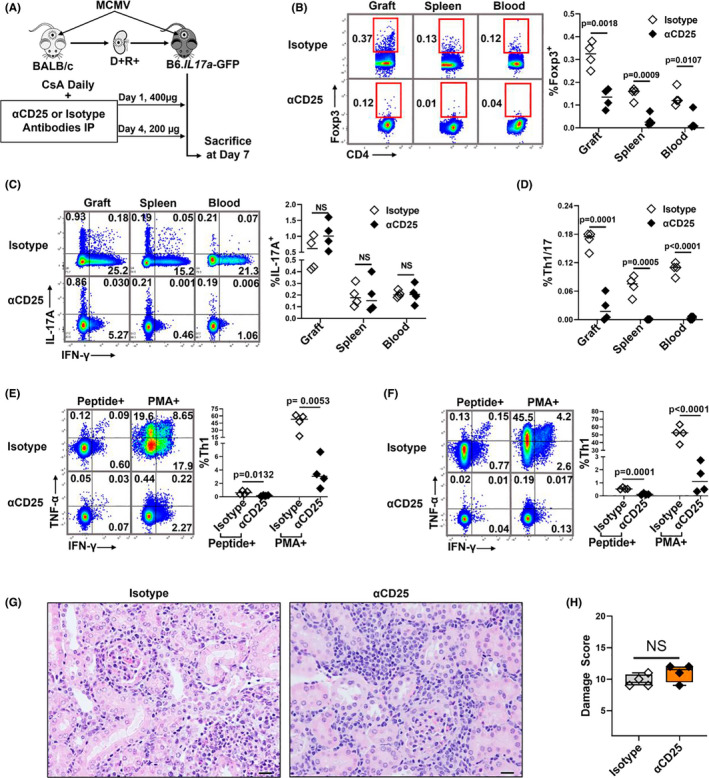
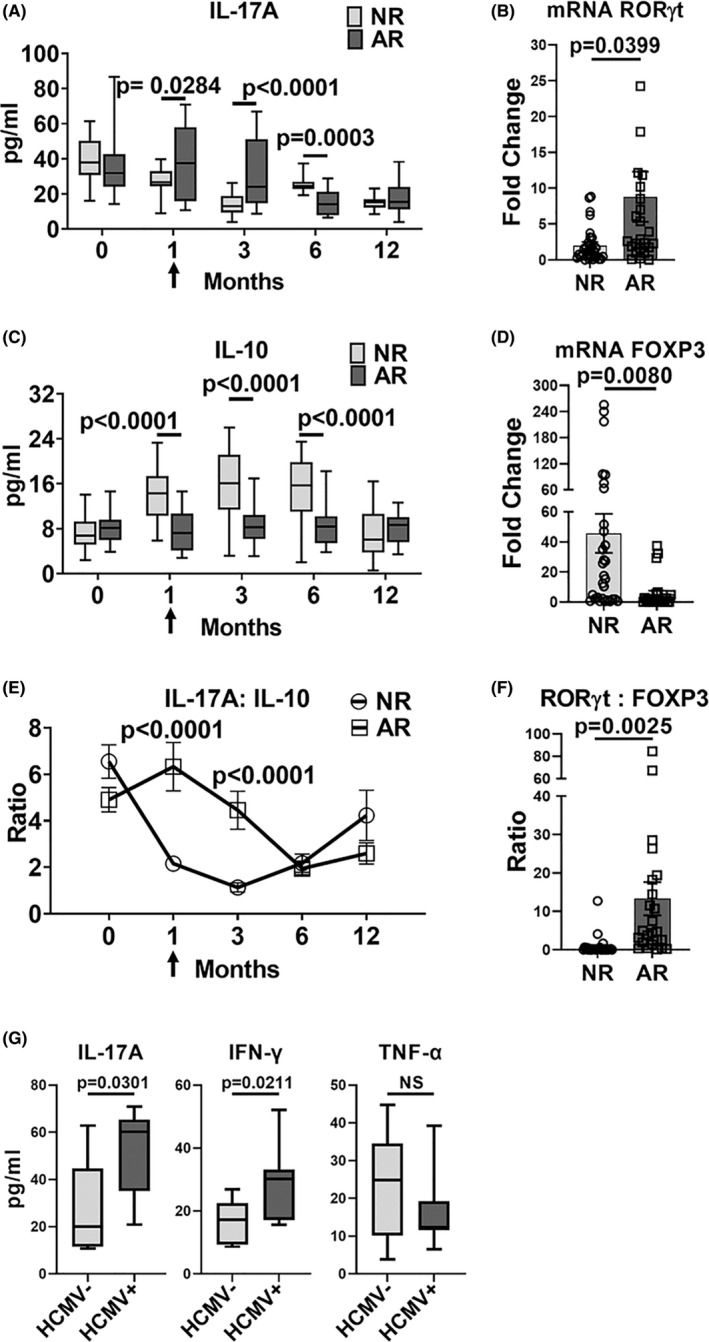
Human cytomegalovirus (HCMV) infection is associated with renal allograft failure. Allograft damage in animal models is accelerated by CMV-induced T helper 17 (Th17) cell infiltrates. However, the mechanisms whereby CMV promotes Th17 cell-mediated pathological organ inflammation are uncharacterized. Here we demonstrate that murine CMV (MCMV)-induced intragraft Th17 cells have a Th1/17 phenotype co-expressing IFN-γ and/or TNF-α, but only a minority of these cells are MCMV specific. Instead, MCMV promotes intragraft expression of CCL20 and CXCL10, which are associated with recruitment of CCR6+ CXCR3+ Th17 cells. MCMV also enhances Th17 cell infiltrates after ischemia-reperfusion injury, independent of allogeneic responses. Pharmacologic inhibition of the Th17 cell signature cytokine, IL-17A, ameliorates MCMV-associated allograft damage without increasing intragraft viral loads or reducing MCMV-specific Th1 cell infiltrates. Clinically, HCMV DNAemia is associated with higher serum IL-17A among renal transplant patients with acute rejection, linking HCMV reactivation with Th17 cell cytokine expression. In summary, CMV promotes allograft damage via cytokine-mediated Th1/17 cell recruitment, which may be pharmacologically targeted to mitigate graft injury while preserving antiviral T cell immunity.

Keywords: basic (laboratory) research/science; chemokines/chemokine receptors; clinical research/practice; infection and infectious agents-viral: cytomegalovirus (CMV); kidney transplantation/nephrology; rejection: acute, cytokines/cytokine receptors.


Figures

FIGURE 1
FIGURE 1
MCMV induces intragraft infiltration of Th17 cells co‐expressing Th1 cytokines. (A) Study design. Renal transplantation was performed between BALB/c and C57BL/6 mice with cyclosporine A (CsA) subcutaneous injections given daily for posttransplant immunosuppression. On day 7, splenocytes and intragraft leukocytes were analyzed by flow cytometry. (B) Representative flow cytometry plots showing frequencies of CD4+IL‐17A+ (Th17) cells and cytokine expression profiles. (C) Frequencies of cytokine‐expressing Th17 cell subsets were compared for D−R− and D+R+ allografts. (D) Intragraft quantities of IL‐17A, IFN‐γ, and TNF‐α (picogram per gram tissue, pg/g) in D−R− and D+R+ allografts. (E) Frequencies of IL‐17A expressing CD4+, CD8+, and MHC‐II+ leukocytes in D−R− and D+R+ allografts. (F) Representative flow plots and frequencies of Th17 cells in D+R+ spleens (SPLN) and allografts (GRAFT). (G) Cytokine quantities (pg/g) in D+R+ spleens and allografts. All data are represented as mean ± standard deviation (SD) and analyzed by two‐sided Student's t‐test. NS, not significant (p > .05)
FIGURE 2
FIGURE 2
MCMV‐specific and antigen‐independent Th17 cells infiltrate virus‐infected allografts. (A,‐B) Non‐transplant B6 mice were infected with MCMV on day 0 and splenic Th17 cell frequencies were quantified at days 0, 7, 14, 21, and 28 post‐infection. Splenocytes were stimulated with either PMA or MCMV peptides and stained for IL‐17A expressing CD4+ T cells. (A) Representative flow plots showing frequencies of MCMV‐specific and PMA+ Th17 cells at indicated days; graph shows frequencies of PMA+ (gray circles) and MCMV‐specific (black circles) Th17 cells over time. (B) Pie chart shows the percentages of MCMV‐specific and PMA+ Th17 cells in non‐transplant spleens at day 7 post‐infection. (C) Representative flow plots and frequencies of CMV‐specific (CMV peptides+) and total (PMA+) Th17 cells in allografts of D+R+ transplant recipients. (D) Pie chart shows percentages of MCMV‐specific and PMA+ Th17 cells in D+R+ allografts. (E) Proportions of intragraft Th17 cells expressing IL‐17A, IFN‐γ, and/or TNF‐α, compared between Th17 cells responding to MCMV peptides or PMA in D+R+ allografts. (F) Experimental design. B6.OT‐II transgenic recipients received D− or D+ allografts lacking expression of OVA antigen, so that OVA+ Th17 cells are recruited to allografts by antigen‐independent mechanisms. (G) OVA‐specific Th17 cells were detected using I‐Ab‐OVA323–339‐APC tetramer staining, with human CLIP‐APC tetramer used as control (Figure S3). Representative flow plots show tetramer staining of CD4+ T cells derived from D−R− and D+R+ allografts. Graph shows the frequencies of OVA tetramer+ Th17 cells compared between the groups. (H) Cytokine expression profiles were compared for intragraft MCMV specific and PMA+ Th17 cells in wild‐type recipients, and for OVA tetramer+ Th17 cells from OTII recipients. Data are represented as mean ± standard deviation (SD) and are analyzed by two‐sided Student's t‐test (C,G) or one‐way ANOVA (A).
FIGURE 3
FIGURE 3
MCMV‐infected allograft microenvironment favors Th17 cell recruitment. (A–C) Gene expression profiles by RNA‐seq. (A) Heat map shows differentially expressed genes encoding molecules required for Th17 cell differentiation and transcription factors between D+ allografts (TX) and infected non‐transplant kidneys (NO‐TX) and (B) differentially expressed Th17 cell‐related genes between D− allografts (TX) and uninfected non‐transplant kidneys (NO‐TX). Each column represents a single sample whereas rows represent intensities of gene expression. Hierarchical clustering of the genes was performed based on the average column z‐score, highest (top) to lowest (bottom). (C) Transcripts for Th17 cell differentiating cytokines and recruiting chemokines are upregulated in D+ transplants compared to MCMV‐infected native kidneys. (D) Comparison of intragraft Th17 cell differentiating cytokine quantities between D−R− and D+R+ transplants. (E) Quantities of Th17 cell differentiating cytokines in D+R+ spleens and allografts. (F) Comparison of Th17 cell recruiting chemokine quantities in D−R− and D+R+ allografts. (G,H) Representative flow plots and frequencies of CCR6+ and CXCR3+ Th17 cells in D−R− and D+R+ allografts. (I) Mean fluorescence intensity (MFI) of CCR6 and CXCR3 expression for Th17 cells from D−R− (blue) and D+R+ (pink) allografts. (J) Correlation between intragraft chemokines and receptors expressed by Th17 cells from D+R+ transplants. All data are represented as mean ± standard deviation (SD) and are analyzed by two‐sided Student's t‐test or Pearson correlation. NS, not significant (p > .05)
FIGURE 4
FIGURE 4
Ischemia reperfusion injury, MCMV infection, and allogeneic transplantation each contribute to intragraft Th17 cell infiltration. (A) Syngeneic transplantation was performed using D−R− and D+R+ grafts to evaluate role of ischemia–reperfusion injury (IRI) without alloimmune responses. (B) CCL20 and CXCL10 quantities in D−R− and D+R+ syngeneic transplants. (C) Frequencies of Th17 infiltrates in syngeneic D−R− and D+R+ grafts. (D) Intragraft Th17 cells co‐expressing IFN‐γ and/or TNF‐α in D−R− and D+R+ grafts. (E) Percentage and proportions of single or multiple cytokines expressing Th17 cells in syngeneic and allogeneic grafts. For (A–D), data are represented as mean ± standard deviation (SD) and are analyzed by two‐sided Student's t‐test. For (E), mean values are shown.
FIGURE 5
FIGURE 5
MCMV infection is associated with increased Th1 cells and decreased Tregs. (A) Heat map shows differential expression of transcripts involved with Th1 cell activation in D+ allografts (TX) compared to non‐transplant MCMV‐infected kidneys (NO TX). Hierarchical clustering of the genes was performed based on the average column z‐score, highest to lowest. (B) Representative flow plots and frequencies of Th1 cells in D−R− and D+ R+ allografts. Intragraft frequencies of Th17 cells were correlated with Th1 cells in D−R− and D+ R+ transplants. (C) Frequencies of IFN‐γ and/or TNF‐α expressing Th1 cells in D+R+ spleens and allografts. (D) Ratio of Th17:Th1 cell infiltrates in D+R+ spleens and allografts. (E,F) Representative flow plots and frequencies of (E) Foxp3+ Tregs and (F) IL‐10 expressing Tregs in allografts. (F) Box plot shows ratio of Th17:Treg cells (IL‐17A+: IL‐10+ CD4+). (G,H) Representative flow plots and frequencies of (G) Foxp3+ Tregs and (H) IL‐10 expressing Tregs in spleens. (H) Box plot shows ratio of Th17:Treg cells in spleens. All data are represented as mean ± standard deviation (SD) and are analyzed by two‐sided Student's t‐test or Pearson correlation. NS, not significant (p > .05)
FIGURE 6
FIGURE 6
IL‐17A inhibition modulates neutrophil, Th1/Treg cell infiltrates and reduces allograft injury. (A) IL‐17A induced neutrophil chemoattractants, CXCL1 and CXCL5, were compared for D−R− and D+R+ allografts. (B) Correlation between intragraft CXCL1 and Th17 cell infiltrates. (C) Study design. D + R+ recipients were treated with αIL‐17A antibodies or isotype control antibodies at 200 μg/dose, intraperitoneally (IP), on indicated days post‐transplantation and sacrificed at day 7 or 14. (D–J) Day 7 post‐transplantation. (D) Representative flow plots and frequencies of Th17 cells in allograft, spleen, and peripheral blood of recipient mice from αIL‐17A treated and isotype control groups. (E) Representative flow plots and frequencies of CD11b+Ly6G+ neutrophils in organs and blood of αIL‐17A and isotype treated transplant recipients. (F) Frequencies of Foxp3+ Tregs in allografts of αIL‐17A and isotype treated mice. (G) Intragraft Th17:Tregs ratio between the groups. (H) Representative flow plots and frequencies of MCMV‐specific and PMA+ intragraft Th1 cell infiltrates between the groups. (I) Ratio of Th1:Tregs in allografts. (J) Frequencies of MCMV‐specific and PMA+ Th1 cells in spleens. (K) Day 14 posttransplant, hematoxylin and eosin (H&E) stained allografts from D+R+ No treatment (none), isotype control and αIL‐17A treated groups (40×). Scale bar 20 μm. (L) Histopathology was scored in blinded fashion using grading scale as shown in Table S3. (M) Viral loads in allografts. All data are represented as mean ± standard deviation (SD) and are analyzed by two‐sided Student's t‐test, Pearson correlation and ANOVA. NS, not significant (p > .05)
FIGURE 7
FIGURE 7
Depletion of Tregs and Th1 cells does not change allograft damage in the presence of Th17 cells. (A) D+R+ recipients were treated with αCD25 antibodies or isotype control antibodies at days 1 (400 μg) and 4 (200 μg) post‐transplantation and sacrificed at day 7. (B) Representative flow plots and summary data showing frequencies of Foxp3+ Tregs between αCD25‐treated mice and isotype controls. (C,D) Representative flow plots and summary data showing the frequencies of Th17 and Th1/17 cells between the groups. (E,F) Representative flow plots and summary data showing the frequencies of total (PMA+) and MCMV‐specific (Peptide+) Th1 cells in allografts (E) and spleens (F) between the groups. (G) H&E‐stained allografts from αCD25 treated and control groups (40×). Scale bar 20 μm. (H) Damage score. All data are represented as mean ± standard deviation (SD) and are analyzed by two‐sided Student's t‐test and ANOVA. NS, not significant (p > .05)
FIGURE 8
FIGURE 8
CMV DNAemia is associated with elevated serum IL‐17A and IFN‐γ in kidney transplant patients with acute rejection. Clinical renal transplant recipients with acute rejection (AR, N = 24) were compared to those with no rejection (NR, N = 29) over the first 12 months posttransplant. Blood was analyzed at pretransplant (0), 1‐, 3‐, 6‐ and 12‐month posttransplant and at the time of AR (arrow). (A,C,E) Serum cytokine levels were measured at indicated posttransplant timepoints. (B,D) Expression of transcription factors were quantified in whole blood by RT‐PCR at the time of AR. (F) RORγt:FOXP3 mRNA ratio was compared at the time of rejection for AR and NR groups. (G) HCMV DNAemia in the AR group was determined by quantitative DNA PCR. Serum cytokine quantities were compared for patients with (HCMV+) and without (HCMV−) HCMV DNAemia. All data are represented as mean ± SEM and are analyzed by two‐sided Student's t‐test. NS, not significant (p > .05)

Similar articles

Cited by

References

    1. Das B, Kaur G, Basu S. Seroprevalence of cytomegalovirus antibodies among blood donors and multitransfused recipients–a study from North India. Transfus Apher Sci. 2014;50(3):438‐442. doi:10.1016/j.transci.2014.02.022 - DOI - PubMed
    1. Lachmann R, Loenenbach A, Waterboer T, et al. Cytomegalovirus (CMV) seroprevalence in the adult population of Germany. PLoS One. 2018;13(7):e0200267. doi:10.1371/journal.pone.0200267 - DOI - PMC - PubMed
    1. Warnecke JM, Pollmann M, Borchardt‐Loholter V, et al. Seroprevalences of antibodies against torch infectious pathogens in women of childbearing age residing in Brazil, Mexico, Germany, Poland, Turkey and China. Epidemiol Infect. 2020;148:e271. doi:10.1017/S0950268820002629 - DOI - PMC - PubMed
    1. Bate SL, Dollard SC, Cannon MJ. Cytomegalovirus seroprevalence in the United States: the national health and nutrition examination surveys, 1988‐2004. Clin Infect Dis. 2010;50(11):1439‐1447. doi:10.1086/652438 - DOI - PMC - PubMed
    1. Myerson D, Hackman RC, Nelson JA, Ward DC, McDougall JK. Widespread presence of histologically occult cytomegalovirus. Hum Pathol. 1984;15(5):430‐439. doi:10.1016/s0046-8177(84)80076-3 - DOI - PubMed

Publication types