. 2022 Jun 21;38(24):7496-7511.
doi: 10.1021/acs.langmuir.2c00471. Epub 2022 Jun 7.

Multiscale Simulation of Ternary Stratum Corneum Lipid Mixtures: Effects of Cholesterol Composition

Affiliations

Multiscale Simulation of Ternary Stratum Corneum Lipid Mixtures: Effects of Cholesterol Composition

Parashara Shamaprasad et al. Langmuir. .

Abstract

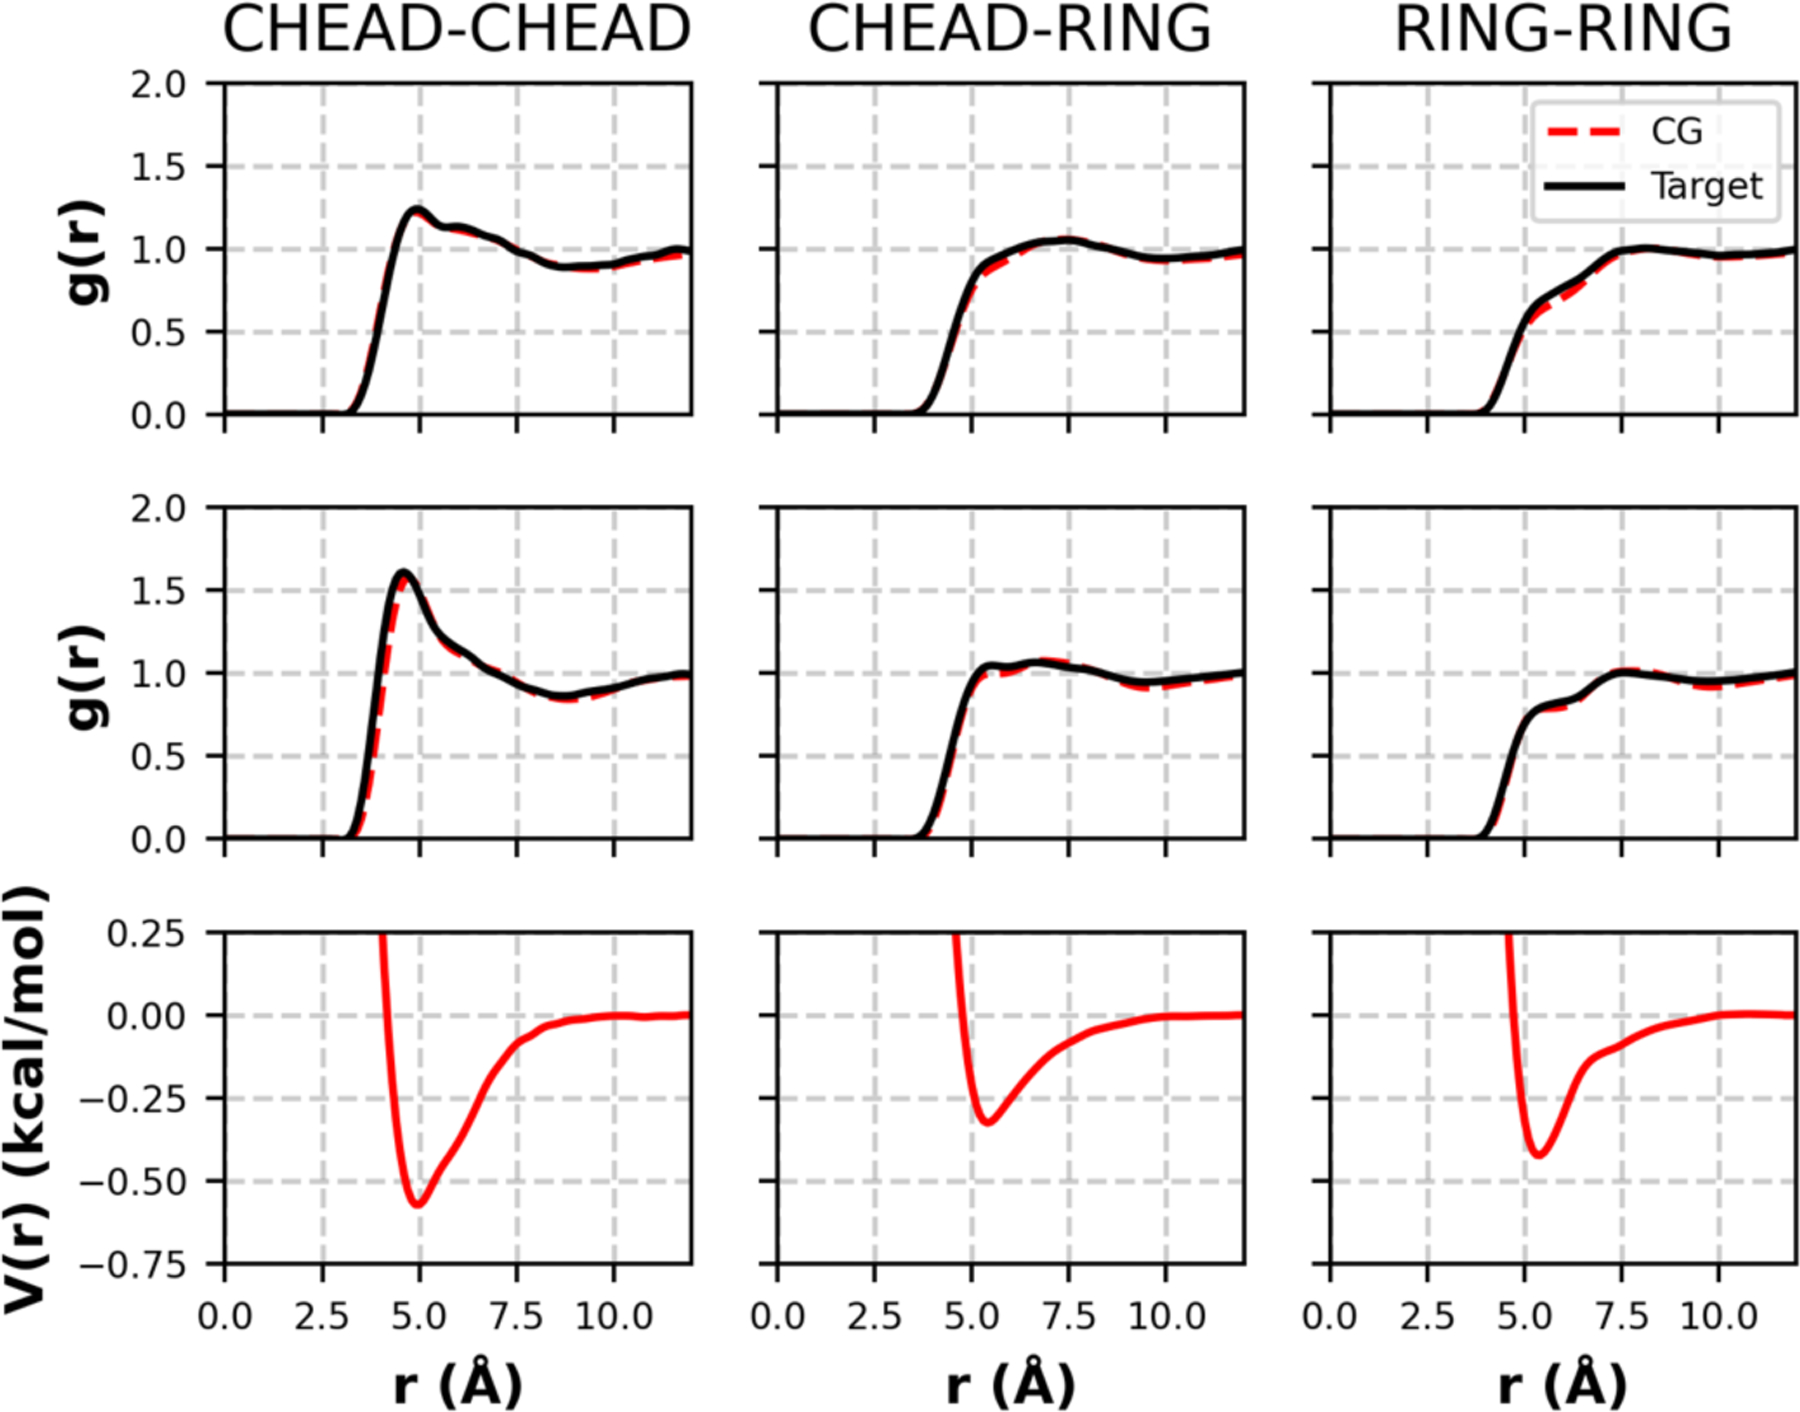
Molecular dynamics simulations of mixtures of the ceramide nonhydroxy-sphingosine (NS), cholesterol, and a free fatty acid are performed to gain molecular-level understanding of the structure of the lipids found in the stratum corneum layer of skin. A new coarse-grained force field for cholesterol was developed using the multistate iterative Boltzmann inversion (MS-IBI) method. The coarse-grained cholesterol force field is compatible with previously developed coarse-grained force fields for ceramide NS, free fatty acids, and water and validated against atomistic simulations of these lipids using the CHARMM force field. Self-assembly simulations of multilayer structures using these coarse-grained force fields are performed, revealing that a large fraction of the ceramides adopt extended conformations, which cannot occur in the single bilayer in water structures typically studied using molecular simulation. Cholesterol fluidizes the membrane by promoting packing defects, and an increase in cholesterol content is found to reduce the bilayer thickness due to an increase in interdigitation of the C24 lipid tails, consistent with experimental observations. Using a reverse-mapping procedure, a self-assembled coarse-grained multilayer system is used to construct an equivalent structure with atomistic resolution. Simulations of this atomistic structure are found to closely agree with experimentally derived neutron scattering length density profiles. Significant interlayer hydrogen bonding is observed in the inner layers of the atomistic multilayer structure that are not found in the outer layers in contact with water or in equivalent bilayer structures. This work highlights the importance of simulating multilayer structures, as compared to the more commonly studied bilayer systems, to enable more appropriate comparisons with multilayer experimental membranes. These results also provide validation of the efficacy of the MS-IBI derived coarse-grained force fields and the framework for multiscale simulation.


Figures

Figure 1:
Figure 1:
a) CG mapping scheme for CHOL, where the A, B, C, and D rings of the skeletal structure are labeled, c) FFA C24, and d) CER NS C24. In all cases, CG beads are spherically symmetric. CG representation of d) CHOL, e) FFA C24, f) CER NS C24 in a hairpin configuration, and e) CER NS C24 in an extended configuration. CG mappings are colored to be consistent with simulation renderings in this work: CHEAD is black, CBODY (i.e., RING1–4, CHME, CTAIL, CTERM beads) yellow, FHEAD is purple, TAIL and TER2 are gray, OH1 and OH2 are red, MHEAD2 is cyan, and AMIDE is blue.
Figure 2:
Figure 2:
RDFs and pair potentials from the pure CHOL force field optimization. Top: target and CG RDFs at the 550K NPT state; middle: target and CG RDFs from the 400K NVT state; bottom: pair potential that yields the CG RDFs above. Each column corresponds to the pair interaction listed at the top of the column.
Figure 3:
Figure 3:
Simulation snapshots of self-assembled mixtures of CER NS C24:CHOL:FFA C24 A) in bilayer (2-leaflet) and B) 4-leaflet configuration with a 1:0.5:1 molar ratio; C-F are 6-leaflet configurations with mole ratios of C) 1:0:1, D) 1:0.2:1, E) 1:0.5:1, and F) 1:1:1. Water is represented as transparent volumes determined using the QuickSurf representation in VMD. For clarity lipid backbones are represented as a stick model, with headgroup beads rendered as spheres, following the color scheme described in Figure 1.
Figure 4:
Figure 4:
Average structural properties for the inner and outer bilayers of the 6-leaflet system with varying CHOL:CER molar ratio in an equimolar mixture of CER NS C24:FFA C24. a) % CERs in an extended conformation (calculated from the four inner leaflets), b) NLA, c) tilt angle, d) S2, e) bilayer thickness, and f) interdigitation. Results shown are the mean ± pooled standard deviation of four simulations. In some cases, the error bars are smaller than the symbol size. Experimental bilayer thicknesses are repeat distance measurements for the SCSSPP system from Mojumdar et al. (this mixture of 5 different CERs combined with equimolar amounts of CHOL and an FFA mixture with tail length varying from C16 to C26 is described in the introduction and the text discussing Figure 6).
Figure 5:
Figure 5:
A) Mean cluster size (defined as the number of each lipid type in a cluster) for lipid tails in the inner leaflets; sphingosine and fatty acid tails of CER NS C24 are designated respectively as FA and SPH. B) CHOL-X coordination numbers, where X is either CHOL, FFA C24, the sphingosine chain of CER NS C24 (SPH), or the fatty acid chain of CER NS C24 (FA). Results shown are the mean ± pooled standard deviation of four simulations.
Figure 6:
Figure 6:
a) Simulation snapshot of a reverse-mapped atomistic 1:0.5:1 CER NS C24:CHOL:FFA C24 6-leaflet system with lipids colored according to the images in b). A 1-nm thick slice is highlighted in a) and shown in detail in Figure 7a. c) Protiated NSLD profiles for the inner bilayer (i.e., inner 2 leaflets) from the atomistic multilayer simulation shown in a) compared with experimental results for the SCSSPP system from Groen et al. (see text for system composition) and an equivalent composition atomistic bilayer simulation used to validate the CG force field (see Table 1).
Figure 7:
Figure 7:
a) Slice from the center of the simulation cell for the 1:0.5:1 molar ratio of CER NS C24:CHOL:FFA C24 6-leaflet system shown in Figure 6a using the color scheme specified in Figure 6b. b) Density profile of CER NS, CHOL, FFA. The density profile of the oxygen in the CHOL headgroup is also plotted, with the numerical values scaled by a factor of 10 to make them visible on this plot. c) Density profile for CER NS showing the hairpin and extended conformations separately.

References

    1. Motta S, Monti M, Sesana S, Caputo R, Carelli S, Ghidoni R. Ceramide composition of the psoriatic scale. Biochim Biophys Acta - Mol Basis Dis 1993;1182(2):147–151. doi:10.1016/0925-4439(93)90135-N - DOI - PubMed
    1. Kawana M, Miyamoto M, Ohno Y, Kihara A. Comparative profiling and comprehensive quantification of stratum corneum ceramides in humans and mice by LC/MS/MS. J Lipid Res 2020;61(6):884–895. doi:10.1194/jlr.RA120000671 - DOI - PMC - PubMed
    1. Van Smeden J, Janssens M, Kaye ECJ, et al. The importance of free fatty acid chain length for the skin barrier function in atopic eczema patients. Exp Dermatol 2014;23(1):45–52. doi:10.1111/exd.12293 - DOI - PubMed
    1. Van Smeden J, Boiten WA, Hankemeier T, Rissmann R, Bouwstra JA, Vreeken RJ. Combined LC/MS-platform for analysis of all major stratum corneum lipids, and the profiling of skin substitutes. Biochim Biophys Acta - Mol Cell Biol Lipids 2014;1841(1):70–79. doi:10.1016/j.bbalip.2013.10.002 - DOI - PubMed
    1. Van Smeden J, Janssens M, Gooris GSS, Bouwstra JAA. The important role of stratum corneum lipids for the cutaneous barrier function. Biochim Biophys Acta - Mol Cell Biol Lipids 2014;1841(3):295–313. doi:10.1016/j.bbalip.2013.11.00 - DOI - PubMed

Publication types