Clinical Trial
. 2022 Aug 18;140(7):685-705.
doi: 10.1182/blood.2022016196.

Outcomes following treatment for ADA-deficient severe combined immunodeficiency: a report from the PIDTC

Affiliations
Clinical Trial

Outcomes following treatment for ADA-deficient severe combined immunodeficiency: a report from the PIDTC

Geoffrey D E Cuvelier et al. Blood. .

Abstract

Adenosine deaminase (ADA) deficiency causes ∼13% of cases of severe combined immune deficiency (SCID). Treatments include enzyme replacement therapy (ERT), hematopoietic cell transplant (HCT), and gene therapy (GT). We evaluated 131 patients with ADA-SCID diagnosed between 1982 and 2017 who were enrolled in the Primary Immune Deficiency Treatment Consortium SCID studies. Baseline clinical, immunologic, genetic characteristics, and treatment outcomes were analyzed. First definitive cellular therapy (FDCT) included 56 receiving HCT without preceding ERT (HCT); 31 HCT preceded by ERT (ERT-HCT); and 33 GT preceded by ERT (ERT-GT). Five-year event-free survival (EFS, alive, no need for further ERT or cellular therapy) was 49.5% (HCT), 73% (ERT-HCT), and 75.3% (ERT-GT; P < .01). Overall survival (OS) at 5 years after FDCT was 72.5% (HCT), 79.6% (ERT-HCT), and 100% (ERT-GT; P = .01). Five-year OS was superior for patients undergoing HCT at <3.5 months of age (91.6% vs 68% if ≥3.5 months, P = .02). Active infection at the time of HCT (regardless of ERT) decreased 5-year EFS (33.1% vs 68.2%, P < .01) and OS (64.7% vs 82.3%, P = .02). Five-year EFS (90.5%) and OS (100%) were best for matched sibling and matched family donors (MSD/MFD). For patients treated after the year 2000 and without active infection at the time of FDCT, no difference in 5-year EFS or OS was found between HCT using a variety of transplant approaches and ERT-GT. This suggests alternative donor HCT may be considered when MSD/MFD HCT and GT are not available, particularly when newborn screening identifies patients with ADA-SCID soon after birth and before the onset of infections. This trial was registered at www.clinicaltrials.gov as #NCT01186913 and #NCT01346150.


Figures

None
Graphical abstract
Figure 1.
Figure 1.
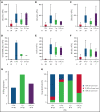
Immune reconstitution of T cells (CD3+, CD4+, CD8+, CD4+CD45RA+), B cells (CD19/20+), and NK cells (CD56+) while receiving ERT. Patients included those who received ERT only (n = 9) and patients who received ERT before first definitive cellular therapy, censored at the time of starting HCT or GT (n = 65). The x axis refers to the time after starting ERT. Numbers below each time point indicate the number of patients with evaluable data. (A-F) Absolute numbers of cells in each lymphocyte subset at ADA diagnosis (DX) and at different time points after initiation of ERT. By comparison, the 10th percentile of lymphocyte subsets in healthy 1- to 2-year-old children are as follows (all ×106/L): CD3+, 2100; CD4+, 1300; CD8+, 620; CD4+CD45RA+, 1000; CD19 B cells, 720; CD56 NK cells, 180. (G) Proportion of patients able to discontinue immunoglobulin replacement after ERT. (H) T-cell proliferative responses to phytohemagglutinin (PHA) improve for most but not all patients with ADA SCID after 6 months of ERT. Horizontal line, median; thick vertical bars, interquartile range; thin vertical lines, range.
Figure 2.
Figure 2.
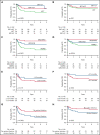
EFS and OS for ADA-SCID. (A) Five-year EFS by FDCT. (B) Five-year OS by FDCT. (C) Five-year EFS for all transplant patients (including those with and without a preceding period of ERT) by donor type. (D) Five-year OS for all transplant patients (including those with and without a preceding period of ERT) by donor type. (E) Five-year EFS for all transplant patients by age at the time of transplant. (F) Five-year OS for all transplant patients by age at the time of transplant. (G) Five-year EFS by the presence or absence of infection at the time of transplant. (H) Five-year OS by the presence or absence of active infection at the time of transplant.
Figure 3.
Figure 3.
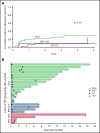
Failure of FDCT and subsequent treatments received after first definitive cellular therapy. (A) Cumulative incidence of patients receiving a second or greater therapy (ERT, GT, or HCT) after FDCT, according to FDCT received. (B) Swimmer plot showing second or greater therapy received after FDCT. Subsequent treatments are represented as circles (ERT), squares (GT), or triangles (HCT). Horizontal arrow means the patient is alive at last follow-up. No arrow means the patient died at that point in time after FDCT. Green bars represent patients receiving HCT as FDCT. Blue bars represent patients receiving ERT-GT as FDCT. All 4 patients receiving ERT-GT requiring subsequent therapy received retroviral vectors as FDCT (no patients receiving GT with lentiviral vectors required additional therapy), and ERT after GT as their second therapy. Red bars represent patients receiving ERT-HCT as FDCT.
Figure 4.
Figure 4.
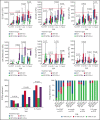
Immune reconstitution following first definitive cellular therapy. Dark horizontal line represents median. Thick vertical bars represent interquartile range. Thin vertical bars represent range. Red horizontal line represents the 10th percentile of lymphocyte subsets in healthy 1- to 2-year-old children. ERT-GT (Lv), enzyme replacement therapy followed by lentivirus gene therapy; ERT-GT (Rv), enzyme replacement therapy followed by retroviral gene therapy; FDCT, first definitive cellular therapy; Ig, immunoglobulin.
Figure 5.
Figure 5.
Survival curves for ADA-SCID in a contemporary cohort receiving FDCT after the year 2000 and without active infection at the time of definitive cellular therapy. The HCT group (n = 33) comprised a wide variety of transplant approaches (Table 4), including patients who did (n = 15) and did not (n = 18) receive ERT before HCT; and a wide variety of donor types (MSD [n = 9], MFD [n = 3], unrelated donors [n = 13], and MMRD [n = 8]), graft sources (bone marrow [n = 21], cord blood [n = 8], and peripheral blood [n = 4)], and conditioning regimens (none [n = 15], RIC [n = 6], and MAC [n = 11]). The contemporary HCT group was compared against patients receiving ERT-GT (n = 33). (A) Five-year EFS for the HCT group was 75.3% (95% CI: 56.5%-86.8%) vs 75.3% (95% CI: 34.3%-92.7%) for the GT group (P = .29, log-rank test). (B) Five-year OS for the HCT group was 90.9% (95% CI: 74.4%-97%) vs 100% (95% CI: 100%-100%) for the GT group (P = .09, log-rank test).

Comment in

  • Four decades of progress.
    Cavazzana M. Cavazzana M. Blood. 2022 Aug 18;140(7):665-666. doi: 10.1182/blood.2022017211. Blood. 2022. PMID: 35980683 No abstract available.

References

    1. Giblett ER, Anderson JE, Cohen F, Pollara B, Meuwissen HJ. Adenosine-deaminase deficiency in two patients with severely impaired cellular immunity. Lancet. 1972; 2(7786):1067-1069. - PubMed
    1. Dvorak CC, Haddad E, Buckley RH, et al. . The genetic landscape of severe combined immunodeficiency in the United States and Canada in the current era (2010-2018). J Allergy Clin Immunol. 2019;143(1):405-407. - PMC - PubMed
    1. Flinn AM, Gennery AR. Adenosine deaminase deficiency: a review. Orphanet J Rare Dis. 2018;13(1):65. - PMC - PubMed
    1. Grunebaum E, Cohen A, Roifman CM. Recent advances in understanding and managing adenosine deaminase and purine nucleoside phosphorylase deficiencies. Curr Opin Allergy Clin Immunol. 2013;13(6): 630-638. - PubMed
    1. Whitmore KV, Gaspar HB. Adenosine deaminase deficiency: more than just an immunodeficiency. Front Immunol. 2016;7:314. - PMC - PubMed

Publication types

Substances

Supplementary concepts

Associated data