. 2022 Oct 1;206(7):857-873.
doi: 10.1164/rccm.202109-2150OC.

Vasculopathy and Increased Vascular Congestion in Fatal COVID-19 and Acute Respiratory Distress Syndrome

Affiliations

Vasculopathy and Increased Vascular Congestion in Fatal COVID-19 and Acute Respiratory Distress Syndrome

Julian A Villalba et al. Am J Respir Crit Care Med. .

Abstract

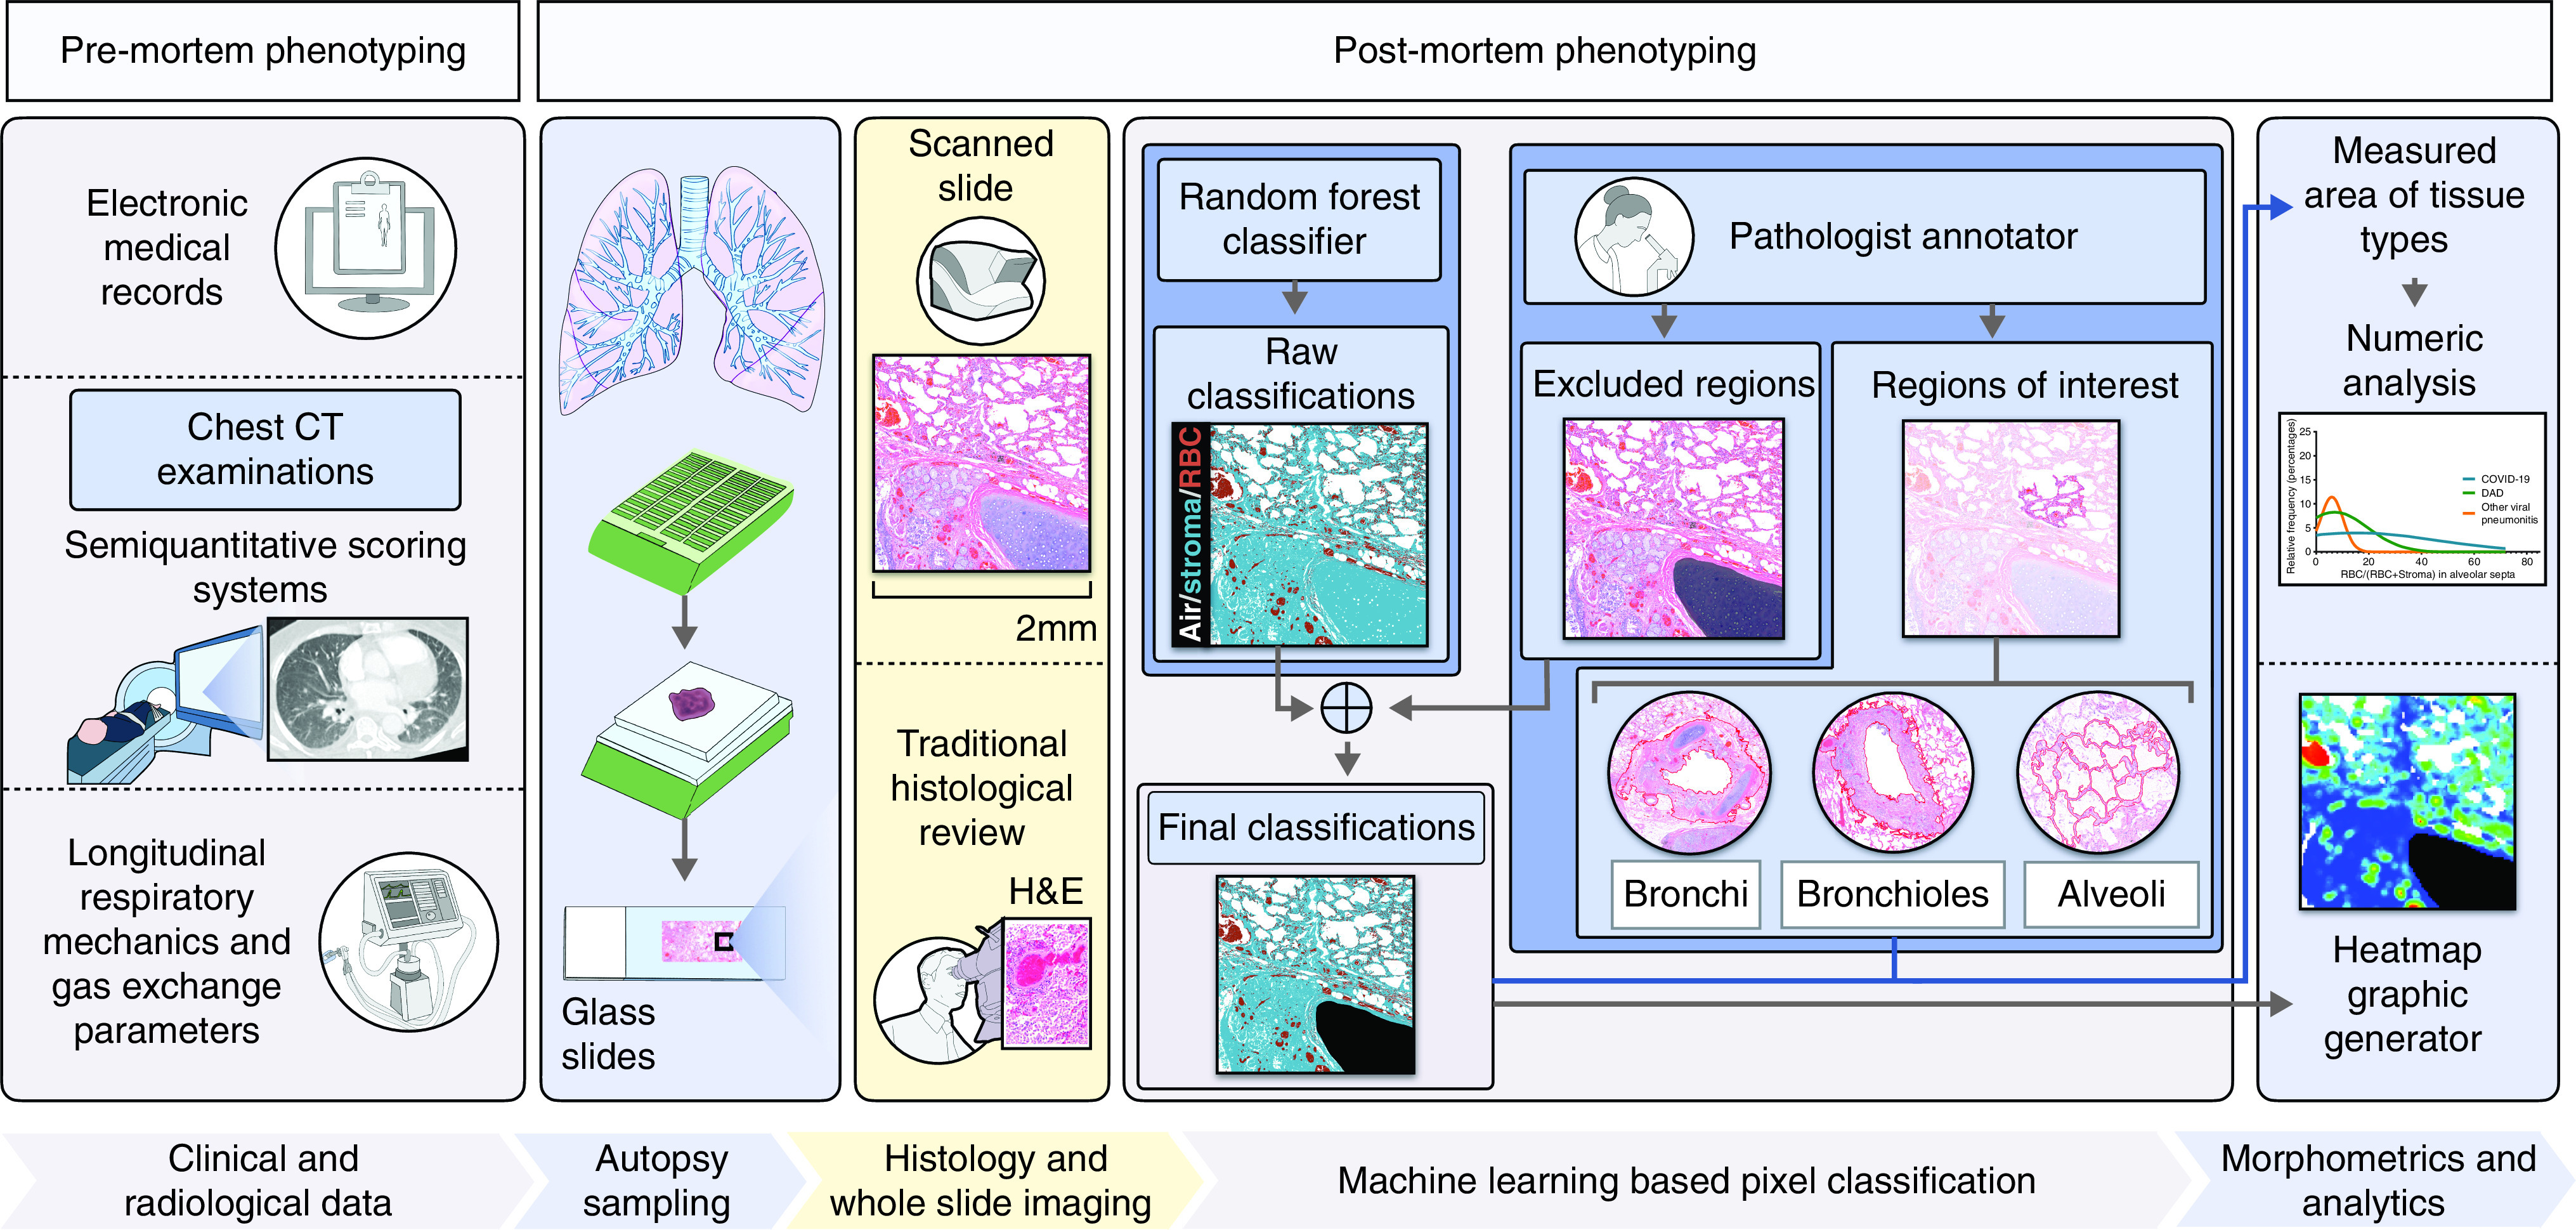
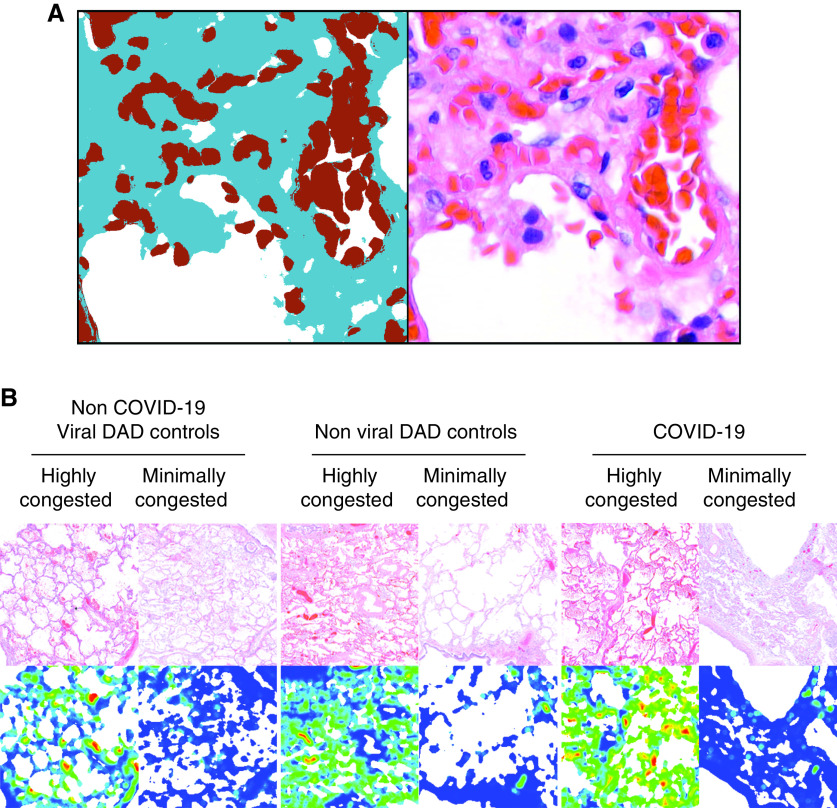
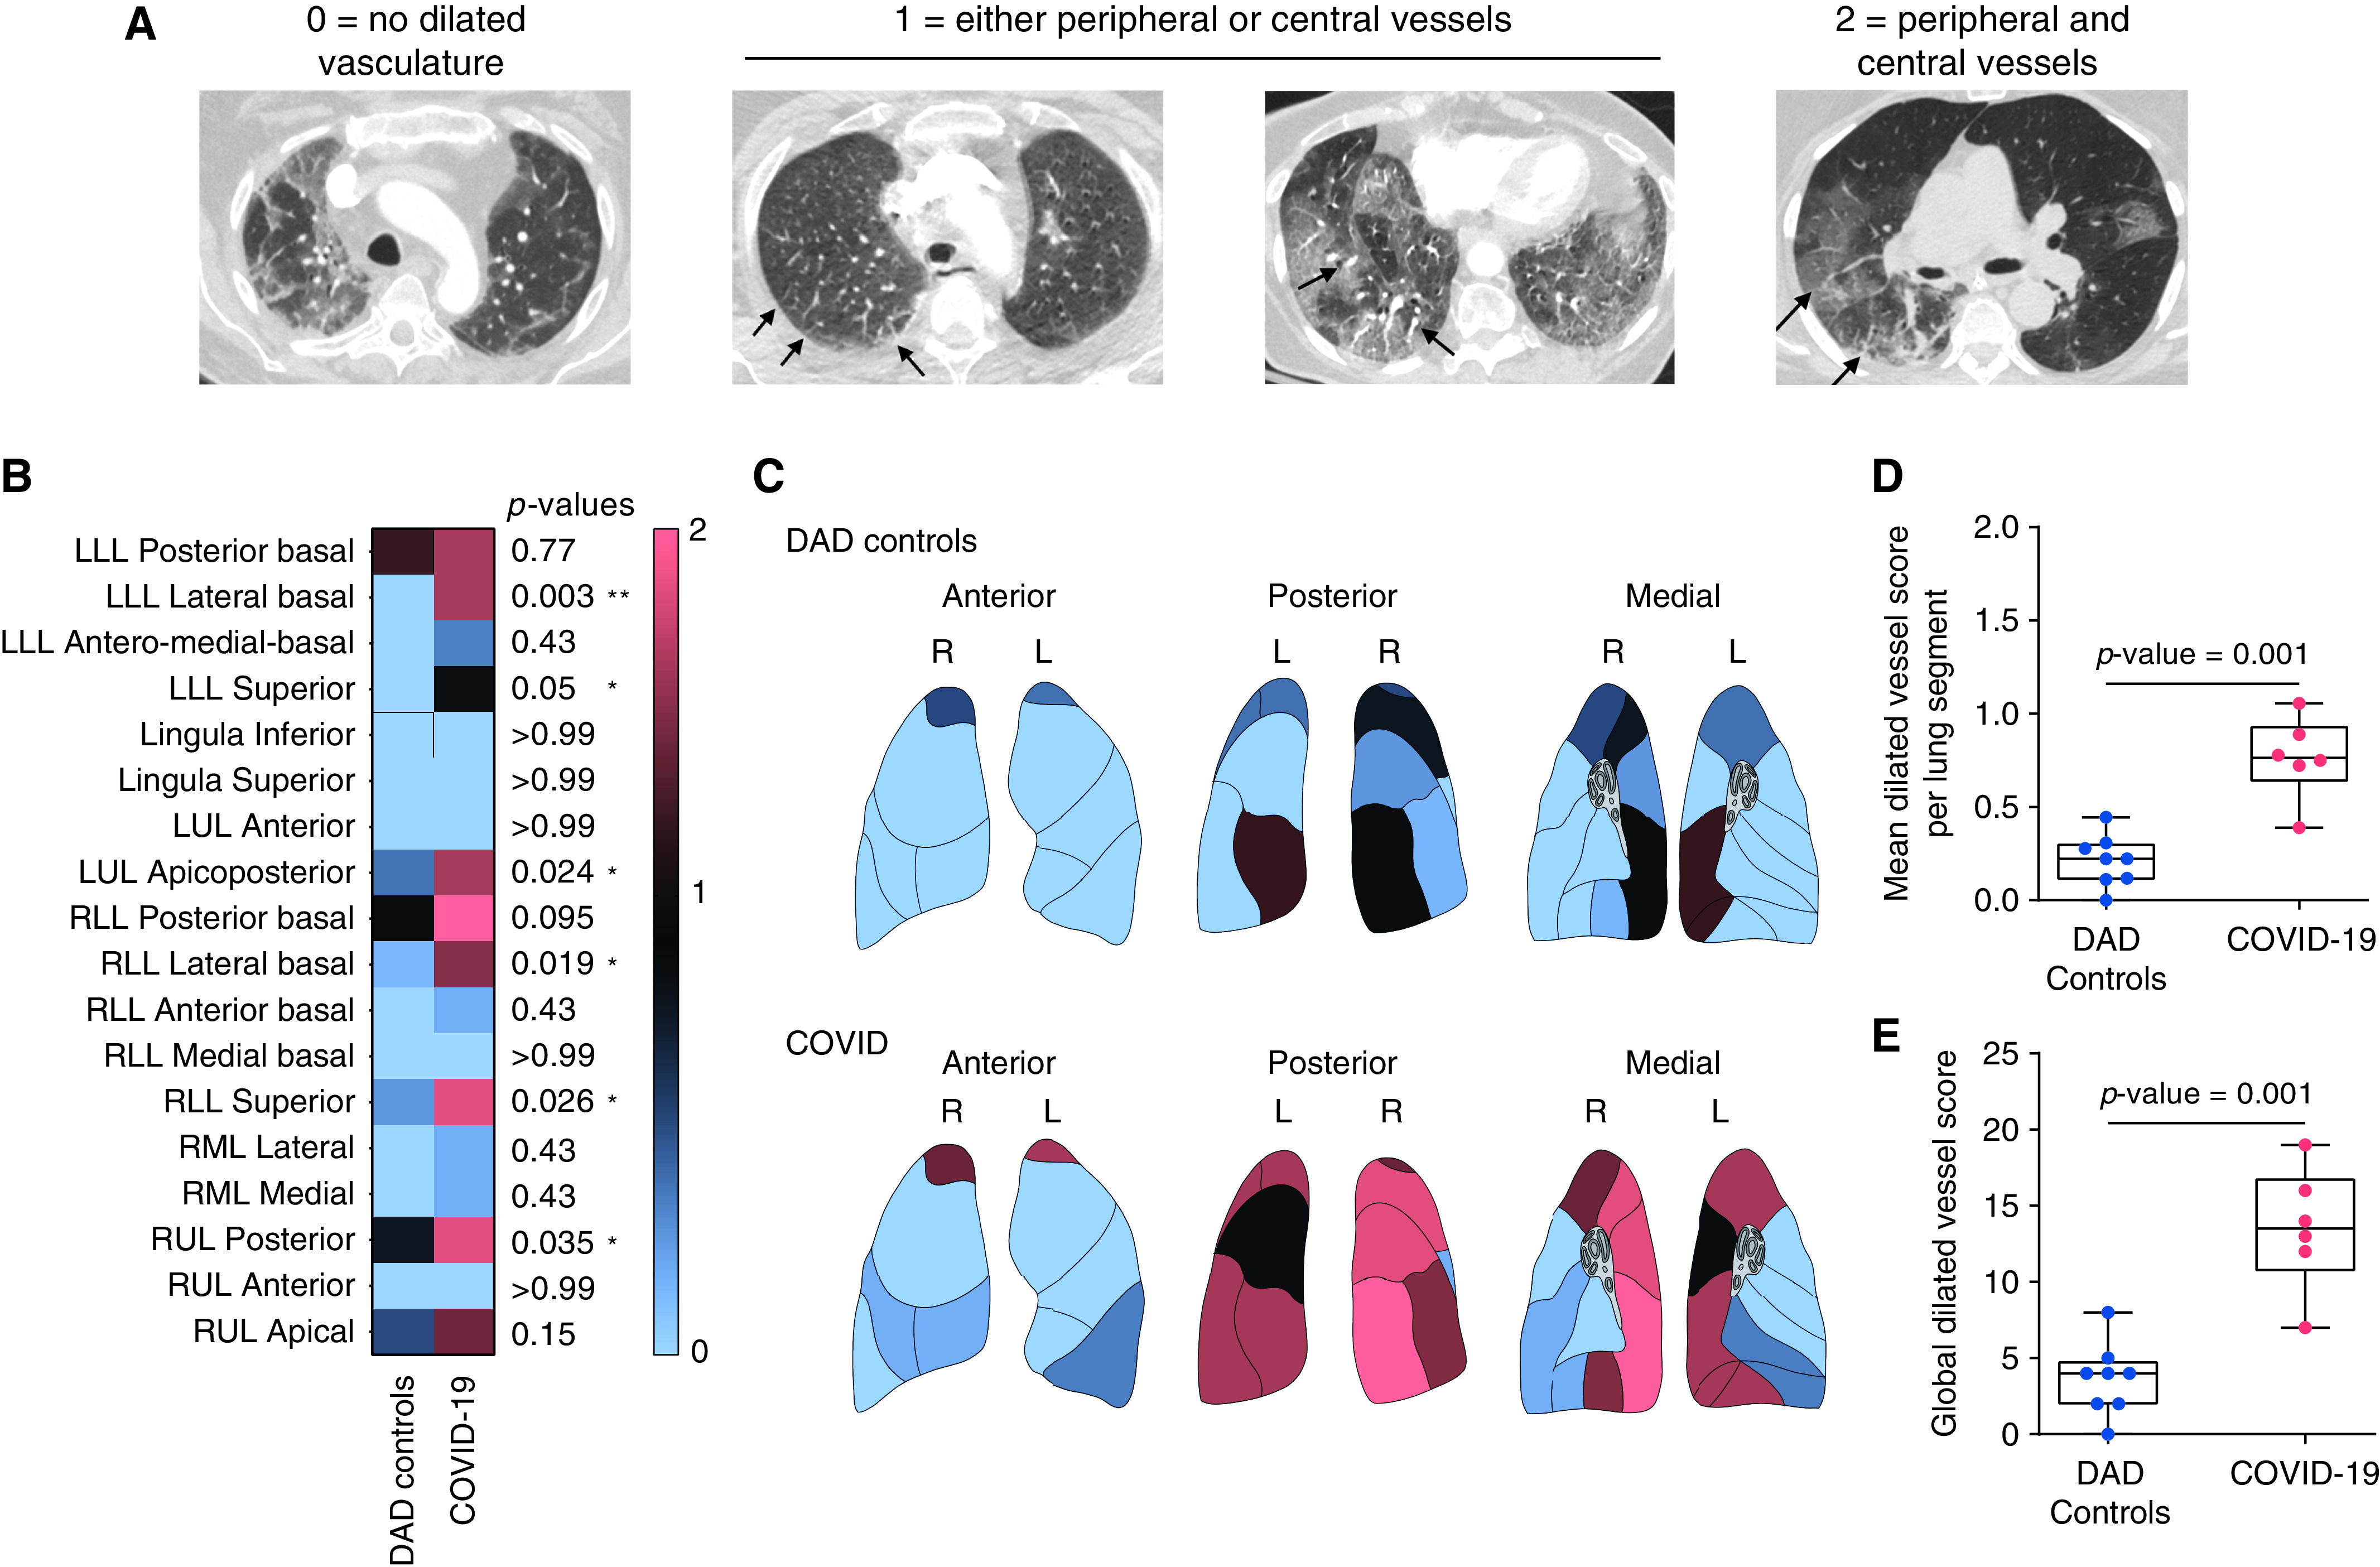
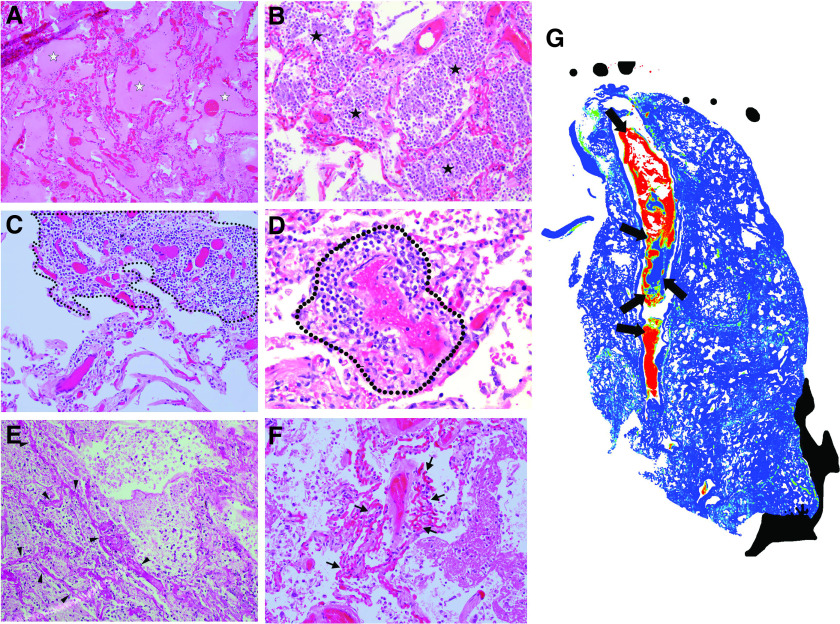
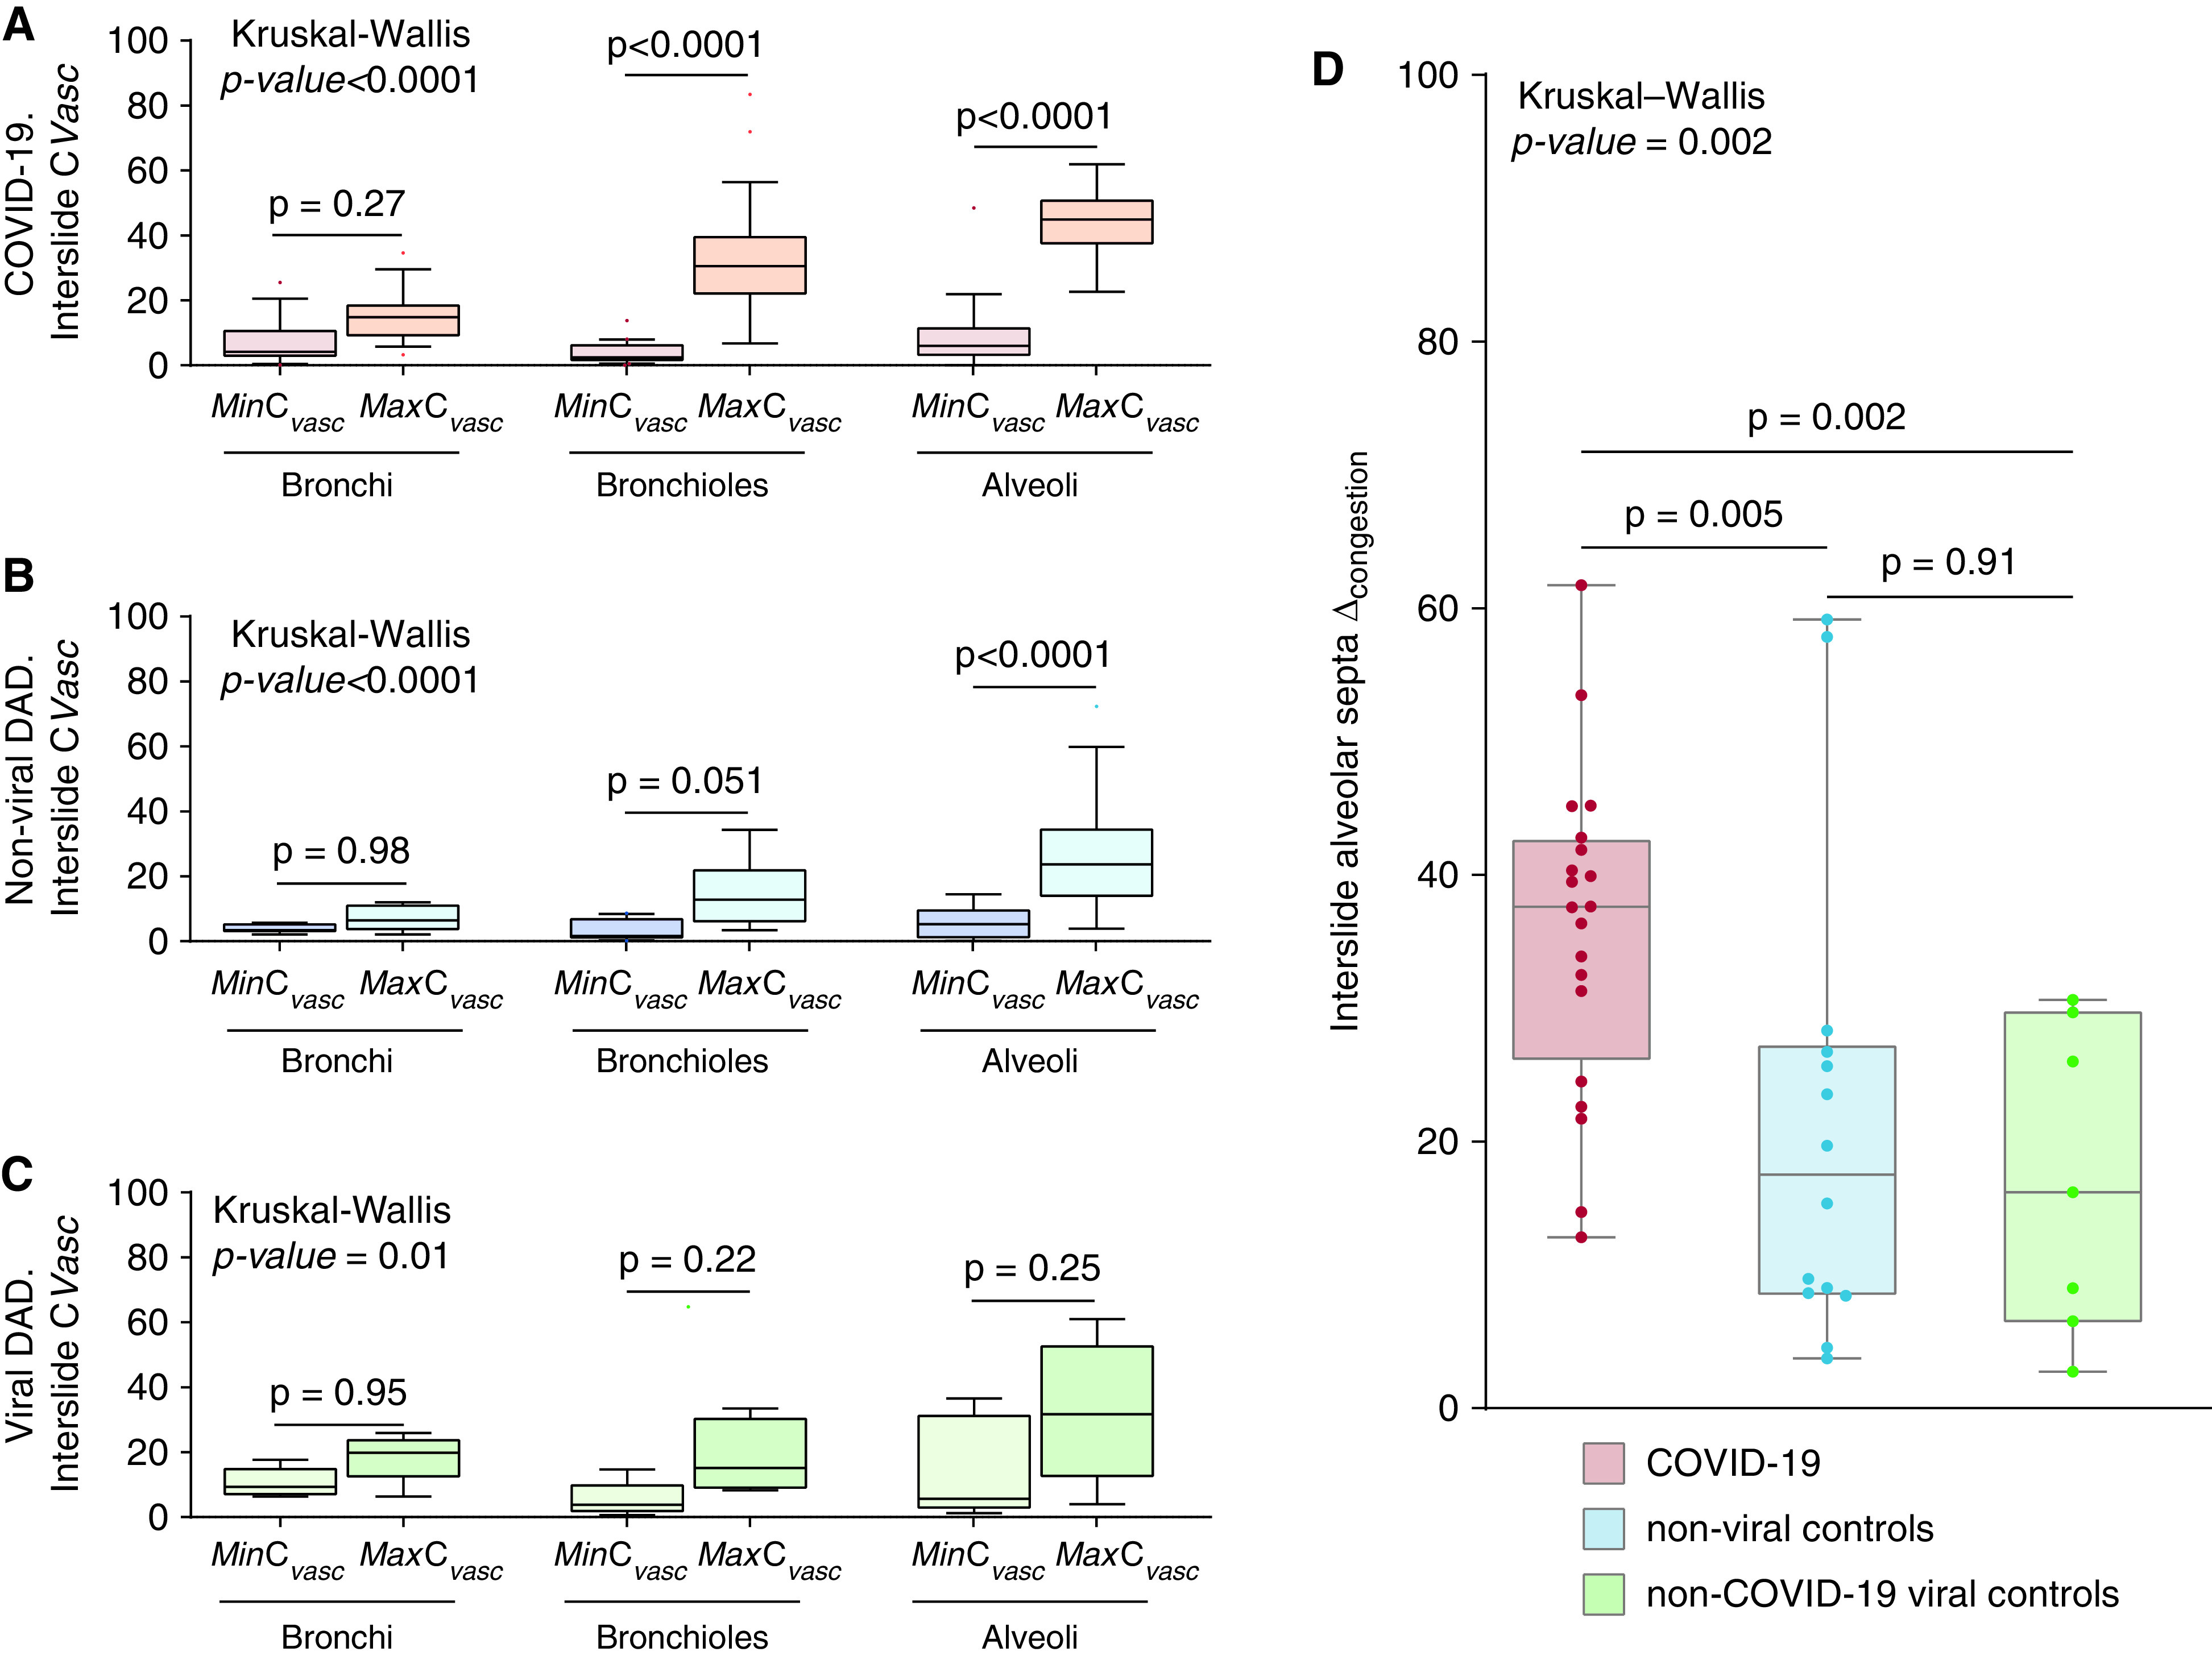
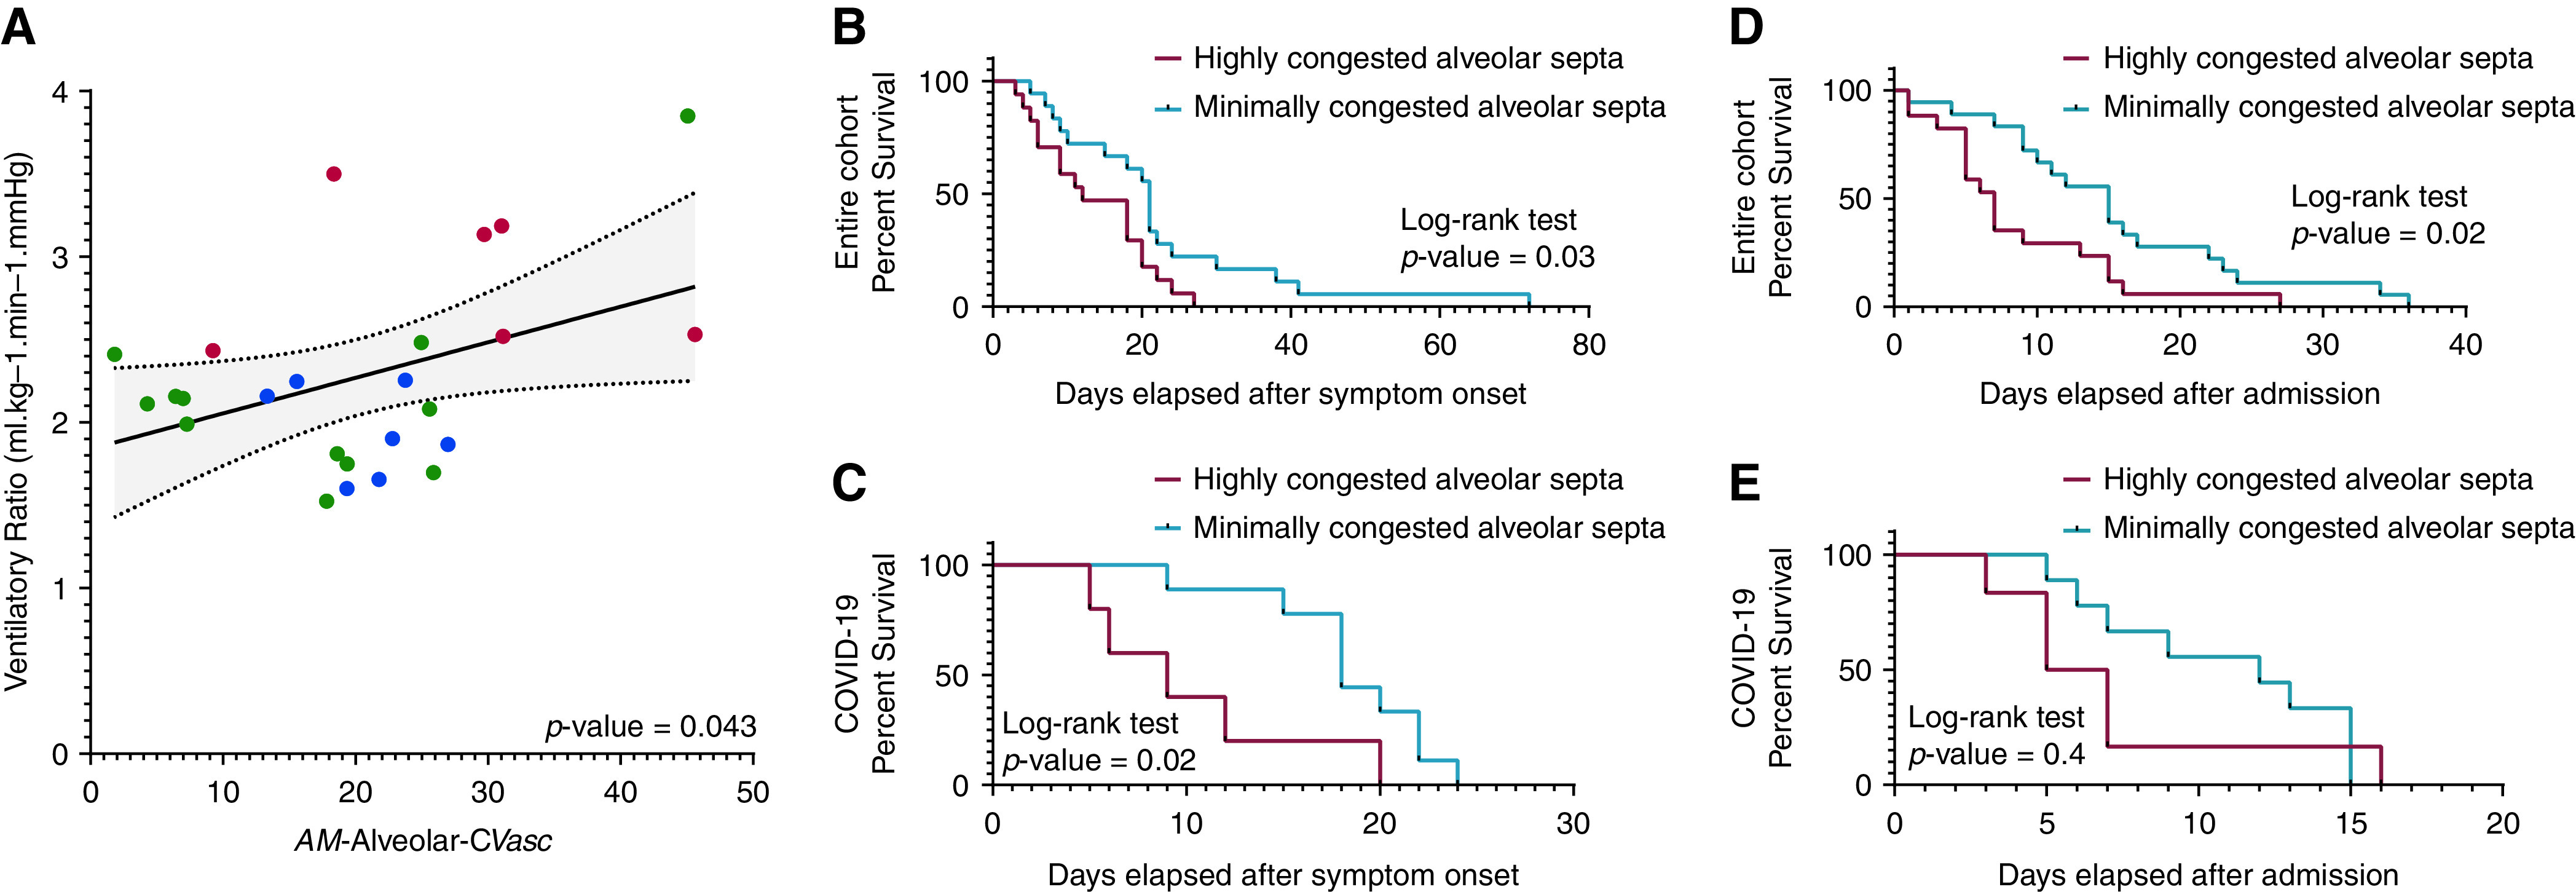
Rationale: The leading cause of death in coronavirus disease 2019 (COVID-19) is severe pneumonia, with many patients developing acute respiratory distress syndrome (ARDS) and diffuse alveolar damage (DAD). Whether DAD in fatal COVID-19 is distinct from other causes of DAD remains unknown. Objective: To compare lung parenchymal and vascular alterations between patients with fatal COVID-19 pneumonia and other DAD-causing etiologies using a multidimensional approach. Methods: This autopsy cohort consisted of consecutive patients with COVID-19 pneumonia (n = 20) and with respiratory failure and histologic DAD (n = 21; non-COVID-19 viral and nonviral etiologies). Premortem chest computed tomography (CT) scans were evaluated for vascular changes. Postmortem lung tissues were compared using histopathological and computational analyses. Machine-learning-derived morphometric analysis of the microvasculature was performed, with a random forest classifier quantifying vascular congestion (CVasc) in different microscopic compartments. Respiratory mechanics and gas-exchange parameters were evaluated longitudinally in patients with ARDS. Measurements and Main Results: In premortem CT, patients with COVID-19 showed more dilated vasculature when all lung segments were evaluated (P = 0.001) compared with controls with DAD. Histopathology revealed vasculopathic changes, including hemangiomatosis-like changes (P = 0.043), thromboemboli (P = 0.0038), pulmonary infarcts (P = 0.047), and perivascular inflammation (P < 0.001). Generalized estimating equations revealed significant regional differences in the lung microarchitecture among all DAD-causing entities. COVID-19 showed a larger overall CVasc range (P = 0.002). Alveolar-septal congestion was associated with a significantly shorter time to death from symptom onset (P = 0.03), length of hospital stay (P = 0.02), and increased ventilatory ratio [an estimate for pulmonary dead space fraction (Vd); p = 0.043] in all cases of ARDS. Conclusions: Severe COVID-19 pneumonia is characterized by significant vasculopathy and aberrant alveolar-septal congestion. Our findings also highlight the role that vascular alterations may play in Vd and clinical outcomes in ARDS in general.

Keywords: ARDS; COVID-19; vascular congestion; vasculopathy; ventilatory ratio.


Figures

Figure 1.
Figure 1.
Flow chart showing multidimensional discovery approach using histopathological, computational, and radiological analyses. This research process of uncovering the pathological basis of coronavirus disease (COVID-19)–related lung disease involves a combination of deep clinicopathological phenotyping (comprehensive characterization of clinical cases through radiological and histopathological methods), and morphometric analyses using a random forest pixel classifier identifying the density of red blood cells in the lung microarchitecture. Longitudinal data on respiratory mechanics and gas-exchange parameters in patients meeting the Berlin Definition for acute respiratory disease syndrome (ARDS) (7) were collected and used for clinicopathological correlation. Semiquantitative radiological phenotyping was performed with conventional premortem chest computed tomography (CT) examinations by a thoracic radiologist. Semiquantitative traditional histopathologic phenotyping was performed by two pulmonary pathologists on hematoxylin and eosin (H&E)–stained slides derived from formalin-fixed paraffin-embedded (FFPE) tissue blocks obtained from postmortem lung tissue. The morphometric analysis involved manual annotation of regions of interest within the lung airway tree microarchitecture (and excluded regions) by pathologists. A machine-learning–derived pixel classification labeled each pixel in high-resolution whole slide images as stroma, red blood cell (RBC), or air. The final classification data were then summed over regions of interest to produce detailed quantitative measurements. Further details are provided in the Methods and in the online supplement (Supplemental Methods).
Figure 2.
Figure 2.
Quantification of vascular congestion in the lung microarchitecture by a machine-learning–derived pixel classification. (A) A side-by-side illustration of the performance of the final classifier, and a corresponding H&E image is depicted. RBCs are indicated in red; stroma, in blue; and air, in white. Morphometric data of the vascular congestion (CVasc) in manually selected regions of interest in highly and minimally congested regions of the lung parenchyma were compared in whole slide images of H&E-stained slides of patients with COVID-19, and diffuse alveolar damage (DAD) of nonviral and viral etiologies. (B) Representative microphotographs of WSIs of H&E-stained slides in minimally and markedly congested regions of contiguous alveoli are presented with their corresponding heatmaps of congestion. Heatmaps were generated by computing the fraction of tissue (stroma or red blood cell) that is blood within circular apertures centered on each grid of points spanning the image.
Figure 3.
Figure 3.
Semiquantitative premortem radiological phenotyping in COVID-19 by chest CT examinations. (A) Each segment of the five lung lobes was evaluated for dilated segmental or subsegmental vessels and scored on the basis of the distribution of the vessels as follows: 0 = no dilated vessels, 1 = either dilated peripheral or central vessels, 2 = dilated central and peripheral vessels. Axial CT images of the chest obtained at lung-window settings show dilated subsegmental pulmonary vessels (arrows), which are engorged and tortuous. The dilated vessels are located within the periphery of the lung (peripheral 1/3 of the lung; second image from the left), within the center of the lung (central 2/3 of the lung; third image from the left), or in both the periphery and the center (fourth image from the left). Significant differences between patients with COVID-19 and controls with non–COVID-19 DAD were seen in six different lung segments: lower lobe (LLL) lateral basal (P = 0.003), LLL superior (P = 0.05), left upper lobe (LUL) apicoposterior (P = 0.024), right lower lobe (RLL) lateral basal (P = 0.019), RLL superior (P = 0.026), and right upper lobe (RUL) posterior (P = 0.035). (B and C) Vessel distribution score is presented in (B) the heat map and (C) lung diagrams for both groups In (B), the first column represents controls with non–COVID-19 DAD, and the second column represents patients with COVID-19. Each row represents an individual lung segment. The scale bar (thin rectangle, right side) indicates the score values in the heatmap and lung diagrams. Blue denotes the minimum score (0), and salmon denotes the maximum score (2). (D) Mean overall segmental distributions of dilated pulmonary vasculature per patient were significantly different among both groups (blue, non–COVID-19 DAD-controls; salmon, COVID-19; P = 0.001). We calculated the global dilated vessel score by adding all the individual segmental vessel scores in each patient. (E) The global dilated vessel score, which incorporates information on all the lung segments, was significantly higher in patients with COVID-19 when compared with controls with non-COVID-19 DAD (blue, non-COVID-19 DAD; salmon, COVID-19; P = 0.001). The boxes reflect the interquartile range, and the whiskers indicate the range down to the minimum and up to the maximum value. Each individual value as a point is superimposed on the graph. Individual groups were compared using the Mann-Whitney U test.
Figure 4.
Figure 4.
(AG) Histopathological phenotyping in COVID-19. H&E-stained slides from lung tissue of patients with COVID-19 showed multiple distinctive histologic features and vascular abnormalities that were more frequently found in the lung microarchitecture of patients with COVID-19 than in controls with non–COVID-19 DAD, including (A) alveolar edema (P < 0.001; white stars), (C) interstitial inflammation (P = 0.019; dashed thin line), (D) perivascular inflammation (P < 0.001; dashed thick line), (E) pulmonary infarcts (P = 0.047; arrowheads denote necrotic alveolar septa), (F) capillary congestion with and without capillary hemangiomatosis-like changes (P = 0.043; thin arrows), and (G) pulmonary thromboemboli (P = 0.0038). (B) Additionally, patients with COVID-19 were more likely to show evidence of superimposed bronchopneumonia than controls with non–viral DAD (B) (P=0.012; black stars), but not more than controls with viral DAD (P = 0.20). (G) A full-slide heatmap generated from a whole-slide image from a patient with COVID-19 depicts a thromboembolus interdigitating in a large pulmonary artery and highlights different layers of RBCs, platelets, and fibrin (thick black arrows denote different pixel densities within the arterial thromboembolus, which indicates organization) that are laid down in the vessel and form the characteristic “lines of Zahn.” Full-slide blood concentration heatmap was generated by computing the fraction of tissue (stroma or red blood cell; 35% tissue threshold) that is blood within 80-μm circular apertures centered on each grid of points spanning the image.
Figure 5.
Figure 5.
Morphometric determination of vascular congestion in regions of interest of the lung microarchitecture. Manually annotated regions of interest on different microanatomic compartments of the airway tree were chosen for morphometric analyses. Regions of interest on the airway tree included cartilaginous airways, noncartilaginous airways, and alveolar septa. Multiple annotations corresponding to these three different regions of interest were performed in different H&E-stained lung slides of autopsies from patients with COVID-19 and DAD of nonviral and viral etiologies. (AC) In each patient, and in each different region of interest, values for the annotation showing the maximum CVasc (interslide-MaxCVasc) and the annotation showing the minimum CVasc (interslide-MinCVasc) were selected and compared in patients with (A) COVID-19, (B) non–viral DAD, and (C) viral DAD etiologies. Each Tukey box contains the value of one single annotation per patient. The interslide-MinCVasc annotations (red = MinCVasc COVID-19; dark blue = MinCVasc non–viral DAD; light green = MinCVasc viral DAD) and the interslide-MaxCVasc annotations (orange = MaxCVasc COVID-19; light blue = MaxCVasc non–viral DAD; dark green = MaxCVasc viral DAD) are grouped by compartment in different Tukey boxes, as indicated in the x axis. Tukey’s boxes reflect the interquartile range, and the whiskers indicate the range (up to 1.5 times the interquartile range). Singular points denote outliers. (D) The vascular congestion range (interslide-alveolar Δcongestion), defined as the difference between the individual annotation with the highest CVasc (interslide-MaxCVasc) and the the individual annotation with the lowest CVasc (interslide-MinCVasc) within the alveolar septa compartment, was calculated using all interslide annotations of contiguous alveoli per autopsy from patients with COVID-19 (red) and DAD of nonviral (light blue) and viral (dark green) etiologies. In (D), all boxes reflect the interquartile range, and the whiskers indicate the range down to the minimum and up to the maximum value. Each individual value as a point is superimposed on the graph. The Kruskal-Wallis test, with Dunn’s post hoc test, was used to compare more than two independent groups of equal or different sample sizes. Individual groups were compared using Mann-Whitney U test.
Figure 6.
Figure 6.
Vascular congestion, ventilatory ratio (VR), time to death from symptom onset, and hospital stay. The arithmetic mean CVasc in alveolar septa (AM-alveolar CVasc) tended to mirror the mean VR in each cluster. (A) The individual relationship between measured AM-alveolar CVasc and VR in all 25 subjects with ARDS was statistically significant and fitted a linear regression (P = 0.043; R2 = 0.17). The slope ΔCVasc/ΔVR was computed as ratio of overall change in CVasc to overall change in VR (estimate ± SE) was 7.76  ± 3.6%/[minute ventilation(milliliters/minutes) × PaCO2 (mm Hg)]. Singular points are indicated, in color, by the corresponding clusters with differences in AM-alveolar CVasc to which the patients belong (red = cluster 1; green = cluster 2; blue = cluster 3; for details, see Supplemental Results; Figure E13). We stratified patients with COVID-19 and all patients of the study into two groups on the basis of the median AM-alveolar CVasc of the COVID-19 cohort (median = 25.3%) or the entire cohort (median = 21.5%), respectively: patients with an AM-alveolar CVasc less than the median AM-alveolar CVasc of the cohort (“minimally congested alveolar septa”) or patients with a mean AM-alveolar CVasc equal to or greater than the median AM-alveolar CVasc of the cohort (“highly congested alveolar septa”). Differences in time to death from symptom onset and length of hospital stay in patients with COVID-19 or all patients of the study classified as having minimally or highly congested alveolar septa were estimated using the Kaplan-Meier method. The resulting Kaplan-Meier curves were compared using a log-rank test. (BE) Statistically significant differences in time to death from symptom onset were found when comparing patients with minimally versus highly congested alveolar septa (B) in the entire cohort (P = 0.03) and (D) in the COVID-19 cohort (P = 0.02). Differences in length of hospital stay were statistically significant (C) in all patients of the study with minimally versus highly congested alveolar septa (P = 0.02) but not (E) in patients with COVID-19 (P = 0.4).

Comment in

Similar articles

Cited by

References

    1. Wiersinga WJ, Rhodes A, Cheng AC, Peacock SJ, Prescott HC. Pathophysiology, transmission, diagnosis, and treatment of coronavirus disease 2019 (COVID-19): a review. JAMA . 2020;324:782–793. - PubMed
    1. Berlin DA, Gulick RM, Martinez FJ. Severe Covid-19. N Engl J Med . 2020;383:2451–2460. - PubMed
    1. Hariri LP, North CM, Shih AR, Israel RA, Maley JH, Villalba JA, et al. Lung histopathology in coronavirus disease 2019 as compared with severe acute respiratory sydrome and H1N1 influenza: a systematic review. Chest . 2021;159:73–84. - PMC - PubMed
    1. Satturwar S, Fowkes M, Farver C, Wilson AM, Eccher A, Girolami I, et al. Postmortem findings associated with SARS-CoV-2: systematic review and meta-analysis. Am J Surg Pathol . 2021;45:587–603. - PMC - PubMed
    1. Konopka KE, Nguyen T, Jentzen JM, Rayes O, Schmidt CJ, Wilson AM, et al. Diffuse alveolar damage (DAD) resulting from coronavirus disease 2019 infection is morphologically indistinguishable from other causes of DAD. Histopathology . 2020;77:570–578. - PMC - PubMed

Publication types