

Synchronized spread of COVID-19 in the cities of Bahia, Brazil
- PMID: 35671560
- PMCID: PMC9158455
- DOI: 10.1016/j.epidem.2022.100587
Synchronized spread of COVID-19 in the cities of Bahia, Brazil
Abstract
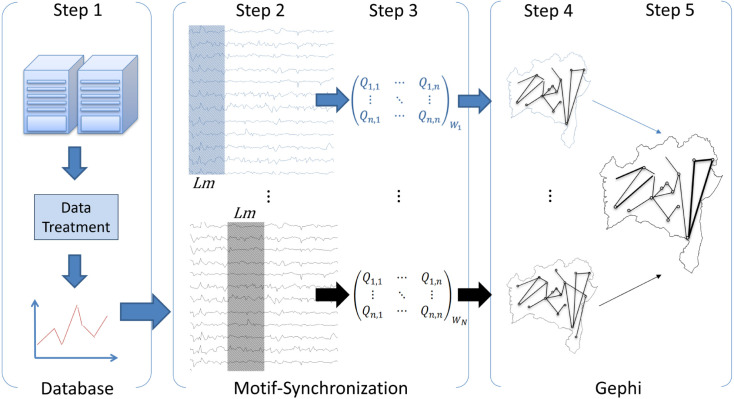
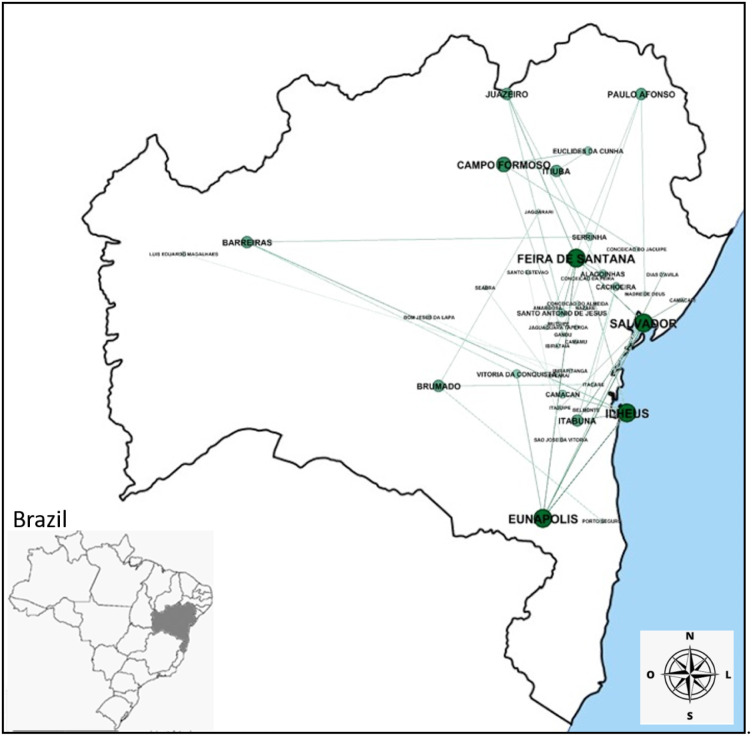
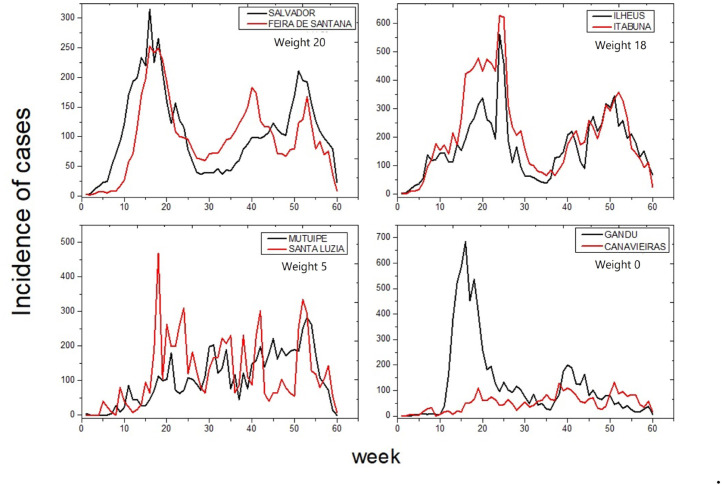
The COVID-19 pandemic, caused by the highly transmissible SARS-CoV-2 virus, has overloaded health systems in many contexts Conant and Wolfe (2008). Brazil has experienced more than 345,000 deaths, as of April/2021 Conant and Wolfe (2008), with dire consequences for the country's public and private health systems. This paper aims to estimate the synchronization graph between the cities' contagion waves from public COVID-19 data records. For this purpose, the Motif-Synchronization method Magwire et al. (2011) was applied to publicly available COVID-19 data records to determine the sequential relationship of occurrence of the waves among Bahia's cities. We find synchronization between waves of infection between cities, suggesting diffusion of the disease in Bahia and a potential role for inter-city transportation Saba et al. (2018), Saba et al. (2014), Araújo et al. (2018) in the dynamics of this phenomenon McKee and Stuckler (2020), Chinazzi et al. (2020), Tizzoni et al. (2014). Our main contribution lies in the use of the Motif-Synchronization method applied to COVID-19 data records, with the results revealing a pattern of disease spread that extends beyond city boundaries.
Keywords: COVID-19; Motif–Synchronization; Spread.
Copyright © 2022 The Author(s). Published by Elsevier B.V. All rights reserved.
Conflict of interest statement
The authors declare that they have no known competing financial interests or personal relationships that could have appeared to influence the work reported in this paper.
Figures
References
-
- Araújo M.L.V., Miranda J.G.V., Sampaio R., Moret M.A., Rosário R.S., Saba H. Nonlocal dispersal of dengue in the state of Bahia. Sci. Total Environ. 2018;631:40–46. - PubMed
-
- Araujo M.L., Miranda J.G., Vasconcelos R.N., Cambui E.C., Rosário R.S., Macedo M.C., Bandeira A.C., Souza M.S., Silva A.C., Filho A.S.N., et al. A critical analysis of the COVID-19 hospitalization network in countries with limited resources. Int. J. Environ. Res. Public Health. 2022;19(7):3872. - PMC - PubMed
-
- Azevedo S., Saba H., Miranda J., Filho A.N., Moret M. Self-affinity in the dengue fever time series. Internat. J. Modern Phys. C. 2016;27(12)
-
- Cardoso H.S.P., Miranda J.G.V., Jorge E.M.d.F., Moret M.A. 2013. Correlation between transport and occurrence of dengue cases in Bahia.
-
- Casteigts A., Flocchini P., Quattrociocchi W., Santoro N. Time-varying graphs and dynamic networks. Int. J. Parallel Emergent Distrib. Syst. 2012;27(5):387–408.
Publication types
MeSH terms
LinkOut - more resources
Full Text Sources
Medical
Miscellaneous
