

Impact of growth curve and dietary energy-to-protein ratio of broiler breeders on egg quality and egg composition
- PMID: 35671619
- PMCID: PMC9168161
- DOI: 10.1016/j.psj.2022.101946
Impact of growth curve and dietary energy-to-protein ratio of broiler breeders on egg quality and egg composition
Abstract
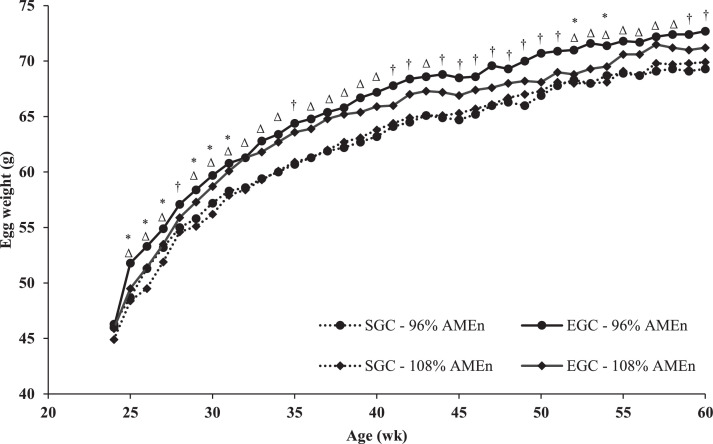
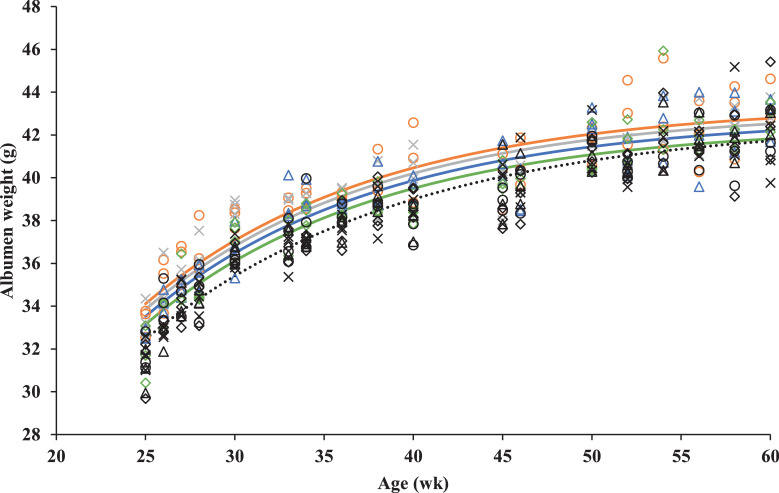
Egg characteristics have an impact on embryonic development and post-hatch performance of broilers. The impact of growth curve (GC) and dietary energy-to-protein ratio of broiler breeder hens on egg characteristics was investigated. At hatch, 1,536 pullets were randomly allotted to 24 pens in a 2 × 4 factorial dose-response design with 2 GC (standard growth curve = SGC or elevated growth curve = EGC (+ 15%)) and 4 diets, differing in energy-to-protein ratio (defined as 96%, 100%, 104% and 108% AMEn diet). Feed allocation per treatment was adapted weekly to achieve the targeted GC and to achieve pair-gain of breeders within each GC. Breeders on an EGC produced larger eggs (∆ = 2.3 g; P < 0.001) compared to breeders on a SGC. An exponential regression curve, with age (wk) of the breeders, was fitted to describe the impact of GC and dietary energy-to-protein ratio on egg composition. Yolk weight was 0.8 g higher for eggs from EGC breeders than from SGC breeders (a-108.1*0.907Age, where a was 22.1 and 22.9 for SGC and EGC, respectively; R2 = 0.97; P<0.001). An interaction between GC and dietary energy-to-protein ratio on albumen weight was observed (P = 0.04). Dietary energy-to-protein ratio did not affect albumen weight in SGC breeders (42.7-56.2*0.934Age; R2 = 0.89), but for EGC breeders, a higher dietary energy-to-protein ratio resulted in a 0.9 g lower albumen weight from 96% AMEn to 108% AMEn (a-62.9*0.926Age, where a was 43.4, 43.2, 42.8, and 42.5 for 96% AMEn, 100% AMEn, 104% AMEn, and 108% AMEn, respectively; R2 = 0.86). Albumen DM content decreased linearly with an increased dietary energy-to-protein ratio, but this was more profound in EGC breeders (β = -0.03 %/% AMEn) than in SGC breeders (β = -0.01 %/% AMEn; P = 0.03). Overall, it can be concluded that an EGC for breeders led to larger eggs with a more yolk and albumen, whereas dietary energy-to-protein ratio had minor effects on egg composition.
Keywords: broiler breeder; egg components; feed strategy; modelling.
Copyright © 2022 The Authors. Published by Elsevier Inc. All rights reserved.
Figures


Similar articles
-
Impact of growth curve and dietary energy-to-protein ratio on productive performance of broiler breeders.Poult Sci. 2021 Jul;100(7):101131. doi: 10.1016/j.psj.2021.101131. Epub 2021 Mar 15. Poult Sci. 2021. PMID: 34089938 Free PMC article.
-
Impact of growth curve and dietary energy-to-protein ratio of broiler breeders on offspring quality and performance.Poult Sci. 2022 Nov;101(11):102071. doi: 10.1016/j.psj.2022.102071. Epub 2022 Jul 26. Poult Sci. 2022. PMID: 36130449 Free PMC article.
-
Changes in body composition and energetic efficiency in response to growth curve and dietary energy-to-protein ratio in broiler breeders.Poult Sci. 2023 Feb;102(2):102410. doi: 10.1016/j.psj.2022.102410. Epub 2022 Dec 9. Poult Sci. 2023. PMID: 36565633 Free PMC article.
-
Effects of dietary protein levels during rearing and dietary energy levels during lay on body composition and reproduction in broiler breeder females.Poult Sci. 2015 May;94(5):1030-42. doi: 10.3382/ps/pev079. Epub 2015 Mar 25. Poult Sci. 2015. PMID: 25810412 Clinical Trial.
-
Research Note: Effects of riboflavin on reproductive performance and antioxidant status of duck breeders.Poult Sci. 2020 Mar;99(3):1564-1570. doi: 10.1016/j.psj.2019.11.014. Epub 2020 Jan 28. Poult Sci. 2020. PMID: 32111323 Free PMC article. Review.
Cited by
-
Impact of chronic heat stress in broiler breeders on egg quality, hatchability, and day old chick quality.Poult Sci. 2025 Sep;104(9):105452. doi: 10.1016/j.psj.2025.105452. Epub 2025 Jun 17. Poult Sci. 2025. PMID: 40582163 Free PMC article.
References
-
- Aviagen . Aviagen Inc; Huntsville, AL: 2016. Ross 308 European Parent Stock: Nutrition Specifications.
-
- Aviagen . Aviagen Inc; Huntsville, AL: 2016. Ross 308 European Parent Stock: Performance Objectives.
-
- Benton C.E., Brake J. The effect of broiler breeder flock age and length of egg storage on egg albumen during early incubation. Poult. Sci. 1996;75:1069–1075. - PubMed
-
- Bruggeman V., Onagbesan O., D'Hondt E., Buys N., Safi M., Vanmontfort D., Berghman L., Vandesande F., Decuypere E. Effects of timing and duration of feed restriction during rearing on reproductive characteristics in broiler breeder females general management of animals. Poult. Sci. 1999;78:1424–1434. - PubMed
-
- Buyse J., Decuypere E. In: Pages 443–453 in Sturkie’s Avian Physiology. 6th ed. Scanes C.G., editor. Elsevier; San Diego, USA: 2015. Adipose tissue and lipid metabolism.
MeSH terms
Substances
LinkOut - more resources
Full Text Sources
Medical
Miscellaneous
