

Long-Term Outcomes of Patients with IgA Nephropathy Categorized by the International IgAN Risk Prediction Tool and by the Degree of Hematuria at Diagnosis
- PMID: 35671707
- PMCID: PMC9808712
- DOI: 10.1159/000525001
Long-Term Outcomes of Patients with IgA Nephropathy Categorized by the International IgAN Risk Prediction Tool and by the Degree of Hematuria at Diagnosis
Abstract
Introduction: Within 30 years, 20-50% of IgA nephropathy (IgAN) patients progress to end-stage kidney disease (ESKD). Identifying these patients can be difficult since renal function may deteriorate after being stable for years. The International IgAN Risk Prediction tool (IgAN-RPT) combines histologic lesions and clinical risk factors to predict renal outcome up to 5 or 7 years of follow-up. The clinical value beyond 7 years is unknown and microhematuria data has not been assessed.
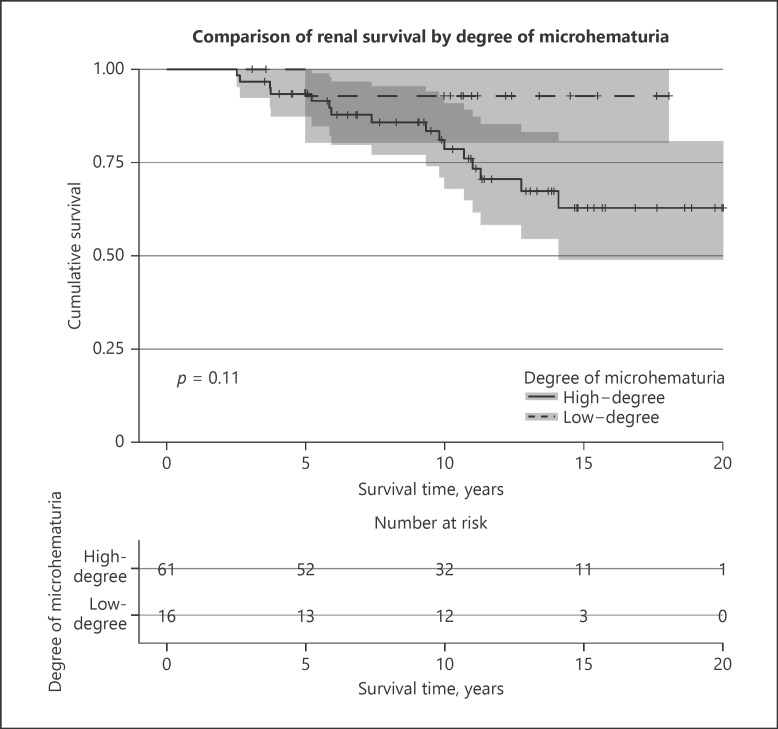
Methods: We studied the long-term renal outcome of 95 Swedish IgAN patients from the derivation cohort for the IgAN-RPT. The median follow-up was 11.2 years. Microhematuria at baseline was defined as high-degree by microscopy measurement of >10 red blood cell/high-power field of view or urine dipstick grading of 2-3. Primary outcome was defined as a 50% decrease in estimated glomerular filtration rate or ESKD.
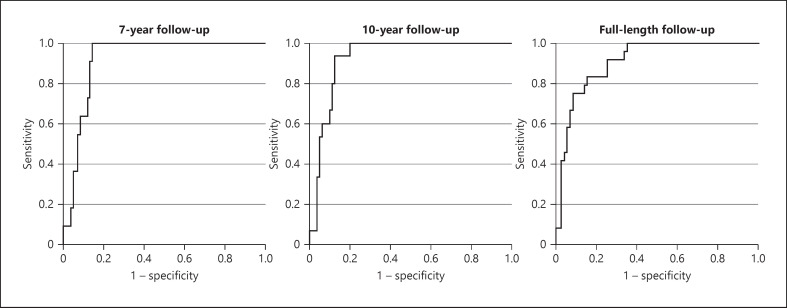
Results: The mean predicted 5-year risk for increasing quartiles was 0.95%, 2.57%, 5.88%, and 23.31% and the observed 5-year-outcome was 0%, 0%, 0%, and 33.33%. During continued follow-up, 0%, 4.2%, 21.7%, and 75.0% of patients reached the primary outcome. ROC curve analysis identified the 5-year risk thresholds of under 4% and over 11% for very low and very high-risk patients, respectively. High-degree microhematuria was not significantly associated with renal outcome (p = 0.14).
Conclusions: The IgAN-RPT identifies long-term high- and low-risk patients, which can guide decisions on the frequency of clinical control visits and the selection of patients for clinical trials. Patients with intermediate risk remain a clinical challenge with an urgent need for novel biomarkers and treatments. Microhematuria could be a valuable marker of inflammatory activity, but measurement needs to be standardized for implementation in risk prediction tools.
Keywords: Hematuria; IgA nephropathy; Prediction model; Prognosis; Progression.
© 2022 The Author(s). Published by S. Karger AG, Basel.
Conflict of interest statement
The authors have no conflicts of interest to declare.
Figures


References
-
- McGrogan A, Franssen CF, de Vries CS. The incidence of primary glomerulonephritis worldwide: a systematic review of the literature. Nephrol Dial Transplant. 2011;26((2)):414–30. - PubMed
-
- Donadio JV, Grande JP. IgA nephropathy. N Engl J Med. 2002;347((10)):738–48. - PubMed
-
- Simon P, Ramee MP, Boulahrouz R, Stanescu C, Charasse C, Ang KS, et al. Epidemiologic data of primary glomerular diseases in western France. Kidney Int. 2004;66((3)):905–8. - PubMed
Publication types
MeSH terms
LinkOut - more resources
Full Text Sources
Miscellaneous
