Meta-Analysis
. 2022 Jul 25;32(14):3005-3015.e6.
doi: 10.1016/j.cub.2022.05.039. Epub 2022 Jun 6.

The evolutionary trajectory of drosophilid walking

Affiliations
Meta-Analysis

The evolutionary trajectory of drosophilid walking

Ryan A York et al. Curr Biol. .

Abstract

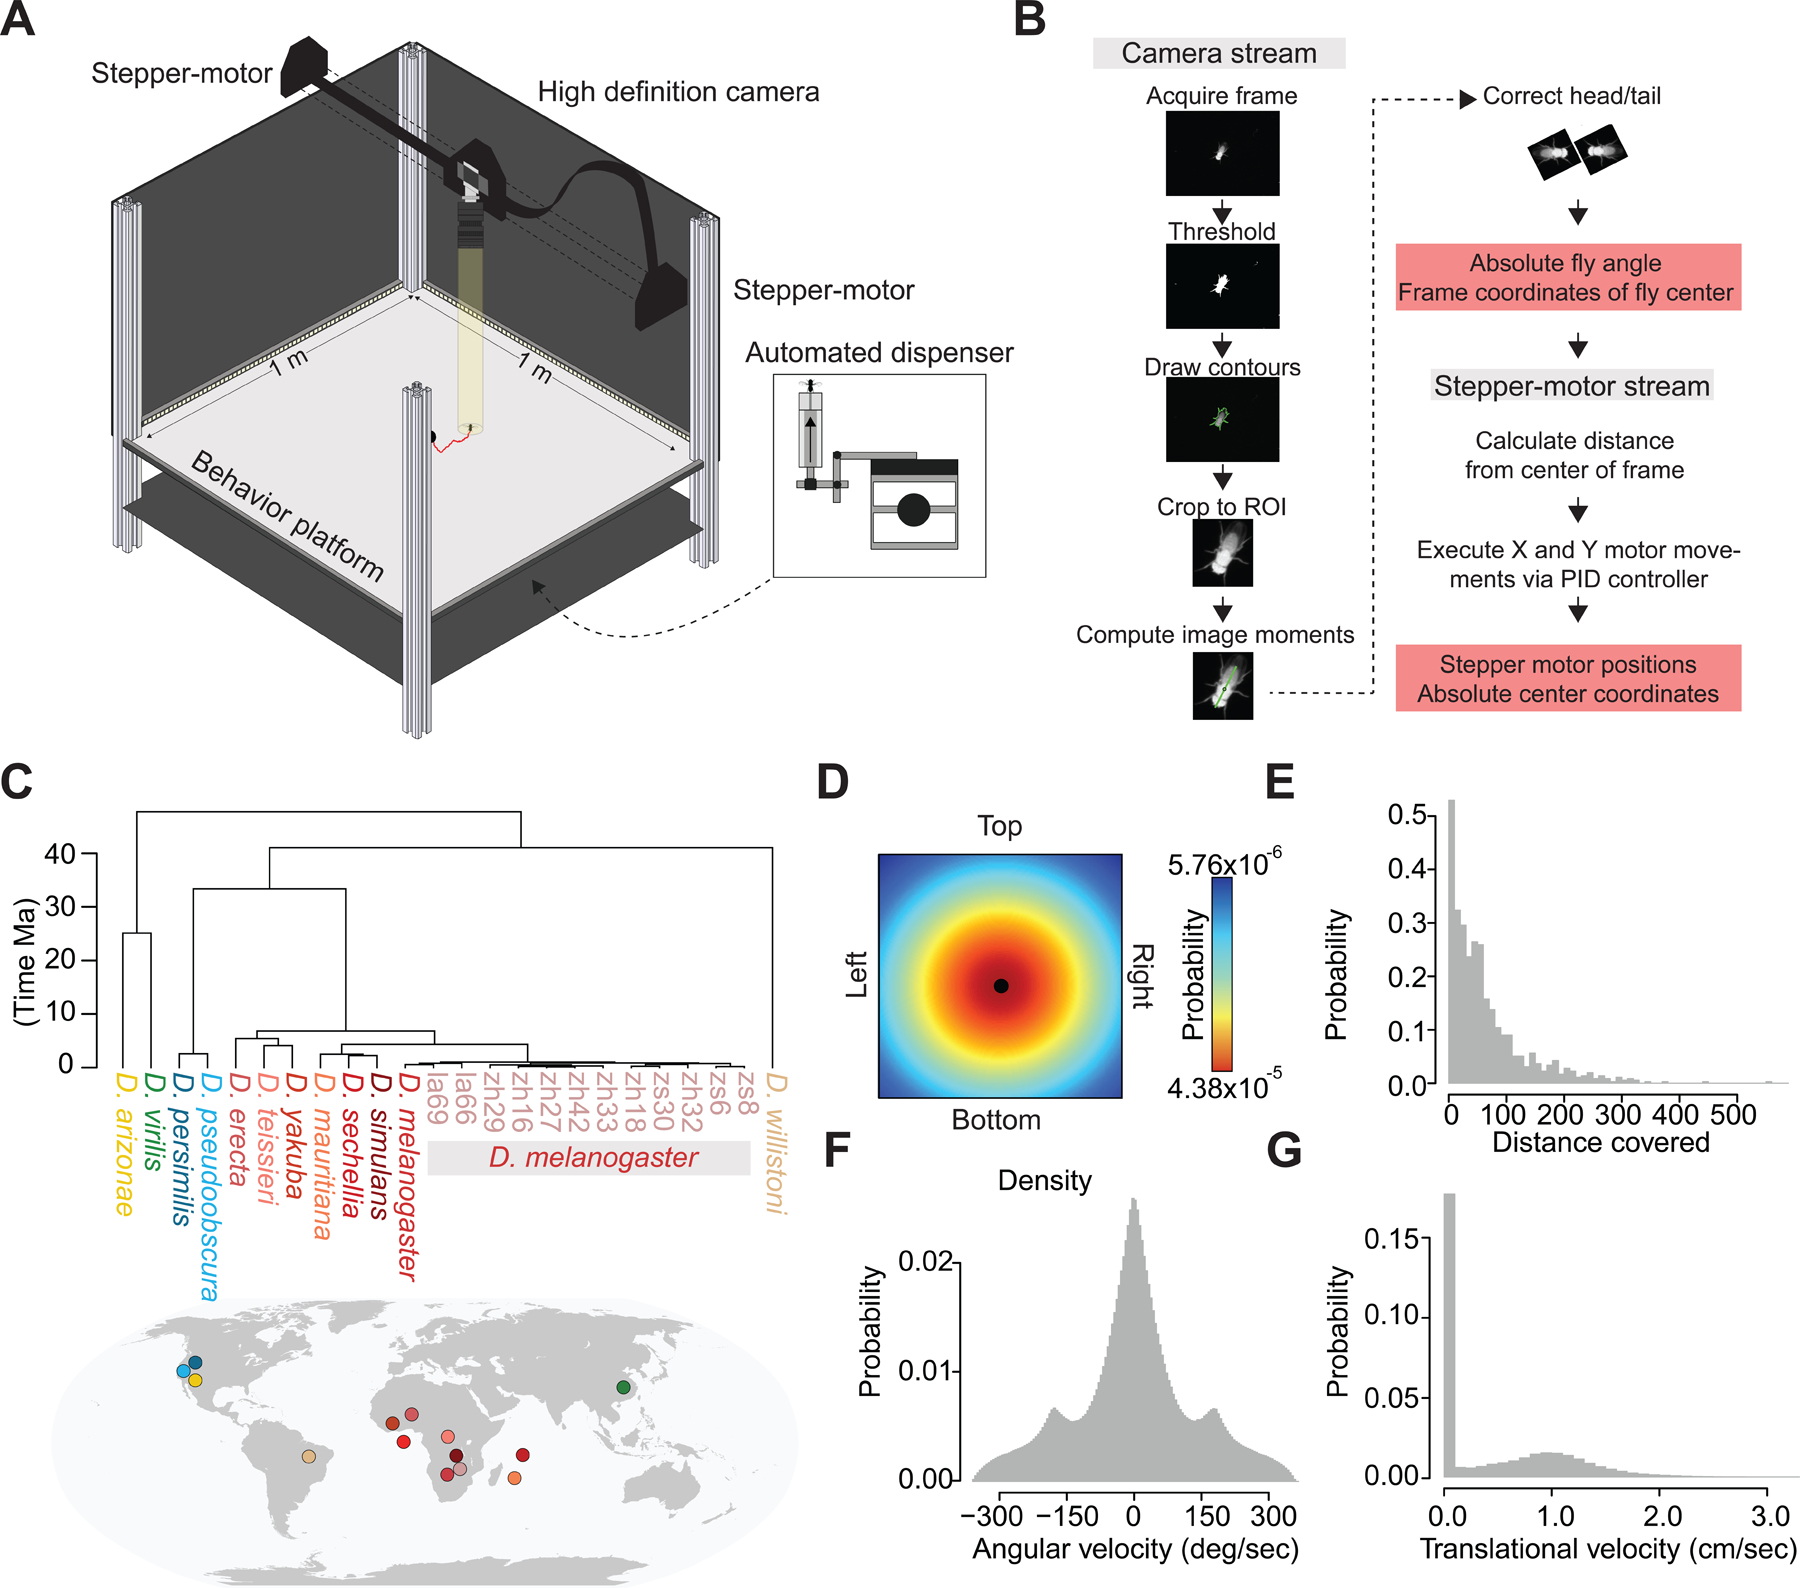
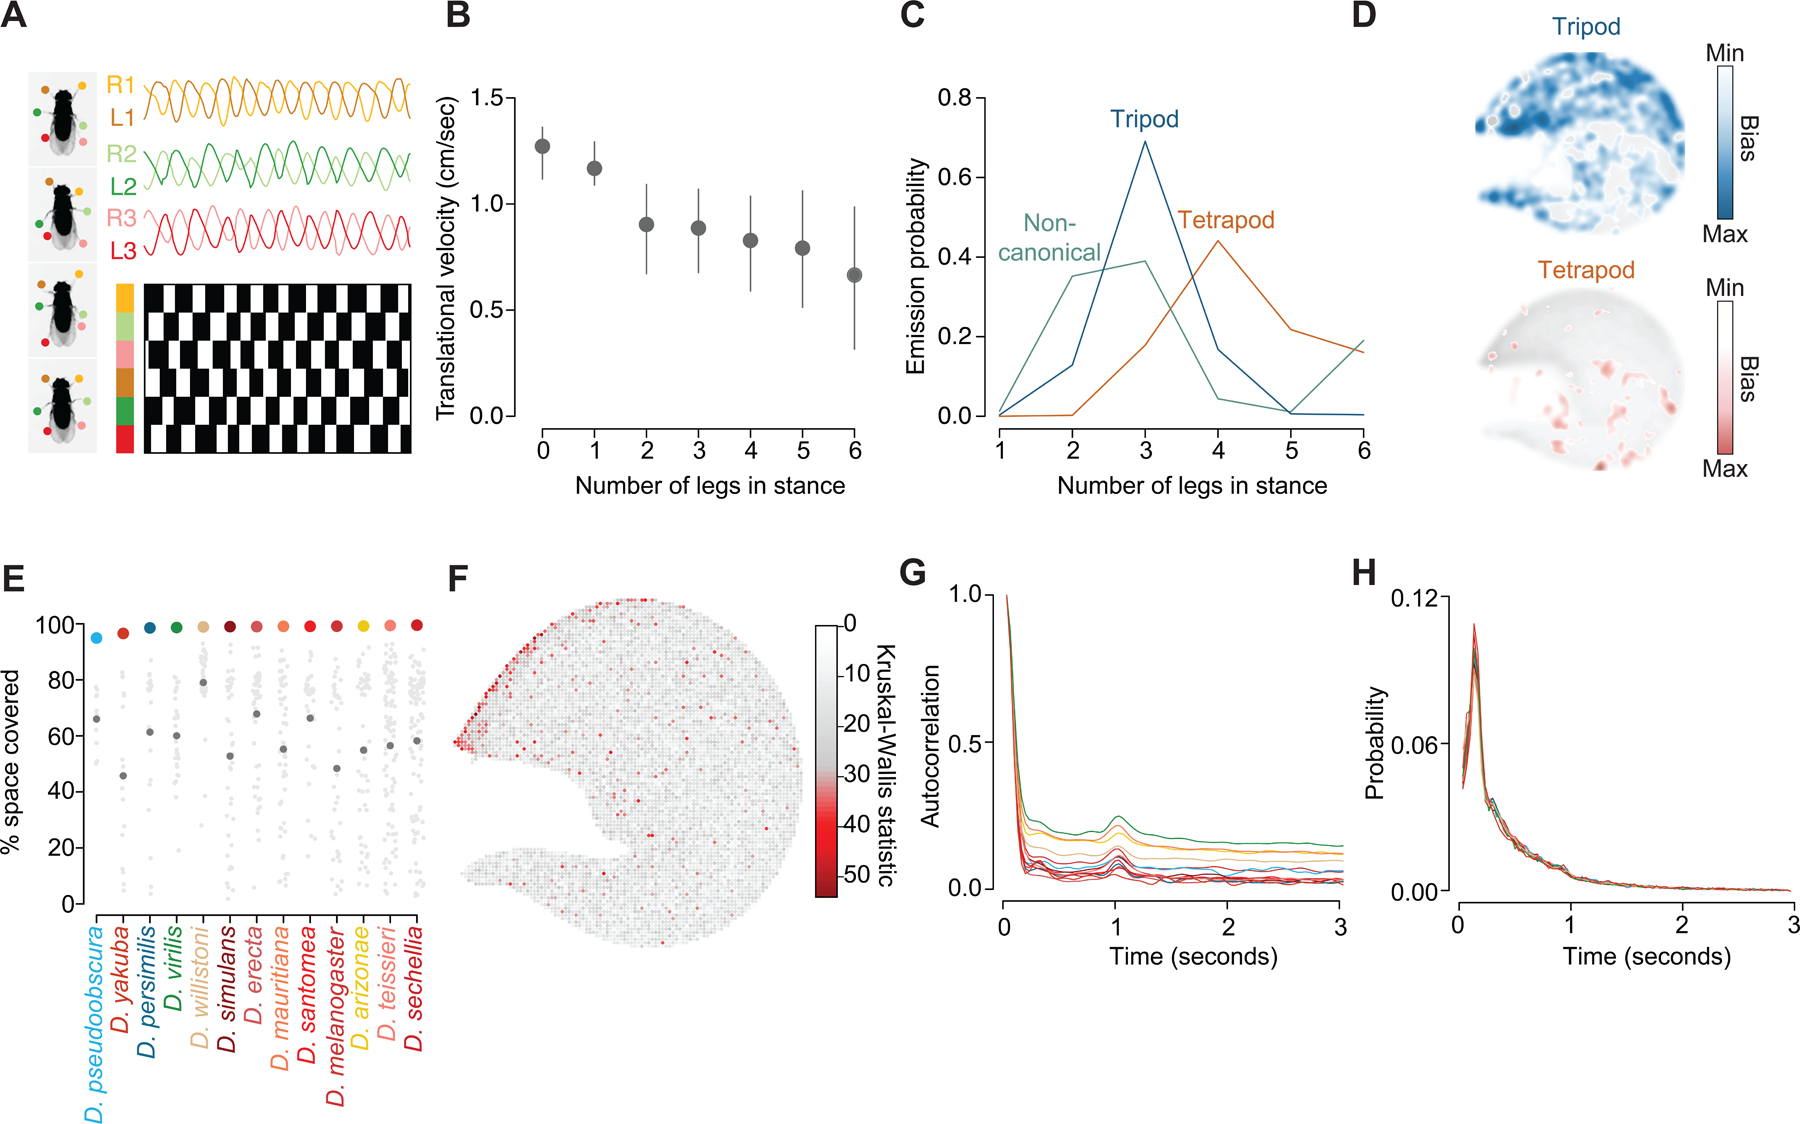
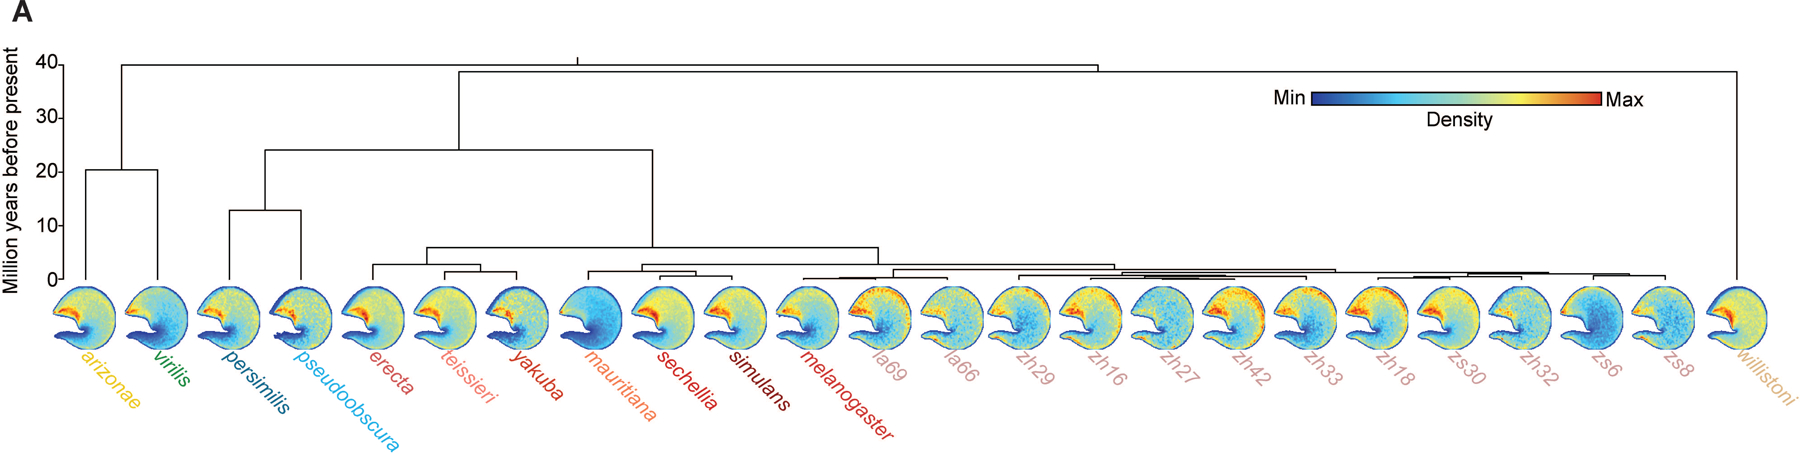
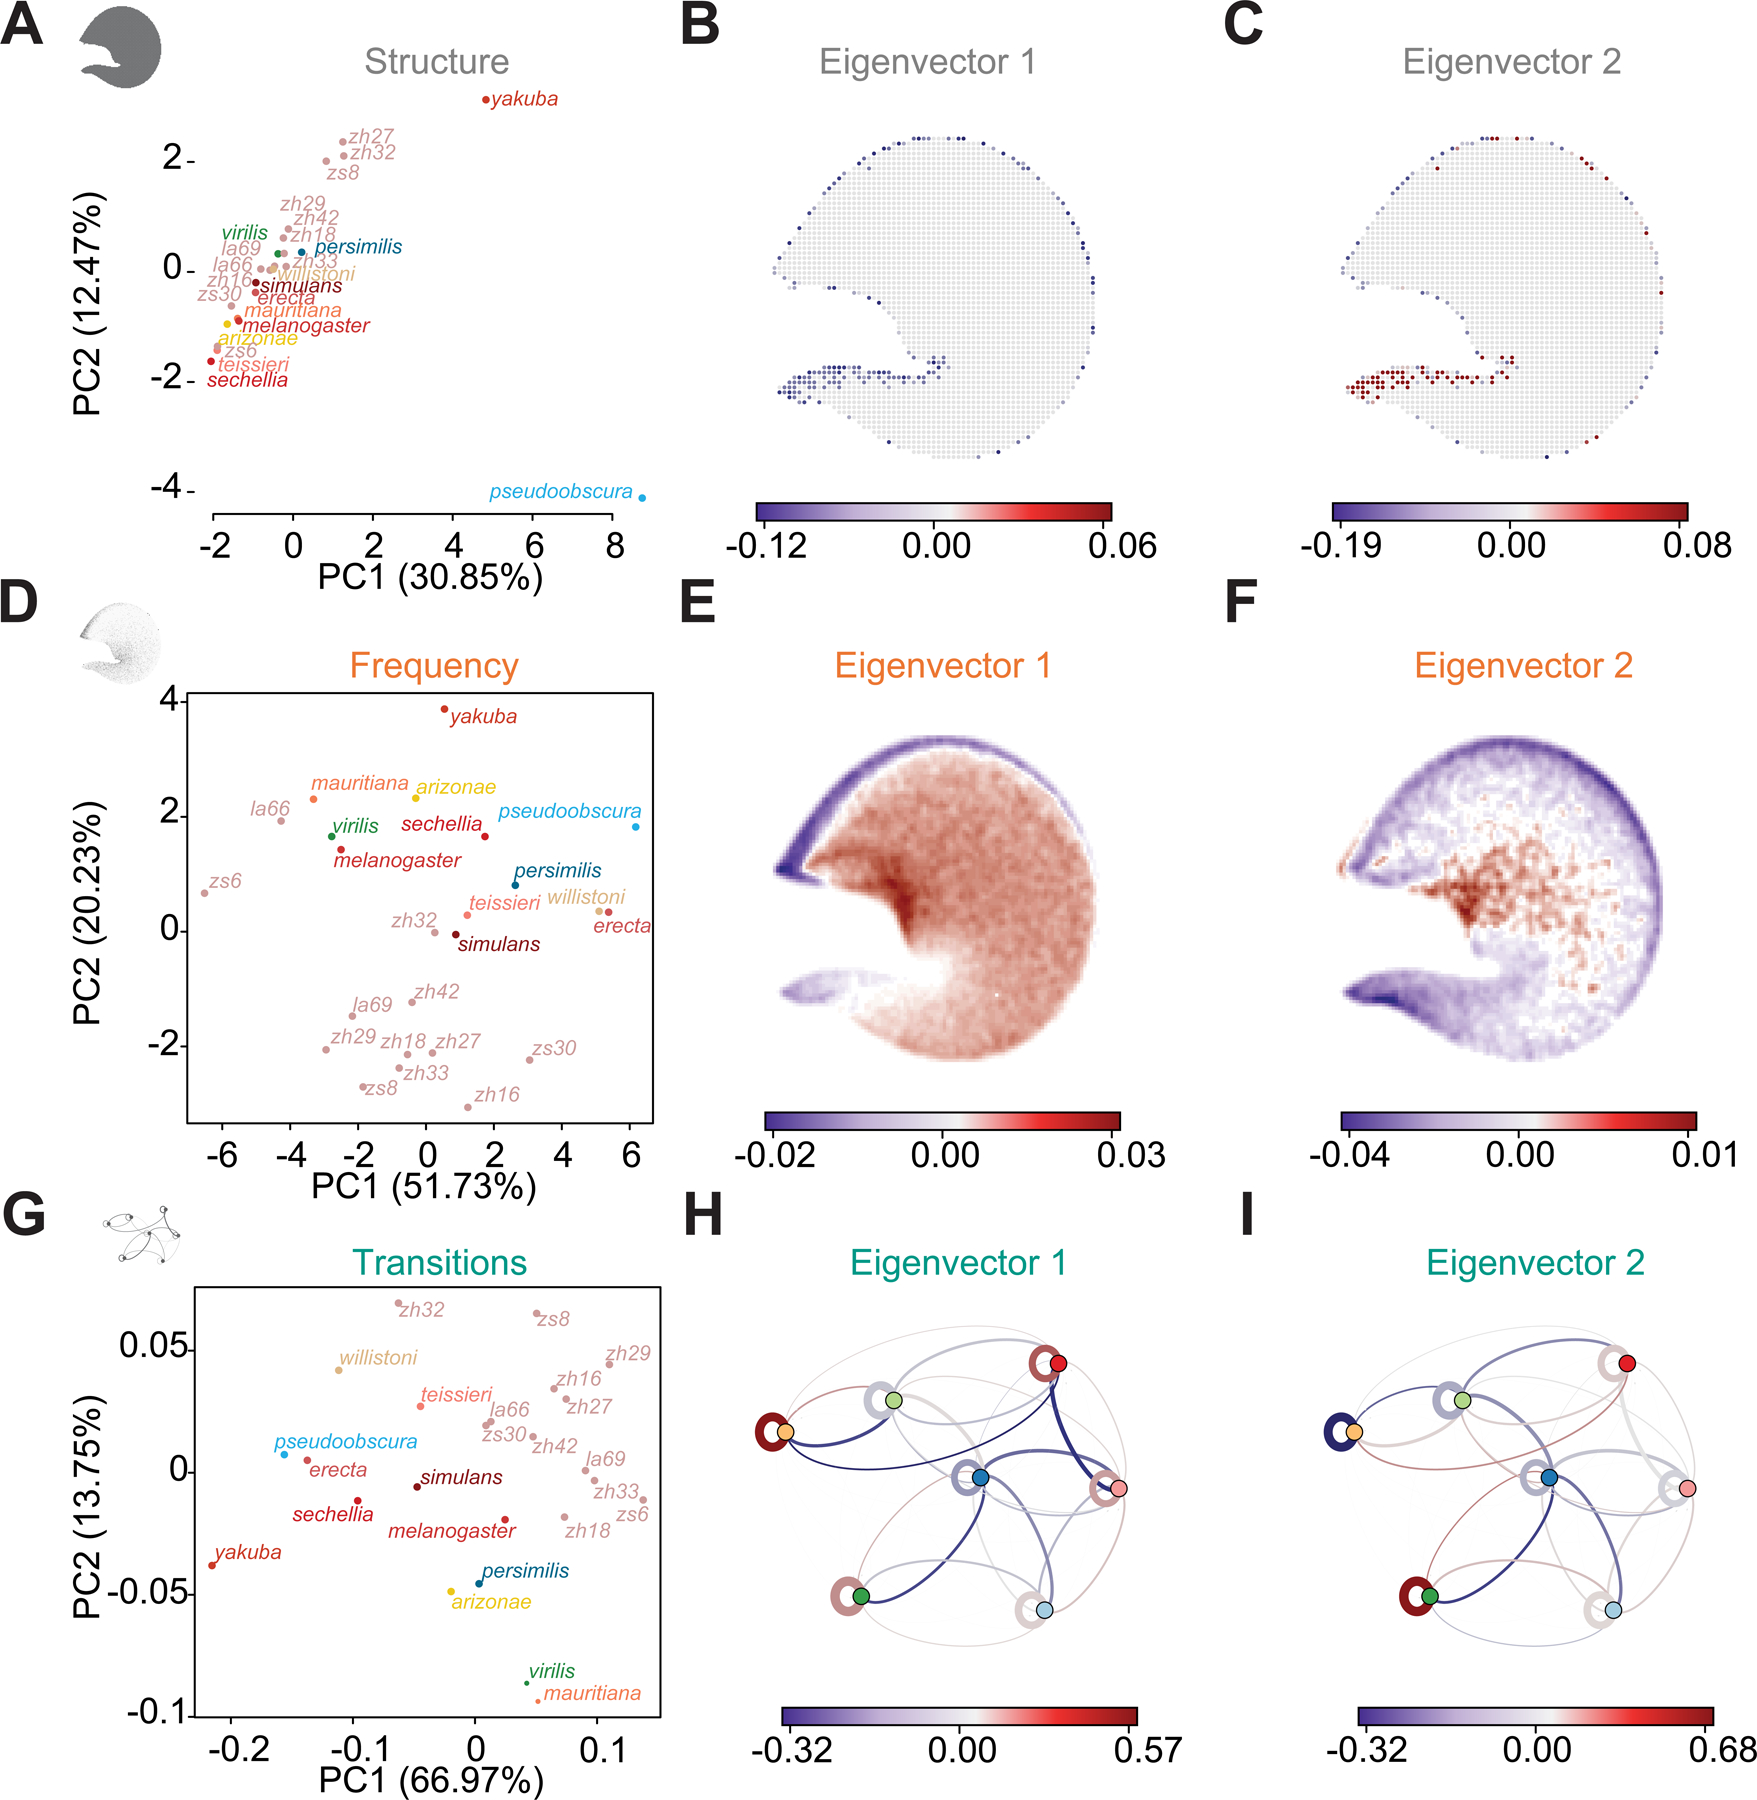
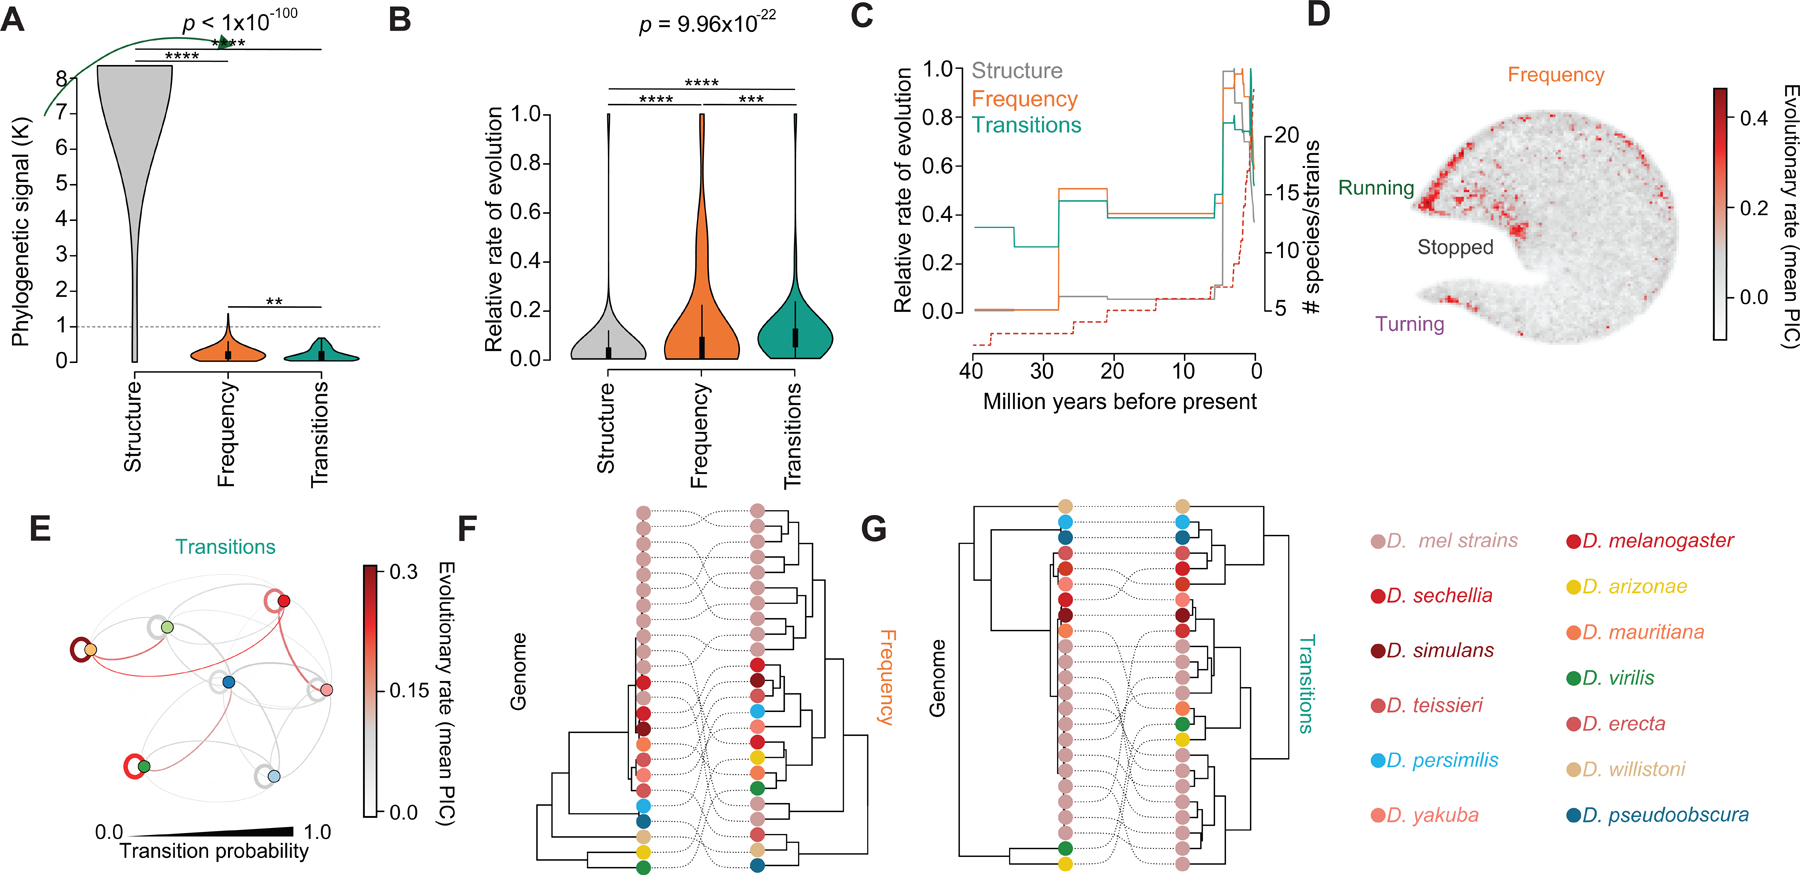
Neural circuits must both execute the behavioral repertoire of individuals and account for behavioral variation across species. Understanding how this variation emerges over evolutionary time requires large-scale phylogenetic comparisons of behavioral repertoires. Here, we describe the evolution of walking in fruit flies by capturing high-resolution, unconstrained movement from 13 species and 15 strains of drosophilids. We find that walking can be captured in a universal behavior space, the structure of which is evolutionarily conserved. However, the occurrence of and transitions between specific movements have evolved rapidly, resulting in repeated convergent evolution in the temporal structure of locomotion. Moreover, a meta-analysis demonstrates that many behaviors evolve more rapidly than other traits. Thus, the architecture and physiology of locomotor circuits can execute precise individual movements in one species and simultaneously support rapid evolutionary changes in the temporal ordering of these modular elements across clades.

Keywords: Drosophila; TREBLE; animal behavior; behavioral evolution; ethology; locomotion; phylogenetics.


Conflict of interest statement

Declaration of interests The authors declare no competing interests.

Figures

Figure 1:
Figure 1:. High-throughput measurement of locomotion across Drosophila
(A) Schematic of the Coliseum. Flies are introduced onto an IR illuminated behavior platform by an automated dispenser. A high-definition camera is suspended above on a stepper-motor system that updates the camera’s position as the fly moves. The visual field of the camera is indicated by the yellow cylinder tracking the fly’s trajectory (marked by the red path). (B) Workflow for acquiring fruit fly position in the Coliseum, extracting orientation, and updating camera position via stepper motors. (C) (above) Time-calibrated phylogeny of the species analyzed. (below) The approximate global locations of the ancestral populations for each species or strain represented in the phylogeny (coded by color). (D) Probability density function of fly position in the Coliseum, computed using the positions of all trials in the data set. The dispenser hole location is indicated by the black dot. (E-G), The distributions of distance covered (E), angular velocity (F), and translational velocity (G) encompassed by the full locomotor data set. See also Figure S1 and Data S2.
Figure 2:
Figure 2:. Defining a universal walking behavior space
(A) The workflow for the TREBLE framework. (B) The distributions of translational (top) and angular (bottom) velocities as a function of position in behavior space. (C) The structure of behavior space annotated with behavioral states and pathways in between. (D) The mean vector field of behavior space. Arrow angle and length indicate the direction and magnitude, respectively, of probabilistic movement between points. The angle degree is also denoted by color, corresponding to the circle plotted above. (E) 2d probability density function representing the frequency of occurrence across behavior space for the full walking dataset. See also Figure S2.
Figure 3:
Figure 3:. Biomechanical and temporal characteristics of walking behavior space
(A) The measurement of gait parameters from videos of freely walking flies. Positions of the fly’s 6 tarsi are acquired for each frame (fly images on left) and are then egocentrically aligned and converted to phase (panel top right) from which swing-stance estimates are made (panel bottom right). Sample distributions are from D. melanogaster. (B) The distribution of translational velocity as a function of number of legs in stance across all genotypes. (C) Emission probabilities corresponding to number of legs in stance as a function of HMM state. (D) The distributions of tripod- and tetrapod-biased densities in behavior space. Darker color corresponds to more bias toward the given gait type. (E) The percent of behavior space covered by pure species in the dataset. Individual trial percentages are denoted per-species as grey points, the mean of which is represented by the larger dark grey point. (F) The distribution of per-bin significance in variance of occurrence across species (measured by Kruskal-Wallis test statistics calculated across all species). Darker colors correspond to increasing Kruskal-Wallis statistics, representing substantial variation in occurrence across species. (G), Autocorrelation functions of behavior space position over a 3 second span as species means. (H) Distributions of the average time taken to return to a point in behavior space, calculated per species. See also Figure S2 and Table S1.
Figure 4:
Figure 4:. The phylogenetic distribution of drosophild walking
(A) The phylogenetic distribution of behavior space frequency maps across all species/strains. Frequency is represented by a heatmap of color ranging from blue to red. Blue regions are less frequently visited, red regions are more frequently visited.
Figure 5:
Figure 5:. Morphospace representations of behavioral variables
(A) Structure morphospace. Variance explained by the first two PCs are denoted in the axes. (B-C) 2d representations of the first 2 eigenvectors associated with the structure morphospace. Eigenvector values correspond to the blue-red heatmap. (D) Frequency morphospace. (E-F) Eigenvector representations of the frequency morphospace. (G) Transitions morphospace. (H-I) Eigenvector representations of the transitions morphospace. See also Figures S3, S4.
Figure 6:
Figure 6:. The dynamics of locomotor evolution across Drosophila
(A) Violin plot of the distribution of phylogenetic signal across behavior space for structure, frequency, and transitions (see Methods; Kruskal-Wallis test followed by post-hoc Dunn’s test) ****P<0.0001, ***P<0.001. (B) Violin plot of the comparison of relative rate of evolution measurements across all nodes in the phylogeny for all three traits (Kruskal-Wallis test followed by post-hoc Dunn’s test) ****P<0.0001, **P<0.001. (C) Mean relative rates of evolution over time for each trait (computed in 0.1 million year windows). Species accumulation was calculated by summing the number of extant species per 0.1 million year window (inferred by the time calibrated phylogeny) and is indicated by the dotted red line. (D) The evolutionary landscape of frequency. Darker colors correspond to greater evolutionary rates (measured by phylogenetic independent contrasts; PIC). (E) The evolutionary landscape of transitions. Transition probability is represented by the thickness of the lines connecting nodes (corresponding to Louvain clusters; see Methods). Evolutionary rate corresponds to darkness of color (phylogenetic independent contrasts; PIC). (F) Cophyloplot comparing the fossil-calibrated whole-genome phylogeny (left) to a phylogeny made from variation in frequency (right). Species are represented by colored nodes at the terminal tips of both phylogenies, with their corresponding positions indicated by dotted lines. (G) Cophyloplot comparing the fossil-calibrated whole-genome phylogeny (left) to a phylogeny made from variation in transitions (right). Color legend of species labels are plotted to the right. See also Figures S3, S4, S5.
Figure 7:
Figure 7:. Rapid, specific, and convergent behavioral evolution in Drosophila
(A) Distribution of relative rate of evolution across five categories of Drosophila traits: behavior, life history, molecular, physiology, and morphology. Points correspond to median values, bars represent standard error. (B) Violin plot of relative rates of evolution given Drosophila trait type (Kruskal-Wallis test P-value). See also Figure S6, Table S2, and Data S1.

References

    1. Katz (2019). My Word: The conservative bias of life scientists. Current Biology 29, R663–R682. - PubMed
    1. Gallant JR, and O’Connell LA (2020). Studying convergent evolution to relate genotype to behavioral phenotype. J Exp Biol 223. - PMC - PubMed
    1. Niepoth N, and Bendesky A (2020). How Natural Genetic Variation Shapes Behavior. Annu Rev Genomics Hum Genet 21, 437–463. - PubMed
    1. Jourjine N, and Hoekstra HE (2021). Expanding evolutionary neuroscience: insights from comparing variation in behavior. Neuron 109, 1084–1099. - PubMed
    1. Pereira TD, Shaevitz JW, and Murthy M (2020). Quantifying behavior to understand the brain. Nat Neurosci 23, 1537–1549. - PMC - PubMed

Publication types

LinkOut - more resources