. 2022 Jun 14;39(11):110954.
doi: 10.1016/j.celrep.2022.110954. Epub 2022 May 26.

Parsing the role of NSP1 in SARS-CoV-2 infection

Affiliations

Parsing the role of NSP1 in SARS-CoV-2 infection

Tal Fisher et al. Cell Rep. .

Abstract

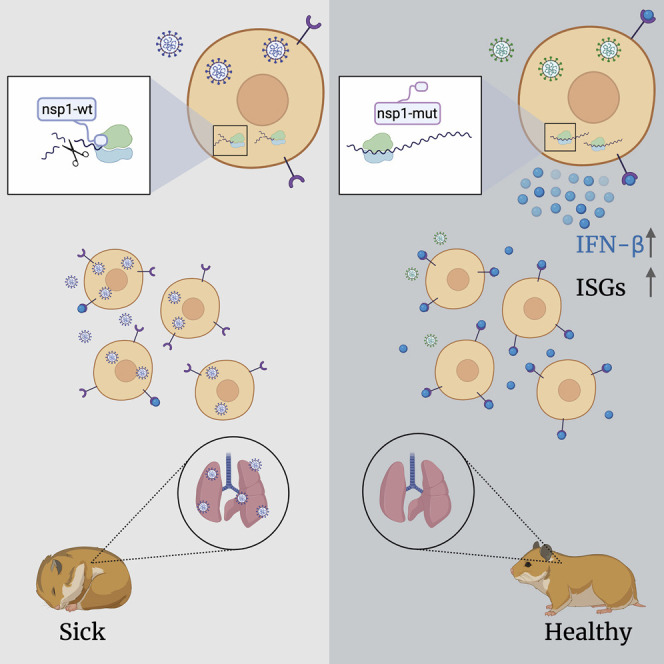
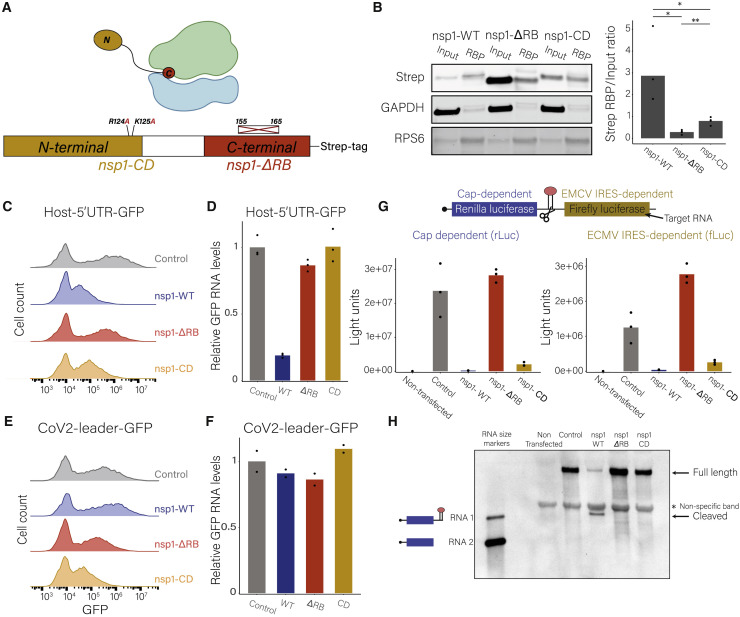
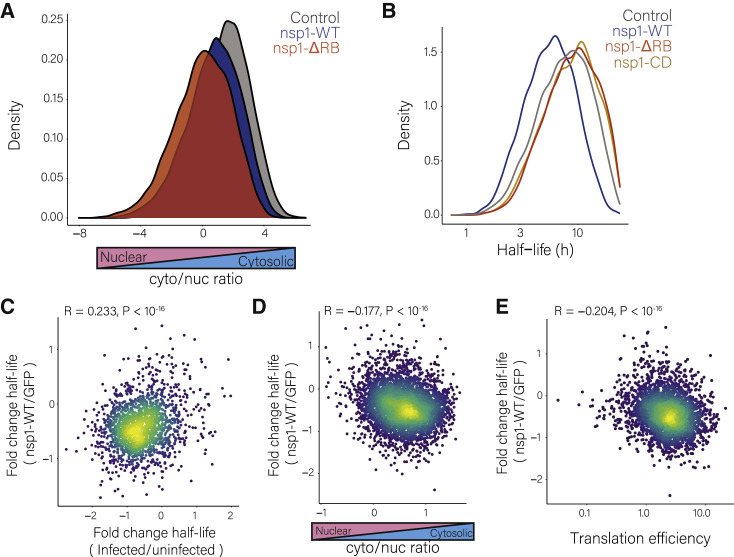
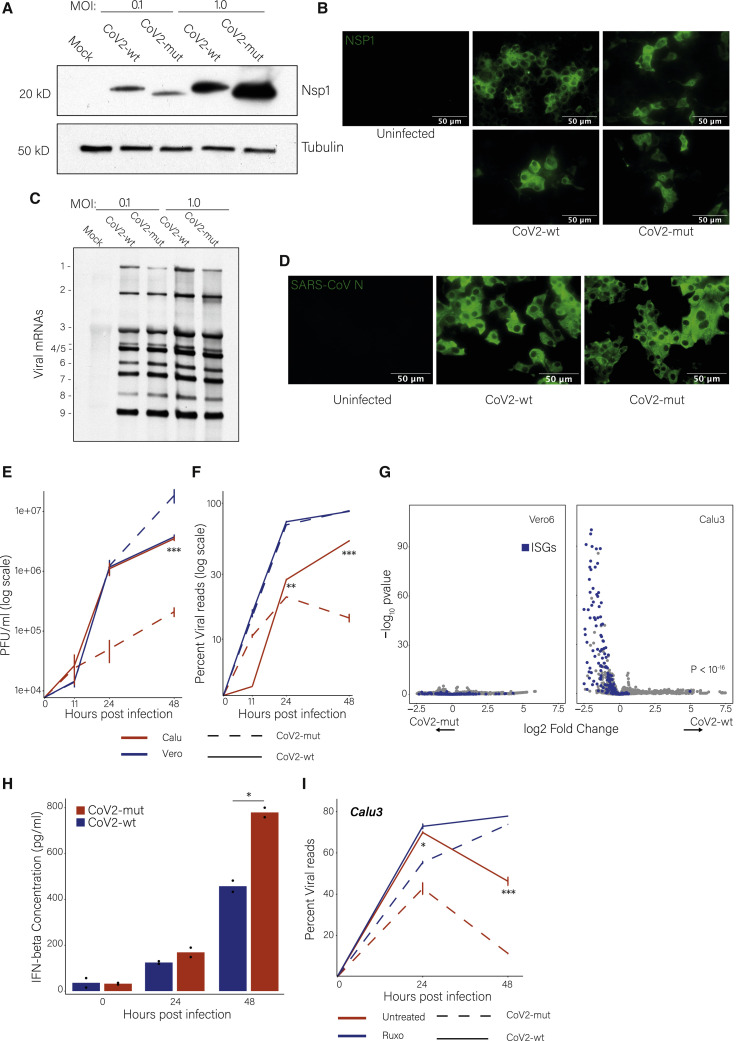
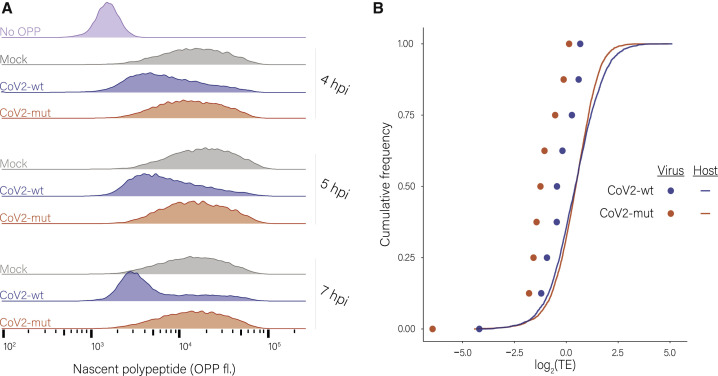
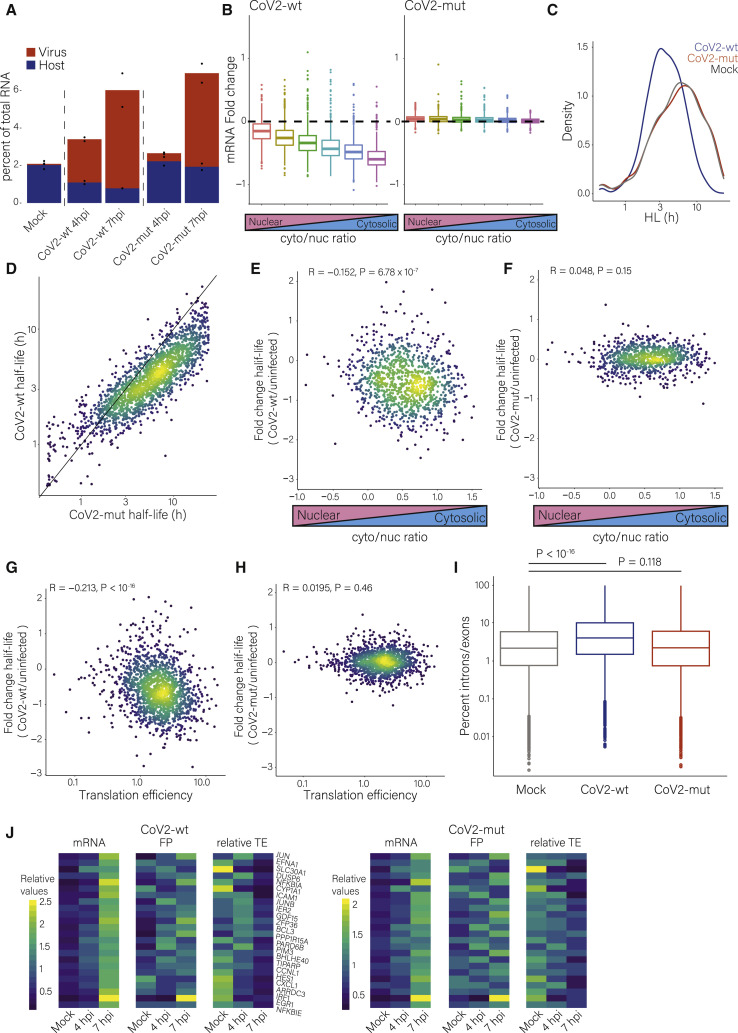
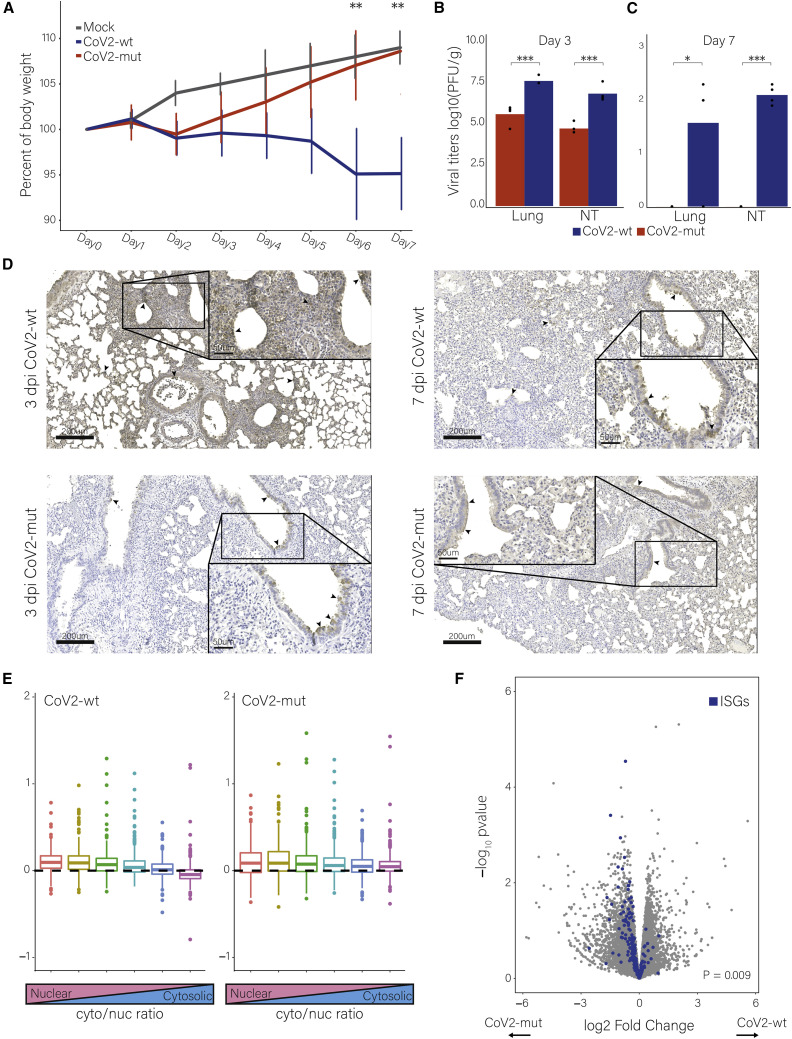
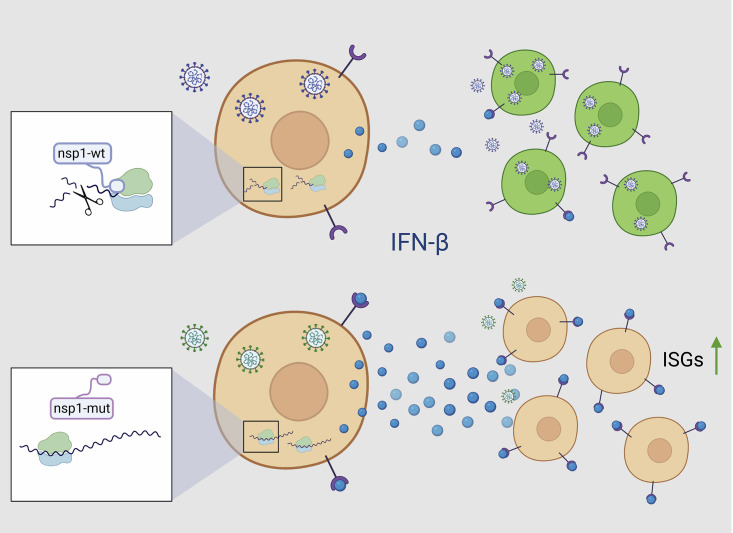
Severe acute respiratory syndrome coronavirus 2 (SARS-CoV-2) leads to shutoff of protein synthesis, and nsp1, a central shutoff factor in coronaviruses, inhibits cellular mRNA translation. However, the diverse molecular mechanisms employed by nsp1 as well as its functional importance are unresolved. By overexpressing various nsp1 mutants and generating a SARS-CoV-2 mutant, we show that nsp1, through inhibition of translation and induction of mRNA degradation, targets translated cellular mRNA and is the main driver of host shutoff during infection. The propagation of nsp1 mutant virus is inhibited exclusively in cells with intact interferon (IFN) pathway as well as in vivo, in hamsters, and this attenuation is associated with stronger induction of type I IFN response. Therefore, although nsp1's shutoff activity is broad, it plays an essential role, specifically in counteracting the IFN response. Overall, our results reveal the multifaceted approach nsp1 uses to shut off cellular protein synthesis and uncover nsp1's explicit role in blocking the IFN response.

Keywords: CP: Microbiology; Coronaviruses; Host shutoff; Interferon; Nsp1; RNA; SARS-CoV-2; Translation regulation.


Conflict of interest statement

Declaration of interests The authors declare no competing interests.

Figures

None
Graphical abstract
Figure 1
Figure 1
Nsp1 promotes both translation inhibition and decay of cellular mRNAs (A) Schematic illustration of the nsp1-ΔRB and nsp1-CD mutations. (B) 293T cells were transfected with nsp1-WT, nsp1-ΔRB, or nsp1-CD, and ribosomes were pelleted. Nsp1 protein levels in the input and in the ribosome pellet (RBP) were measured by western blot with Strep-Tactin. RPS6 and GAPDH were used as ribosomal protein and loading controls, respectively. Right panel presents the ratio of the strep signal in the RBP to input. Data points represent four replicates; p < 0.05 and ∗∗p < 0.01 for a two-tailed t test. (C–F) 293T cells co-transfected with nsp1-WT, nsp1-ΔRB, nsp1-CD, or a control plasmid together with (C and D) a reporter plasmid host-5′UTR-GFP or (E and F) the CoV2-leader-GFP. (C and E) GFP expression was measured by flow cytometry. (D and F) Relative GFP mRNA levels were measured by real-time PCR. 18S ribosomal RNA was used for normalization; two or three replicates are presented. (G and H) Vero E6 cells were co-transfected with the reporter plasmid containing a cap-dependent Renilla luciferase followed by an EMCV IRES and Firefly luciferase along with an empty vector as a control or nsp1-WT, nsp1-ΔRB, or nsp1-CD. (G) Luciferase expression levels are shown. y axis represents light units; three replicates are presented. (H) RNAs were extracted and analyzed by northern blot using a digoxigenin-labeled rLuc riboprobe. RNA size marker is a mixture of in vitro transcribed RNA transcripts, RNA 1 and RNA 2, as shown.
Figure 2
Figure 2
Nsp1 inhibits nuclear mRNA export and accelerates the decay of cytosolic mRNAs (A) Distribution of the cytosolic to nuclear ratio of transcripts in 293T cells transfected with nsp1-WT, nsp1-ΔRB, or a control plasmid. (B) Distribution of cellular transcript half-lives in 293T cells transfected with nsp1-WT, nsp1-ΔRB, nsp1-CD, or a control plasmid. (C) Scatterplot of the fold change of transcript half-lives between SARS-CoV-2-infected and uninfected cells (Finkel et al., 2021a), relative to the fold change of 293T cells expressing nsp1-WT compared with a control. (D and E) Scatterplots of the fold change of transcript half-lives between 293T cells expressing nsp1-WT compared with control relative to (D) cytosolic-to-nuclear ratio or (E) translation efficiency calculated by footprints divided by mRNA.
Figure 3
Figure 3
CoV2-mut is attenuated specifically in IFN competent cells (A) Western blot analysis for nsp1 in Vero E6 cells infected with the CoV2-wt or the CoV2-mut at an MOI of 0.1 or 1. (B) Vero E6 cells infected with CoV2-wt or CoV2-mut at 16 hpi (MOI = 2) and stained for Nsp1. (C) Northern blot analysis using a probe for the common 3′ UTR of viral mRNAs, in Vero E6 cells infected with the CoV2-wt or the CoV2-mut at MOI of 0.1 or 1 at 18 hpi. (D) Vero E6 cells infected with CoV2-wt or CoV2-mut and stained for the nucleocapsid protein. (E and F) Viral titers (E) or percentage of viral reads (F) in Calu3 or Vero E6 cells infected with CoV2-wt or CoV2-mut at 0, 11, 24, and 48 hpi (MOI = 0.01). Three replicates for titers and two replicates for % of viral reads are presented. Mean and standard deviation (SD) are shown. (G) Volcano plots showing changes in cellular transcript levels in CoV2-wt- versus CoV2-mut-infected Calu3 (right) or Vero E6 (left) cells at 24 hpi. The fold change and statistical significance are presented in the x axis and y axis, respectively. ISGs are marked in blue. (H) IFN-beta concentrations measured by ELISA in the supernatant of Calu3 cells infected with CoV2-wt or CoV2-mut (MOI = 0.1) at 0, 24, and 48 hpi. Two replicates are presented. (I) Percentage of viral reads in untreated or ruxolitinib-treated Calu3 cells infected with CoV2-wt or CoV2-mut at 0, 24, and 48 hpi (MOI = 0.01); two replicates are presented. The significance of the effect of ruxolitinib treatment on CoV2-mut compared with CoV2-wt was calculated using linear regression. For all figures, p < 0.05, ∗∗p < 0.01, and ∗∗∗p < 0.001. Mean and SD are shown.
Figure 4
Figure 4
Effects of nsp1 on translation of viral and host mRNAs (A) Calu3 cells infected with CoV2-wt or with CoV2-mut (MOI = 3) for 4, 5, and 7 hpi or an uninfected control following O-propargyl puromycin (OPP) incorporation, fluorescent labeling using click chemistry, and flow cytometry analysis. (B) Cumulative frequency of human (line) and viral (dots) mRNAs according to their relative translation efficiency (TE) in cells infected with CoV2-wt (blue) or CoV2-mut (red) at 4 hpi. Each dot represents one of nine major viral mRNA species.
Figure 5
Figure 5
Nsp1 mediates cellular RNA degradation during SARS-CoV-2 infection (A) Percentage of human or viral transcripts out of total RNA reads. Two replicates are presented. (B) The fold change in RNA levels in CoV2-wt-infected (left) or CoV2-mut-infected (right) cells relative to uninfected cells at 7 hpi. Transcripts were grouped into six bins based on their cytosol-to-nucleus localization. (C) The distribution of cellular transcript half-lives in uninfected or CoV2-wt- or CoV2-mut-infected cells as was determined by SLAM-seq. (D) Scatterplot of cellular transcript half-lives in CoV2-wt- relative to CoV2-mut-infected cells. (E–H) The fold change in transcript half-lives between CoV2-wt- (E and G) or CoV2-mut (F and H)-infected cells and uninfected cells, relative to the cytosol-to-nucleus ratio (E and F) or translation efficiency (G and H). Pearson’s R and two-sided p values are presented. (I) The ratio of intronic to exonic reads in uninfected or CoV2-wt- or CoV2-mut-infected cells at 4 hpi. (J) Heatmaps showing the relative mRNA, footprints, and translation efficiency at 4 and 7 hpi of cellular genes that were induced in infected cells.
Figure 6
Figure 6
Nsp1 plays a critical role in SARS-CoV-2 pathogenesis in vivo (A) Hamster weight as a percentage of their weight on day 0 for hamsters infected with CoV2-mut, CoV2-wt, and mock. Mean and SD are shown. ∗∗p < 0.01. (B and C) Viral titers in lungs and in NT at 3 dpi (B) and 7 dpi (C) for CoV2-wt- and CoV2-mut-infected hamsters. (A–C) Two-tailed t test is performed; p < 0.05 and ∗∗∗p < 0.001. On days 0–3, eight replicates are presented. From day 4, four replicates are presented for the infected groups and eight for the control. (D) IHC staining of lungs for spike (brown) with hematoxylin counterstain (blue) for hamsters infected with CoV2-wt or CoV2-mut at 3 dpi and 7 dpi. Arrows indicate select infected cells. (E) The fold change in mRNA levels in CoV2-wt-infected (left) or CoV2-mut-infected (right) relative to mock-infected hamsters at 3 dpi. Transcripts were grouped into six bins based on their cytosol-to-nucleus ratio. (F) Cellular transcript levels in CoV2-wt- versus CoV2-mut-infected hamsters at 3 dpi. The fold change and significance are presented in the x axis and y axis, respectively. ISGs are marked in blue. ISGs enrichment was calculated using a hypergeometric test. Two extreme genes were removed.
Figure 7
Figure 7
Proposed model for nsp1-mediated immune evasion Nsp1 blocks translation and degrades cellular mRNAs, and this leads to global reduction in protein production, including reduction in the production of IFN-ꞵ. Infected and bystander neighboring cells are exposed to minimal amounts of IFN-ꞵ, and the virus can efficiently propagate. During CoV2-mut infection, nsp1 does not block the translation of cellular mRNAs and IFN-ꞵ is produced. ISGs expression is induced in infected and bystander neighboring cells, leading to reduction in viral propagation.

Update of

References

    1. Abernathy E., Glaunsinger B. Emerging roles for RNA degradation in viral replication and antiviral defense. Virology. 2015;479-480:600–608. doi: 10.1016/j.virol.2015.02.007. - DOI - PMC - PubMed
    1. Addetia A., Lieberman N.A.P., Phung Q., Hsiang T.-Y., Xie H., Roychoudhury P., Shrestha L., Loprieno M.A., Huang M.-L., Gale M., Jr., et al. SARS-CoV-2 ORF6 disrupts bidirectional nucleocytoplasmic transport through interactions with Rae1 and Nup98. mBio. 2021;12:e00065-21. doi: 10.1128/mbio.00065-21. - DOI - PMC - PubMed
    1. Banerjee A.K., Blanco M.R., Bruce E.A., Honson D.D., Chen L.M., Chow A., Bhat P., Ollikainen N., Quinodoz S.A., Loney C., et al. SARS-CoV-2 disrupts splicing, translation, and protein trafficking to suppress host defenses. Cell. 2020;183:1325–1339.e21. doi: 10.1016/j.cell.2020.10.004. - DOI - PMC - PubMed
    1. Burke J.M., St Clair L.A., Perera R., Parker R. SARS-CoV-2 infection triggers widespread host mRNA decay leading to an mRNA export block. RNA. 2021;27:1318–1329. doi: 10.1261/rna.078923.121. - DOI - PMC - PubMed
    1. Carlevaro-Fita J., Liu L., Zhou Y., Zhang S., Chouvardas P., Johnson R., Li J. LnCompare: gene set feature analysis for human long non-coding RNAs. Nucleic. Acids. Res. 2019;47:W523–W529. doi: 10.1093/nar/gkz410. - DOI - PMC - PubMed

Publication types

Substances