

Effects of stimulus pulse rate on somatosensory adaptation in the human cortex
- PMID: 35671947
- PMCID: PMC10308851
- DOI: 10.1016/j.brs.2022.05.021
Effects of stimulus pulse rate on somatosensory adaptation in the human cortex
Abstract
Background: Intracortical microstimulation (ICMS) of the somatosensory cortex can restore sensation to people with neurological diseases. However, many aspects of ICMS are poorly understood, including the effect of stimulation on percept intensity over time.
Objective: Here, we evaluate how tactile percepts evoked by ICMS in the somatosensory cortex of a human participant adapt over time.
Methods: We delivered continuous and intermittent ICMS to the somatosensory cortex and assessed the reported intensity of tactile percepts over time in a human participant. Experiments were conducted over approximately one year and linear mixed effects models were used to assess significance.
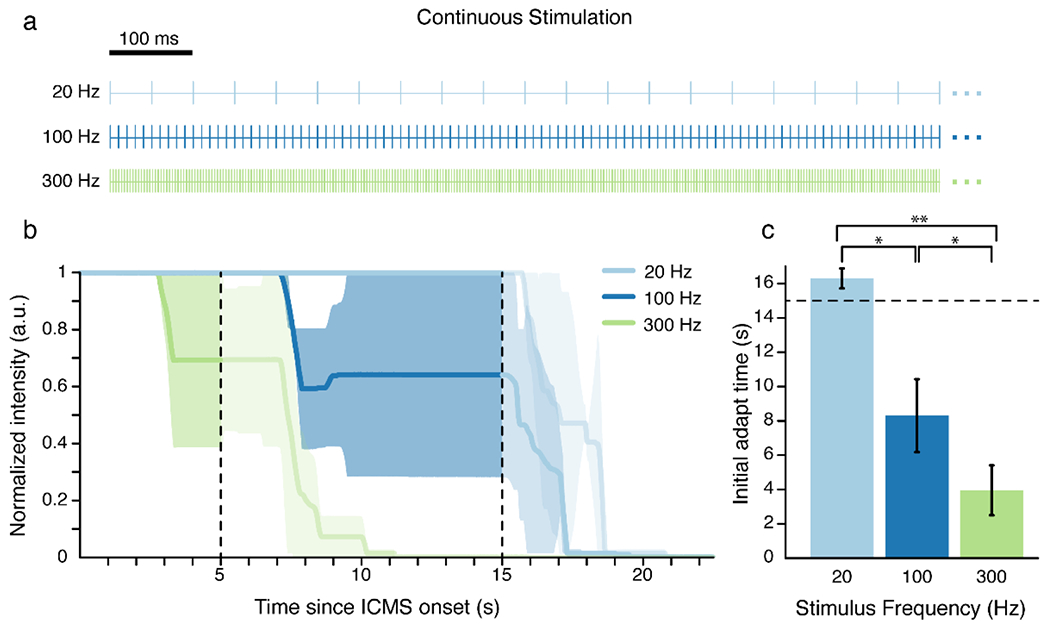
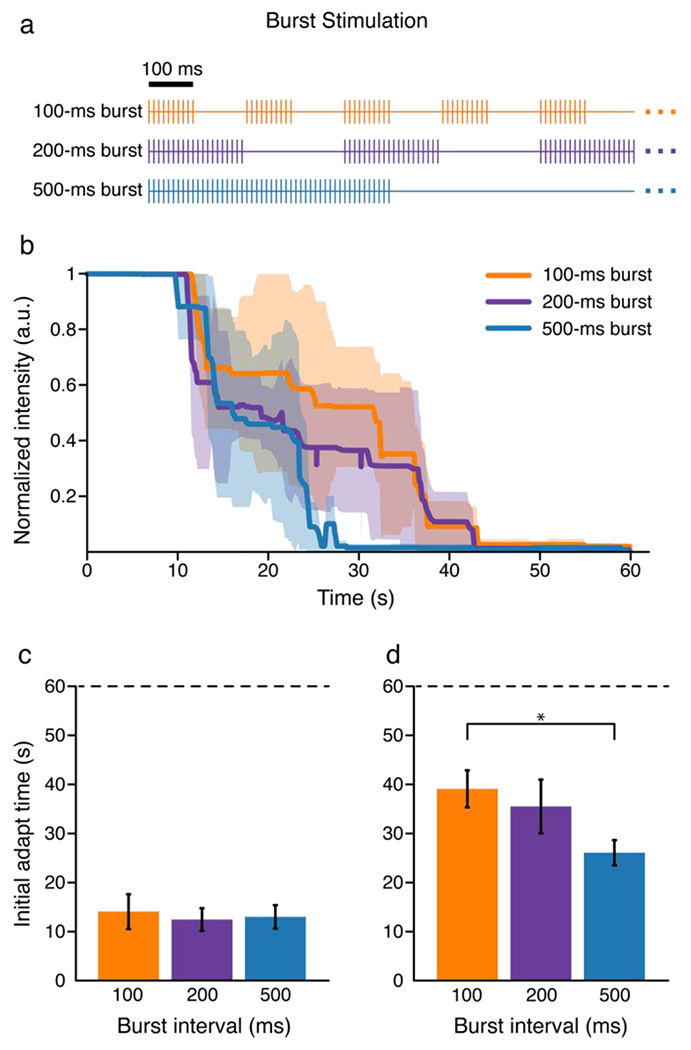
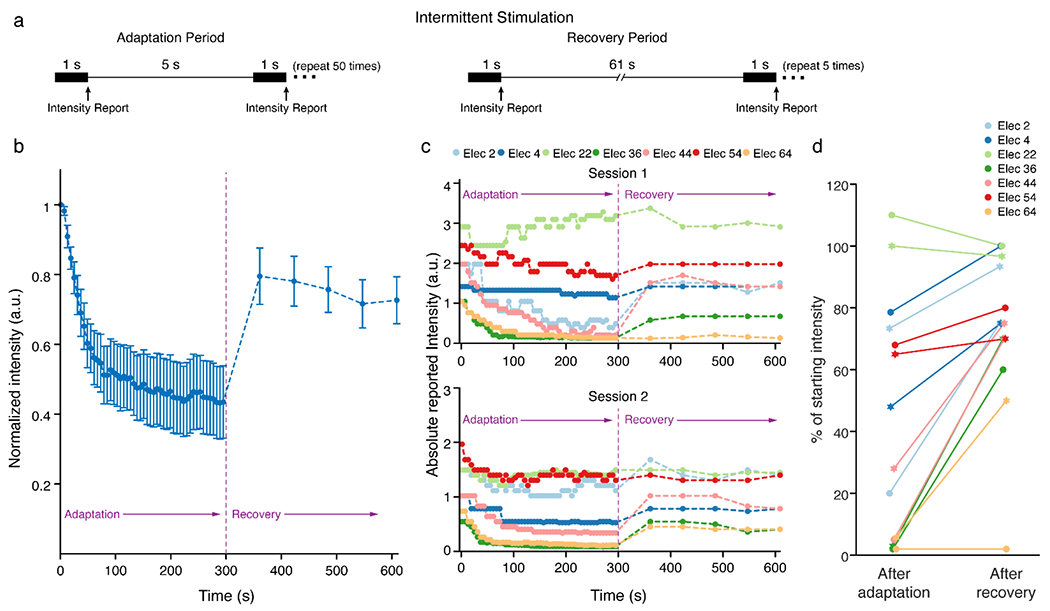
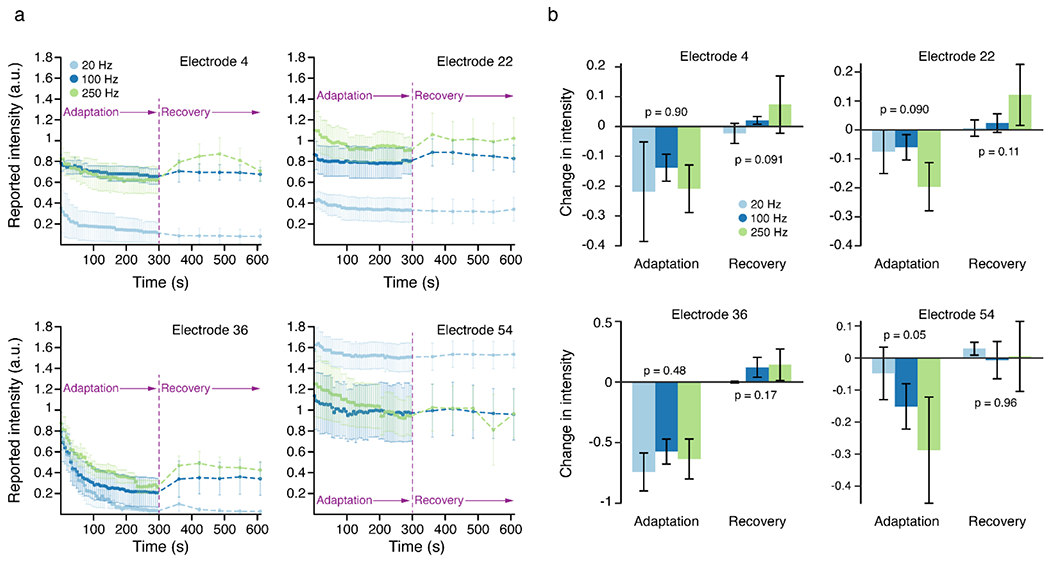
Results: Continuous stimulation at high frequencies led to rapid decreases in intensity, while low frequency stimulation maintained percept intensity for longer periods. Burst-modulated stimulation extended the time before the intensity began to decrease, but all protocols ultimately resulted in complete sensation loss within 1 min. Intermittent stimulation paradigms with several seconds between stimulus trains evoked intermittent percepts and also led to decreases in intensity on many electrodes, but never resulted in extinction of the sensation after over 3 min of stimulation. Longer breaks between each pulse train resulted in some recovery in the intensity of the stimulus-evoked percepts. For several electrodes, intermittent stimulation had almost no effect on the perceived intensity.
Conclusions: Intermittent ICMS paradigms were more effective at maintaining percepts. Given that transient neural activity dominates the response in somatosensory cortex during mechanical contact onsets and offsets, providing brief stimulation trains at these times may more closely represent natural cortical activity and have the additional benefit of prolonging the ability to evoke sensations over longer time periods.
Keywords: Adaptation; Brain-computer interfaces; Intracortical microstimulation; Microelectrode arrays; Sensory restoration; Somatosensory cortex.
Copyright © 2022 The Authors. Published by Elsevier Inc. All rights reserved.
Conflict of interest statement
Declaration of competing interest The authors declare the following financial interests/personal relationships which may be considered as potential competing interests: R.A.G. is a paid consultant for Blackrock Microsystems and serves on the scientific advisory board of Braingrade.
Figures
Similar articles
-
Dynamic amplitude modulation of microstimulation evokes biomimetic onset and offset transients and reduces depression of evoked calcium responses in sensory cortices.Brain Stimul. 2023 May-Jun;16(3):939-965. doi: 10.1016/j.brs.2023.05.013. Epub 2023 May 25. Brain Stimul. 2023. PMID: 37244370 Free PMC article.
-
Neural stimulation and recording performance in human sensorimotor cortex over 1500 days.J Neural Eng. 2021 Aug 13;18(4):10.1088/1741-2552/ac18ad. doi: 10.1088/1741-2552/ac18ad. J Neural Eng. 2021. PMID: 34320481 Free PMC article.
-
The Neurophysiological Representation of Imagined Somatosensory Percepts in Human Cortex.J Neurosci. 2021 Mar 10;41(10):2177-2185. doi: 10.1523/JNEUROSCI.2460-20.2021. Epub 2021 Jan 22. J Neurosci. 2021. PMID: 33483431 Free PMC article.
-
Restoring tactile and proprioceptive sensation through a brain interface.Neurobiol Dis. 2015 Nov;83:191-8. doi: 10.1016/j.nbd.2014.08.029. Epub 2014 Sep 6. Neurobiol Dis. 2015. PMID: 25201560 Free PMC article. Review.
-
Toward a Proprioceptive Neural Interface that Mimics Natural Cortical Activity.Adv Exp Med Biol. 2016;957:367-388. doi: 10.1007/978-3-319-47313-0_20. Adv Exp Med Biol. 2016. PMID: 28035576 Free PMC article. Review.
Cited by
-
Intracortical microstimulation of human somatosensory cortex is sufficient to induce perceptual biases.medRxiv [Preprint]. 2024 Apr 22:2024.04.19.24305901. doi: 10.1101/2024.04.19.24305901. medRxiv. 2024. Update in: Brain Stimul. 2024 Nov-Dec;17(6):1178-1185. doi: 10.1016/j.brs.2024.10.005. PMID: 38712172 Free PMC article. Updated. Preprint.
-
Subthreshold intracortical microstimulation of human somatosensory cortex enhances tactile sensitivity.Brain Stimul. 2025 May-Jun;18(3):900-908. doi: 10.1016/j.brs.2025.03.021. Epub 2025 Apr 10. Brain Stimul. 2025. PMID: 40216307
-
Neuromorphic hardware for somatosensory neuroprostheses.Nat Commun. 2024 Jan 16;15(1):556. doi: 10.1038/s41467-024-44723-3. Nat Commun. 2024. PMID: 38228580 Free PMC article. Review.
-
Intracortical microstimulation pulse waveform and frequency recruits distinct spatiotemporal patterns of cortical neuron and neuropil activation.J Neural Eng. 2022 Mar 31;19(2):10.1088/1741-2552/ac5bf5. doi: 10.1088/1741-2552/ac5bf5. J Neural Eng. 2022. PMID: 35263736 Free PMC article.
-
Neural mechanisms of the temporal response of cortical neurons to intracortical microstimulation.Brain Stimul. 2024 Mar-Apr;17(2):365-381. doi: 10.1016/j.brs.2024.03.012. Epub 2024 Mar 16. Brain Stimul. 2024. PMID: 38492885 Free PMC article.
References
-
- Fifer MS, McMullen DP, Thomas TM, Osborn LE, Nickl R, Candrea D, et al. Intracortical microstimulation of human fingertip sensations. MedRxiv 2020. 10.1101/2020.05.29.20117374. - DOI
-
- Flesher S, Downey J, Collinger J, Foldes S, Weiss J, Tyler-Kabara E, et al. Intracortical Microstimulation as a Feedback Source for Brain-Computer Interface Users. Proceedings of the 6th International Brain-Computer Interface Meeting, 2017, p. 43–54. 10.1007/978-3-319-64373-1_5. - DOI
-
- Hughes CL, Herrera A, Gaunt R, Collinger J. Bidirectional brain-computer interfaces. Handbook of Clinical Neurology 2020;168:163–81. - PubMed
Publication types
MeSH terms
Grants and funding
LinkOut - more resources
Full Text Sources
