. 2022 Jul 6;42(27):5294-5313.
doi: 10.1523/JNEUROSCI.2427-21.2022. Epub 2022 Jun 7.

Microglial mTOR Activation Upregulates Trem2 and Enhances β-Amyloid Plaque Clearance in the 5XFAD Alzheimer's Disease Model

Affiliations

Microglial mTOR Activation Upregulates Trem2 and Enhances β-Amyloid Plaque Clearance in the 5XFAD Alzheimer's Disease Model

Qian Shi et al. J Neurosci. .

Abstract

The mechanistic target of rapamycin (mTOR) signaling pathway plays a major role in key cellular processes including metabolism and differentiation; however, the role of mTOR in microglia and its importance in Alzheimer's disease (AD) have remained largely uncharacterized. We report that selective loss of Tsc1, a negative regulator of mTOR, in microglia in mice of both sexes, caused mTOR activation and upregulation of Trem2 with enhanced β-Amyloid (Aβ) clearance, reduced spine loss, and improved cognitive function in the 5XFAD AD mouse model. Combined loss of Tsc1 and Trem2 in microglia led to reduced Aβ clearance and increased Aβ plaque burden revealing that Trem2 functions downstream of mTOR. Tsc1 mutant microglia showed increased phagocytosis with upregulation of CD68 and Lamp1 lysosomal proteins. In vitro studies using Tsc1-deficient microglia revealed enhanced endocytosis of the lysosomal tracker indicator Green DND-26 suggesting increased lysosomal activity. Incubation of Tsc1-deficient microglia with fluorescent-labeled Aβ revealed enhanced Aβ uptake and clearance, which was blunted by rapamycin, an mTOR inhibitor. In vivo treatment of mice of relevant genotypes in the 5XFAD background with rapamycin, affected microglial activity, decreased Trem2 expression and reduced Aβ clearance causing an increase in Aβ plaque burden. Prolonged treatment with rapamycin caused even further reduction of mTOR activity, reduction in Trem2 expression, and increase in Aβ levels. Together, our findings reveal that mTOR signaling in microglia is critically linked to Trem2 regulation and lysosomal biogenesis, and that the upregulation of Trem2 in microglia through mTOR activation could be exploited toward better therapeutic avenues to Aβ-related AD pathologies.SIGNIFICANCE STATEMENT Mechanistic target of rapamycin (mTOR) signaling pathway is a key regulator for major cellular metabolic processes. However, the link between mTOR signaling and Alzheimer's disease (AD) is not well understood. In this study, we provide compelling in vivo evidence that mTOR activation in microglia would benefit β-Amyloid (Aβ)-related AD pathologies, as it upregulates Trem2, a key receptor for Aβ plaque uptake. Inhibition of mTOR pathway with rapamycin, a well-established immunosuppressant, downregulated Trem2 in microglia and reduced Aβ plaque clearance indicating that mTOR inactivation may be detrimental in Aβ-associated AD patients. This finding will have a significant public health impact and benefit, regarding the usage of rapamycin in AD patients, which we believe will aggravate the Aβ-related AD pathologies.

Keywords: Alzheimer's disease; Trem2; mTOR; microglia; rapamycin; β-amyloid.


Figures

Figure 1.
Figure 1.
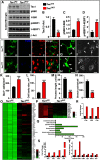
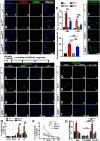
Loss of Tsc1 causes mTOR activation and morphologic and physiological changes in microglia. A, Representative immunoblots showing protein levels of Tsc1, pS6K (Thr389), total S6K, p4EBP1 (Thr37/46), and total 4EBP1 in Tsc1Fx and Tsc1iKO microglia. Microglia were freshly isolated by CD11b antibody-conjugated magnet beads from two-month-old mice (one month after TAM injection for both genotypes). Each lane represents microglia lysates from individual animals. B–D, Relative protein levels of Tsc1, pS6K, and p4EBP1 were normalized and quantified (n = 3M/3F for each genotype). E, F, Representative immunostaining images of brain cortex regions using Iba1 (a, green), F4/80 (b, blue), and NeuN (c, red) from two-month-old of Tsc1Fx and Tsc1iKO mice. Arrows in Fb point to F4/80 positive microglia (scale bar: 100 μm). G, H, High-magnification images of Iba1+ single microglia from Tsc1Fx and Tsc1iKO. Arrows point to microglia soma and arrowheads point to processes. Scale bar: 50 μm. I, J, Phase-contrast images of microglia from in vitro culture. Arrows point to soma and arrowheads point to processes. Scale bar: 5 μm. K–N, Morphologic parameters of 40–50 microglia per animal were quantified from Tsc1Fx and Tsc1iKO (microglia numbers or images were obtained in cortex and hippocampus regions, n = 3M/3F). O, P, Two heatmaps display hierarchical clustering of top 50 upregulated (O) and 13 downregulated DGEs (P) in all samples analyzed (n = 2 M/1F). Q, The pathway analysis showing the top eight pathways that were significantly altered in Tsc1iKO comparing to Tsc1Fx mouse brains. R–T, The fold changes for selected gene families showing C1q family (R), cathepsin proteins (S), and lysosomal proteins (T). From B–D and K–N, unpaired Student's t test has been performed between two groups, **p < 0.01, ***p < 0.001 as compared with WT. All data are presented as mean ± SEM.
Figure 2.
Figure 2.
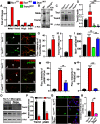
Loss of Tsc1 in microglia upregulates Trem2 and causes Trem2-dependent activation of microglia. A, The fold changes for selected AD-risk genes in Tsc1iKO versus Tsc1Fx mice. B, Immunoblot of total Trem2 protein levels from purified microglia from one-month-old WT and Trem2KO (Trem2Fx;Actin-Cre). Each lane presents mixed microglia isolation from three mice. C, Representative immunoblot of total Tsc1 and Trem2 protein levels from purified microglia from two-month-old Tsc1Fx, Tsc1iKO, Trem2iKO, and DualiKO. Each lane presents a mixed microglia isolation from three mice. D, Relative levels of Trem2 normalized to β-Actin in Tsc1Fx versus Tsc1iKO (n = 3M/3F). E, F, Representative immunostaining of cortical brain sections for Trem2 (green) and Iba1 (red) from Tsc1Fx (E) and Tsc1iKO (F) mice. Arrowheads point to microglia soma. Scale bar: 5 μm. G, Quantification of Trem2 immunofluorescence staining in Iba1+ cells (50 microglia were analyzed for each animal; n = 3M/3F for each genotype). H, RT-PCR analysis for Trem2 mRNA levels from Tsc1Fx and Tsc1iKO microglia normalized to β-Actin (n = 3M/3F for each genotype). I, Quantification of the number of Iba1+ cells in cortex and hippocampus regions in two-month-old Tsc1Fx, Tsc1iKO, Trem2iKO, and DualiKO (n = 3M/3F for each genotype). J–L, Representative immunostaining of brain section against p4EBP1 (green) and F4/80 (red) from cortex region of Tsc1Fx (J), Tsc1iKO (K), and DualiKO (L). M, N, Quantification of immunofluorescence staining of p4EBP1 (M) and F4/80 (N) in microglia from Tsc1Fx, Tsc1iKO, and DualiKO (50 microglia were analyzed for each animal, and n = 3M/3F for each genotype). O, Immunoblots showing protein levels of Trem2 and pS6K in primary microglia culture derived from Tsc1cKO treated with DMSO or rapamycin. Each lane represents one batch of primary microglia culture derived from four to five P0–P3 pups, and rapamycin was applied to the culture at 10 nm in a serum-free medium for 24 h. P, Quantification of protein levels of Trem2 and pS6K in primary microglia culture derived from Tsc1cKO microglia treated with DMSO (left) or rapamycin (right; n = 3). Q, In vitro uptake of FAM-Aβ (green) by primary microglia derived from Tsc1Fx, Tsc1cKO, or rapamycin-treated microglia cells from Tsc1cKO and stained against Iba1 (red) and DAPI (blue). Scale bar: 25 μm. R, The average intensity of FAM-Aβ in each FAM-positive cell from Tsc1Fx, Tsc1cKO, or rapamycin-treated Tsc1−/− microglia. Comparisons between genotypes were performed by one-way ANOVA with Tukey's post hoc test (D, I, M, N, R). And unpaired Student's t test has been performed between two groups (G, H, P). *p < 0.05, **p < 0.01, ***p < 0.001 as compared with WT, and #p < 0.05, ##p < 0.01, ###p < 0.001 as compared within experiment groups as indicated.
Figure 3.
Figure 3.
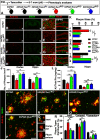
mTOR activation reduces Aβ plaque burden and ameliorates amyloid pathology. A, Schematic showing the timeline of experiments and mouse models (color-coded). B, D, F, H, Representative immunostaining of whole-brain coronal sections with anti-Aβ (Ba, Da, Fa, Ha, red) and staining with fluorescent dye MX04 (Bb, Db, Fb, Hb, green) from 5XFAD and 5XFAD;Tsc1iKO, 5XFAD;Trem2iKO, and 5XFAD;DualiKO. Scale bar: 1 mm. C, E, G, I, Representative immunostaining of magnified images of cortical (Ca, Ea, Ga, Ia) and hippocampal section (Cb, Eb, Gb, Ib) with anti-NeuN (red) and staining with fluorescent dye MX04 (green) from 5XFAD and 5XFAD;Tsc1iKO, 5XFAD;Trem2iKO, and 5XFAD;DualiKO. Scale bar: 50 μm. J, The number of plaques quantified in 5XFAD (n = 3M/4F) and 5XFAD;Tsc1iKO (n = 5 M/4F), 5XFAD;Trem2iKO (n = 3M/3F), and 5XFAD;DualiKO (n = 3M/3F). The number of plaques for each animal was averaged from three sections at different depths in the cortex and hippocampal areas. K, Number of plaques grouped according to the size of plaques (diameter) at <10 μm, 11–40 μm and >40 μm and quantified for the whole brains from 5XFAD and 5XFAD;Tsc1iKO, 5XFAD;Trem2iKO, and 5XFAD;DualiKO. Mice were the same cohort as in J. L, Protein levels of Aβ42 in insoluble, guanidine-HCl-extracted fraction from cortex and hippocampus of 5XFAD (n = 4 M/4F), 5XFAD;Tsc1iKO (n = 5 M/4F), 5XFAD;Trem2iKO (n = 3M/5F) and 5XFAD;DualiKO (n = 3M/4F; normalized to total protein levels). M–P, Representative immunostaining of brain sections from 5XFAD, 5XFAD;Tsc1iKO, 5XFAD;Trem2iKO, and 5XFAD;DualiKO with anti-Aβ antibody (red) and MX04 dye (green) shown in M–P, respectively Scale bar: 25 μm. Q, Types of Aβ plaques defined by morphology and compactness. R, Quantification of plaque types in 5XFAD, 5XFAD;Tsc1iKO, 5XFAD;Trem2iKO, and 5XFAD;DualiKO. Mice were the same cohort as in J. Comparisons between genotypes were performed by one-way ANOVA with Tukey's post hoc test; * or #p < 0.05, ** or ##p < 0.01, *** or ###p < 0.001. Data are presented as mean ± SEM.
Figure 4.
Figure 4.
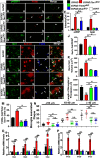
Activation of mTOR in microglia reduces dendritic spine loss and improves cognitive functions. A, Representative Golgi–Cox staining images of brain sections from WT (CONT), 5XFAD, 5XFAD;Tsc1iKO, 5XFAD;Trem2iKO, and 5XFAD;DualiKO. Scale bar: 5 μm. B, Quantification of spine densities in axon segments from CONT, 5XFAD, 5XFAD;Tsc1iKO, 5XFAD;Trem2iKO, and 5XFAD;DualiKO (50 spines were taken for each animal, and the average of spine densities were calculated; n = 3M/3F for each genotype). C, D, Results of the Morris water maze tests CONT (open circle, n = 8 M/7F) 5XFAD (black circle, n = 7 M/8F), and 5XFAD;Tsc1iKO (red circle, n = 8 M/7F). Escape latency showing the average time for each mouse to reach the hidden platform during the training course (C; two-way ANOVA with Tukey's post hoc test, *p < 0.05, **p < 0.01, ***p < 0.001). Path length showing the length of swimming path taken to find the platform during the training course (D; two-way ANOVA with Tukey's post hoc test). E, Typical escape route (the swimming path of mice) in CONT, 5XFAD, and 5XFAD;Tsc1iKO. F, The time each mouse spent in the hidden platform quadrant on day 6, in 1-min duration. Each dot represents one mouse. G, The number of entries to the hidden platform area on day 6 by CONT, 5XFAD, 5XFAD;Tsc1iKO mice recorded in 1 min. Each dot represents one mouse. Comparisons between genotypes were performed by one-way ANOVA with Tukey's post hoc test; *** or ###p < 0.001. All data are presented as mean ± SEM.
Figure 5.
Figure 5.
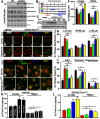
mTOR activation enhances microglial Aβ clearance in AD mouse models. A–D, Brain sections from 5XFAD (A), 5XFAD;Tsc1iKO (B), 5XFAD;Trem2iKO (C), and 5XFAD;DualiKO (D) were immunostained with p4EBP1 (a, green) and F4/80 (b, red), and merged pictures were shown in c (scale bar: 5 µm). The images were obtained from cortical regions. E, The relative p4EBP1 or F4/80 immunostaining per cell was quantified for all four genotypes. All mice used in this figure were the same mouse cohort used in Figure 3J. F–I, Representative immunostaining of brain sections from 5XFAD, 5XFAD;Tsc1iKO, 5XFAD;Trem2iKO, and 5XFAD;DualiKO using antibodies against Iba1 (green), Aβ (red), and F4/80 (blue). Arrows point to microglia showing F4/80 immunofluorescence (scale bar: 20 μm). J, Quantification for Iba1+ microglia numbers from cortex and hippocampus regions in 5XFAD, 5XFAD;Tsc1iKO, 5XFAD;Trem2iKO, and 5XFAD;DualiKO. K, Quantification for Iba1+ microglia soma volume in 5XFAD, 5XFAD;Tsc1iKO, 5XFAD;Trem2iKO, and 5XFAD;DualiKO. L, Quantification for the length of the microglial processes in 5XFAD, 5XFAD;Tsc1iKO, 5XFAD;Trem2iKO, and 5XFAD;DualiKO. M, Quantification in percentage of F-480/Iba1+ cells in 5XFAD, 5XFAD;Tsc1iKO, 5XFAD;Trem2iKO, and 5XFAD;DualiKO. N, Quantification of the number of microglia associated with Aβ plaques, grouped by the sizes of plaques <10, 10–40, and >40 μm from 5XFAD (n = 3M/4F), 5XFAD;Tsc1iKO (n = 5 M/4F), 5XFAD;Trem2iKO (n = 3M/3F), and 5XFAD;DualiKO (n = 3M/3F). Each dot represents the number of microglia associated with one plaque. O, The relative mRNA expression levels of Cathepsin family genes, normalized to the house-keeping gene Gapdh, in all groups including age and sex marched WT controls (white bar, n = 3M/3F). P, The relative mRNA expression levels of Complement family genes, normalized to the house-keeping gene Gapdh, in all groups including age and sex marched WT controls (white bar, n = 3M/3F). Comparisons between genotypes were performed by one-way ANOVA with Tukey's post hoc test; * or #p < 0.05, ** or ##p < 0.01, *** or ###p < 0.001. All data are presented as mean ± SEM.
Figure 6.
Figure 6.
mTOR activation in microglia increases Aβ phagocytosis and clearance. A–D, Representative immunostaining of brain sections from control (+/+), Tsc1iKO and Trem2iKO and DualiKO mice, using anti-Iba1 (blue, a), anti-LAMP1 (red, b), anti-CD68 (green, c), and merged images showed in d. Scale bar: 20 μm. E, Quantification of immunofluorescence intensities of CD68 and LAMP1 in microglia from two-month-old +/+, Tsc1iKO, Trem2iKO, and DualiKO mice (n = 3M/3F for each genotype). F–I, LysoTracker live-cell imaging of primary microglia culture derived from +/+, Tsc1cKO, Trem2cKO, and DualcKO mice (Fx;Cx3cr1-Cre lines) pups, noted as +/+, Tsc1−/−, Trem2 −/−, and Dual −/−, respectively (scale bar: 10 μm). J, Quantification of fluorescence intensities of the LysoTracker Green DND-26 (50 nm) indicator in +/+, Tsc1−/−, Trem2−/−, and Dual−/− primary microglia. A total of 40–50 cells were quantified for each genotype, and experiments were repeated three times. K–N, Cultured microglia from F–I, incubated with FAM-Aβ containing medium for 1 h, followed by removal of FAM-Aβ. Cells were then imaged at 0 min, 30 min, 1 h, and 2 h. Representative images of microglia loaded with FAM-Aβ (green) taken at different time points. Cell nuclei were counterstained with DAPI (blue; scale bar: 10 μm). O, Quantification of FAM-Aβ dye intensities per cell in primary +/+, Tsc1−/−, Trem2−/−, and Dual−/− microglia incubated for time intervals as indicated. A total of 40–50 cells were quantified for each genotype, and experiments were repeated three times. P, Quantification of FAM-Aβ dye intensities per cell in primary +/+, Tsc1−/−, Trem2−/−, and Dual−/− microglia after removal of FAM-Aβ dye to monitor fluorescence clearance over indicated times. A total of 40–50 cells were quantified for each genotype/time point, and experiments were repeated three times. Q–T, Images of microglia with FAM-Aβ dye uptake (green) at 0 min or 1 h after removal of dye, treated with vehicle (DMSO) or CQ for 1 h at 37°C CO2 incubator. Cell nuclei were counterstained with DAPI (blue; scale bar: 10 μm). U, Quantification of FAM-Aβ dye intensities per cell under conditions (Q–T) for primary +/+, Tsc1−/−, Trem2−/−, and Dual−/− microglia cells. For F–I, K–N, and Q–T, microglia cultures were prepared by mixing brain tissues from four to five pups to obtain single-cell suspensions for each genotype. Single-cell suspension was dispensed into four-chamber wells (n = 4) for each time point/condition, and 8–10 random pictures were taken for each well. Comparisons between genotypes were performed by one-way ANOVA with Tukey's post hoc test; * or #p < 0.05, ** or ##p < 0.01, *** or ###p < 0.001. All data are presented as mean ± SEM.
Figure 7.
Figure 7.
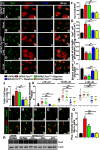
Rapamycin treatment increases Aβ plaque deposition and exacerbates Aβ-related AD pathologies. A, Representative immunoblots showing the expression of mTOR signaling molecules, including pS6K, p4EBP1, p-mTOR, p-AKT, in isolated microglia from WT (n = 1 M/2F) and 5XFAD mouse brain (n = 2 M/1F). APP protein expression was examined (with 6e10 antibody) in brain lysates from the same cohort of WT and 5XFAD mice. Each lane represents lysates from individual animals. B, Experimental design and timeline showing color-coded genotypes with TAM injection at one month followed by rapamycin treatments for one, two, or three months and then phenotypic analysis at six months. C, Representative immunoblots showing the expression of p4EBP1 in isolated microglia from 5XFAD, and 5XFAD;Tsc1iKO mice with various treatment time of rapamycin. D, E, Immunostaining of cortical (D) and hippocampal areas (E) using anti-Aβ (green) and anti-NeuN (red) from 5XFAD (no rapamycin, a), 5XFAD;Tsc1iKO (no rapamycin, b), and 5XFAD;Tsc1iKO with one month (c), two months (d), or three months (e) of rapamycin treatment. Scale bar: 50 μm. F, Number of plaques quantified for cortical and hippocampal areas in genotypes for D, E. G, Aβ plaque size distribution quantified from respective genotypes with or without rapamycin grouped by the size of plaques at <10, 10–40, and >40 μm. H, I, Immunostaining of brain sections from 5XFAD and 5XFAD;Tsc1iKO with the various periods of rapamycin treatment with anti-Aβ antibody (red) and MX04 dye (green), respectively (scale bar: 25 μm). J, Quantification of plaque types as inert, compact, or filamentous in 5XFAD and 5XFAD;Tsc1iKO without or with various periods of rapamycin treatment. K, L, Protein levels of Aβ42 in insoluble, guanidine-HCl-extracted fraction from cortex and hippocampus of 5XFAD (K) or 5XFAD;Tsc1iKO (L) without or with various periods of rapamycin treatment (normalized to total protein levels). For B–L, 5XFAD mice without Rapa (n = 3M/4F), 5XFAD + 1mo Rapa (n = 3M/2F), 5XFAD + 2mo Rapa (n = 3M/3F), 5XFAD + 3mo Rapa (n = 2 M/3F); 5XFAD;Tsc1iKO mice without Rapa (n = 3M/4F), 5XFAD;Tsc1iKO + one month Rapa (n = 3M/3F), 5XFAD;Tsc1iKO + two months Rapa (n = 4 M/4F), 5XFAD;Tsc1iKO + three months Rapa (n = 4 M/5F). Comparisons between genotypes/rapamycin treatment conditions were performed by one-way ANOVA with Tukey's post hoc test; *p < 0.05, **p < 0.01, ***p < 0.001. All data are presented as mean ± SEM.
Figure 8.
Figure 8.
mTOR inhibition by rapamycin alters the activation status of microglia and downregulates Trem2. A–E, Representative immunostaining pictures of brain sections for Iba1 (green), Aβ (red), and F4/80 (blue) from 5XFAD (without rapamycin, A) and 5XFAD;Tsc1iKO without (B) or one month (C), two months (D), and three months (E) of rapamycin treatment (scale bar: 20 μm). F, Quantification of Iba1+ cell numbers in cortex and hippocampus regions in mice shown in A–E color-coded 5XFAD (without rapamycin, black) and 5XFAD;Tsc1iKO without (red) or one month (green), two months (blue), and three months (yellow) of rapamycin treatment. G, Quantification of Iba1+ cell volume in genotypes shown in A–E color-coded 5XFAD (without rapamycin, black) and 5XFAD;Tsc1iKO without (red) or one month (green), two months (blue), and three months (yellow) of rapamycin treatment. H, I, Quantification of the morphologic features showing the length of microglial processes (G) and the number of branch points per microglia (H) in genotypes as in F. J, Percentage of F-480+/Iba1+ cells in genotypes as in F. K, Quantification of microglia associated with plaques, grouped by the sizes of plaques (<10 μm, or between 10 and 40 μm, or >40 μm) in genotypes as in F. L–P, Immunostaining of brain sections for Trem2 (green) and Iba1 (red) from 5XFAD (without rapamycin, L) and 5XFAD;Tsc1iKO without (M) or one month (N), two months (O), and three months (P) of rapamycin treatment. Scale bar: 20 μm. Q, Quantification of Trem2 immunofluorescence against Iba1 in microglia from 5XFAD (without rapamycin) and 5XFAD;Tsc1iKO without or one month, two months, and three months of rapamycin treatment. R, Representative immunoblots of protein levels of Trem2 in microglia from brain lysates of 5XFAD (without rapamycin) and 5XFAD;Tsc1iKO without or one month, two months, and three months of rapamycin treatment. β-Actin was used as the protein loading control. All mice were from the same cohort experiments described in Figure 7. For quantification, 40–50 microglia for each animal were quantified for the morphology analysis and protein fluorescence intensities. For R, microglia were isolated by CD11b+ beads from the same cohort of animals. Comparisons between groups were performed by one-way ANOVA with Tukey's post hoc test; * or #p < 0.05, ** or ##p < 0.01, *** or ###p < 0.001. All data are presented as mean ± SEM.

Similar articles

Cited by

References

    1. Ajami B, Bennett JL, Krieger C, Tetzlaff W, Rossi FM (2007) Local self-renewal can sustain CNS microglia maintenance and function throughout adult life. Nat Neurosci 10:1538–1543. 10.1038/nn2014 - DOI - PubMed
    1. Askew K, Li K, Olmos-Alonso A, Garcia-Moreno F, Liang Y, Richardson P, Tipton T, Chapman MA, Riecken K, Beccari S, Sierra A, Molnár Z, Cragg MS, Garaschuk O, Perry VH, Gomez-Nicola D (2017) Coupled proliferation and apoptosis maintain the rapid turnover of microglia in the adult brain. Cell Rep 18:391–405. 10.1016/j.celrep.2016.12.041 - DOI - PMC - PubMed
    1. Asrani K, Murali S, Lam B, Na CH, Phatak P, Sood A, Kaur H, Khan Z, Noë M, Anchoori RK, Talbot CC Jr, Smith B, Skaro M, Lotan TL (2019) mTORC1 feedback to AKT modulates lysosomal biogenesis through MiT/TFE regulation. J Clin Invest 129:5584–5599. 10.1172/JCI128287 - DOI - PMC - PubMed
    1. Bai B, et al. (2020) Deep multilayer brain proteomics identifies molecular networks in Alzheimer's disease progression. Neuron 105:975–991.e7. - PMC - PubMed
    1. Baik SH, Kang S, Lee W, Choi H, Chung S, Kim JI, Mook-Jung I (2019) A breakdown in metabolic reprogramming causes microglia dysfunction in Alzheimer's disease. Cell Metab 30:493–507.e6. 10.1016/j.cmet.2019.06.005 - DOI - PubMed

Publication types