. 2022 Jun 7;13(1):3293.
doi: 10.1038/s41467-022-30839-x.

Language models can learn complex molecular distributions

Affiliations

Language models can learn complex molecular distributions

Daniel Flam-Shepherd et al. Nat Commun. .

Abstract

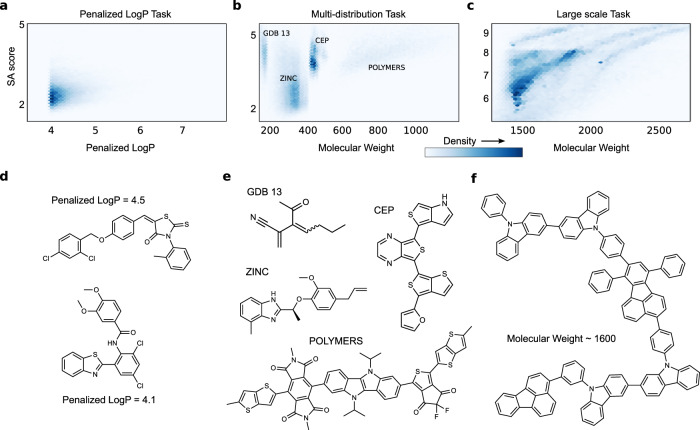
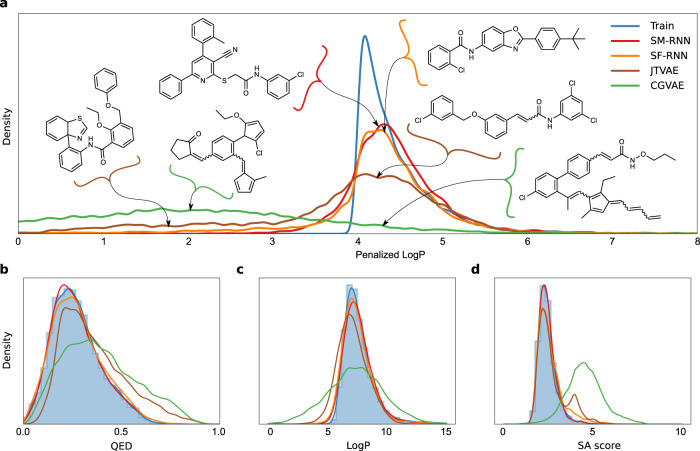
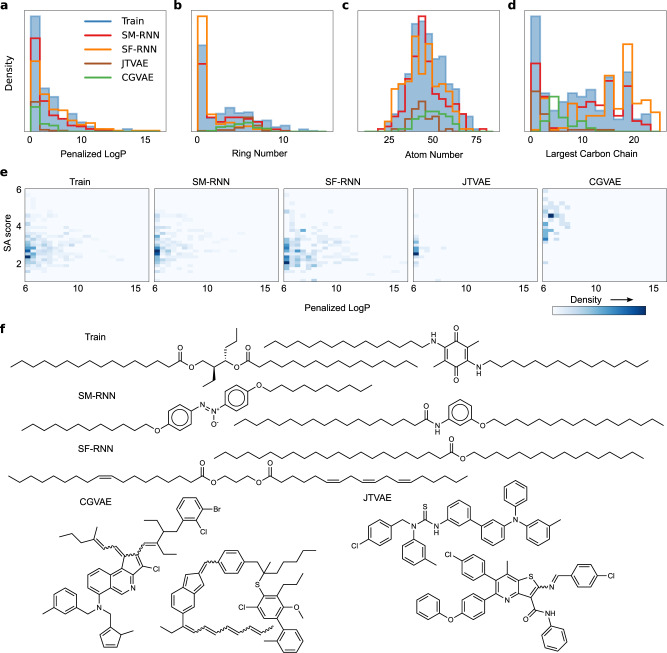
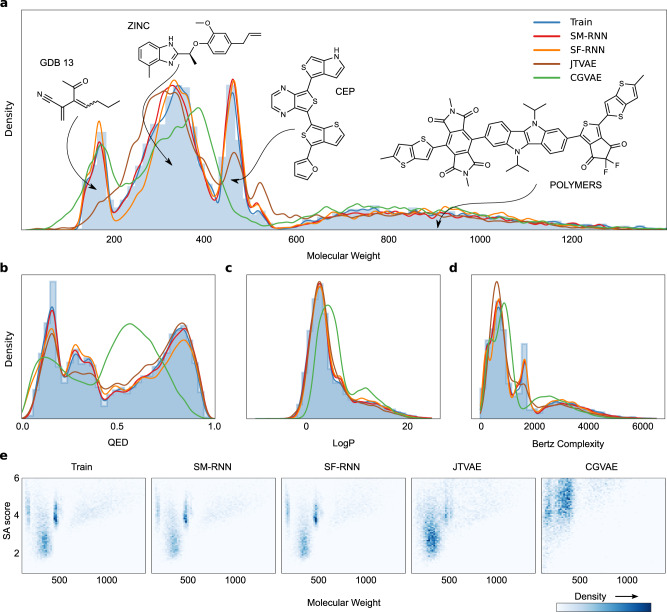
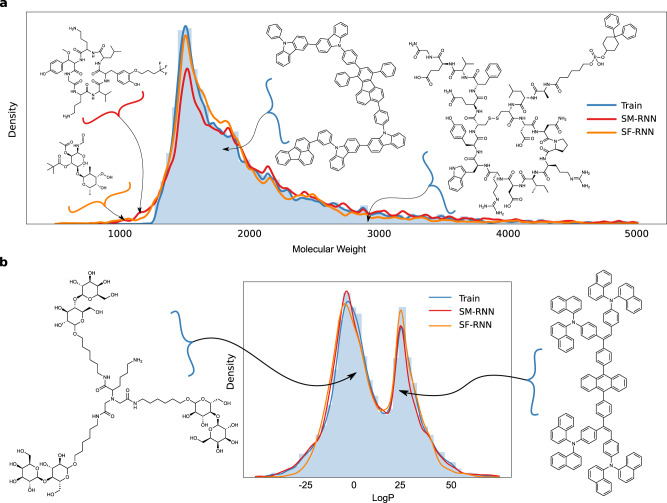
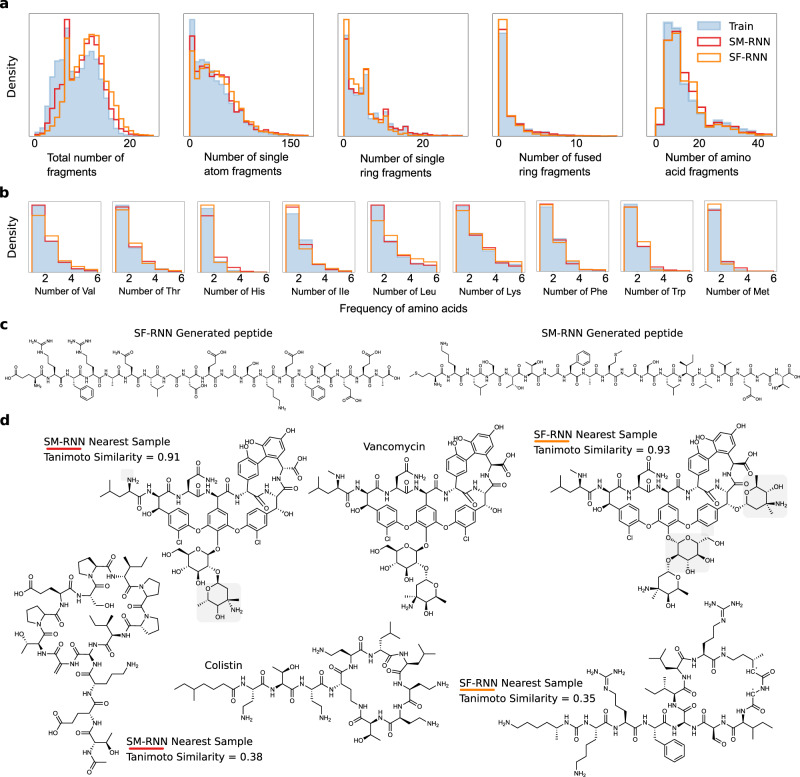
Deep generative models of molecules have grown immensely in popularity, trained on relevant datasets, these models are used to search through chemical space. The downstream utility of generative models for the inverse design of novel functional compounds, depends on their ability to learn a training distribution of molecules. The most simple example is a language model that takes the form of a recurrent neural network and generates molecules using a string representation. Since their initial use, subsequent work has shown that language models are very capable, in particular, recent research has demonstrated their utility in the low data regime. In this work, we investigate the capacity of simple language models to learn more complex distributions of molecules. For this purpose, we introduce several challenging generative modeling tasks by compiling larger, more complex distributions of molecules and we evaluate the ability of language models on each task. The results demonstrate that language models are powerful generative models, capable of adeptly learning complex molecular distributions. Language models can accurately generate: distributions of the highest scoring penalized LogP molecules in ZINC15, multi-modal molecular distributions as well as the largest molecules in PubChem. The results highlight the limitations of some of the most popular and recent graph generative models- many of which cannot scale to these molecular distributions.


Conflict of interest statement

The authors declare no competing interests.

Figures

Fig. 1
Fig. 1. The generative modeling tasks.
ac The molecular distributions defining the three complex molecular generative modeling task. a The distribution of penalized LogP vs. SA score from the training data in the penalized logP task. b The four modes of differently weighted molecules in the training data of the multi-distribution task.c Large scale task’s molecular weight training distribution. df examples of molecules from the training data in each of the generative modeling tasks. d The penalized LogP task, e The multi-distribution task. f The large-scale task.
Fig. 2
Fig. 2. Penalized LogP Task I.
a The plotted distribution of the penalized LogP scores of molecules from the training data (TRAIN) with the SM-RNN trained on SMILES, the SF-RNN trained on SELFIES and graph models: CGVAE and JTVAE. For the graph models we display molecules from the out of distribution mode at penalized LogP score [1.75,2.25] as well as molecules with penalized LogP score in the the main mode [4.0,4.5] from all models. bd Distribution plots for all models and training data of molecular properties QED, LogP, and SA score.
Fig. 3
Fig. 3. Penalized LogP Task II.
ad Histograms of penalized LogP, Atoms #, Ring # and length of largest carbon chain (all per molecule) from molecules generated by all models or from the training data that have penalized LogP ≥ 6.0. e 2d histograms of penalized LogP and SA score from molecules generated by the models or from training data that have penalized LogP ≥ 6.0. f A few molecules generated by all models or from the training data that have penalized LogP ≥ 6.0.
Fig. 4
Fig. 4. Multi-distribution Task.
a The histogram and KDE of molecular weight of training molecules along with KDEs of molecular weight of molecules generated from all models. Three training molecules from each mode are shown. bd The histogram and KDE of QED, LogP and SA scores of training molecules along with KDES of molecules generated from all models. e 2d histograms of molecular weight and SA score of training molecules and molecules generated by all models.
Fig. 5
Fig. 5. Large-scale Task I.
a The histogram and KDE of molecular weight of training molecules along with the KDEs of molecular weight of molecules generated from the RNNs. Two molecules generated by the RNN’s with lower molecular weight than the training molecules are shown on the left of the plot. In addition, two training molecules from the mode and tail of the distribution of molecular weight are displayed on the right. b The histogram and KDE of LogP of training molecules along with the KDEs of LogP of molecules generated from the RNNs. On either side of the plot, for each mode in the LogP distribution, we display a molecule from the training data.
Fig. 6
Fig. 6. Large-scale Task II.
a Histograms of fragment #, single atom fragment #, single ring fragment #, fused-ring fragment #, amino acid fragment # (all per molecule) from molecules generated by the RNN models or from the training data. b Histograms of specific amino acid number in each molecule generated by the RNNs or from the training data. c A peptide generated by the SM-RNN—MKLSTTGFAMGSLIVVEGT (right) and one generated by the SF-RNN—ERFRAQLGDEGSKEFVEEA (left). d Molecules generated by the SF-RNN and SM-RNN that are closest in Tanimoto similarity to colistin and vancomycin. The light gray shaded regions highlight differences from vancomycin.

References

    1. Bohacek RS, McMartin C, Guida WC. The art and practice of structure-based drug design: a molecular modeling perspective. Med. Res. Rev. 1996;16:3. doi: 10.1002/(SICI)1098-1128(199601)16:1<3::AID-MED1>3.0.CO;2-6. - DOI - PubMed
    1. Jumper J, et al. Highly accurate protein structure prediction with alphafold. Nature. 2021;596:583. doi: 10.1038/s41586-021-03819-2. - DOI - PMC - PubMed
    1. Gómez-Bombarelli R, et al. Automatic chemical design using a data-driven continuous representation of molecules. ACS Cent. Sci. 2018;4:268. doi: 10.1021/acscentsci.7b00572. - DOI - PMC - PubMed
    1. Sutskever, I., Martens, J. & Hinton, G. E. Generating text with recurrent neural networks. In International Conference on Machine Learning (2011).
    1. Weininger D. Smiles, a chemical language and information system. 1. introduction to methodology and encoding rules. J. Chem. Inf. Comput. Sci. 1988;28:31. doi: 10.1021/ci00057a005. - DOI

Publication types