. 2022 Jun 7;13(1):3153.
doi: 10.1038/s41467-022-30881-9.

Enhanced BRAF engagement by NRAS mutants capable of promoting melanoma initiation

Affiliations

Enhanced BRAF engagement by NRAS mutants capable of promoting melanoma initiation

Brandon M Murphy et al. Nat Commun. .

Abstract

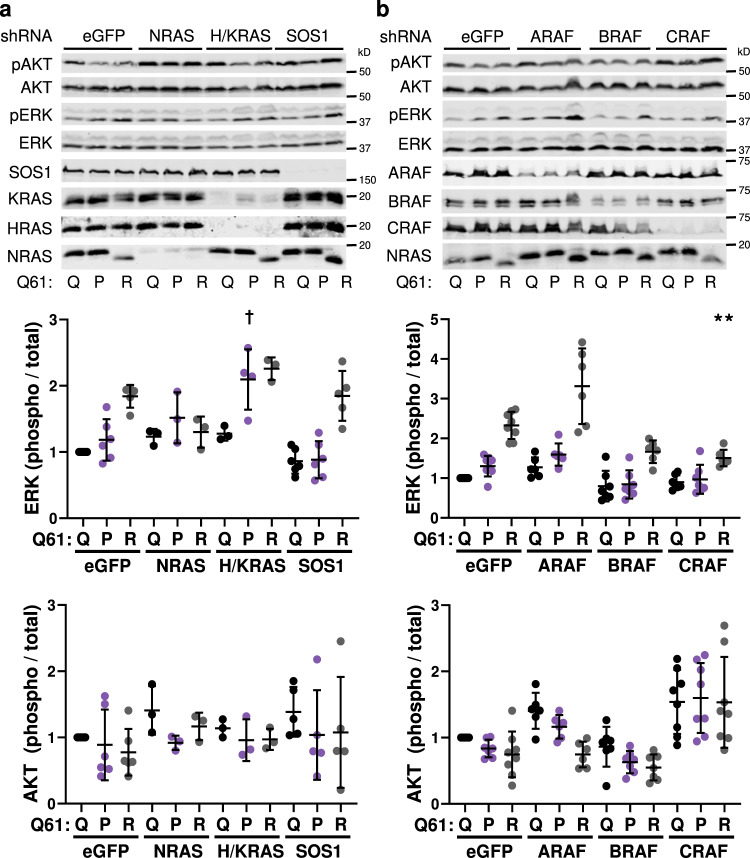
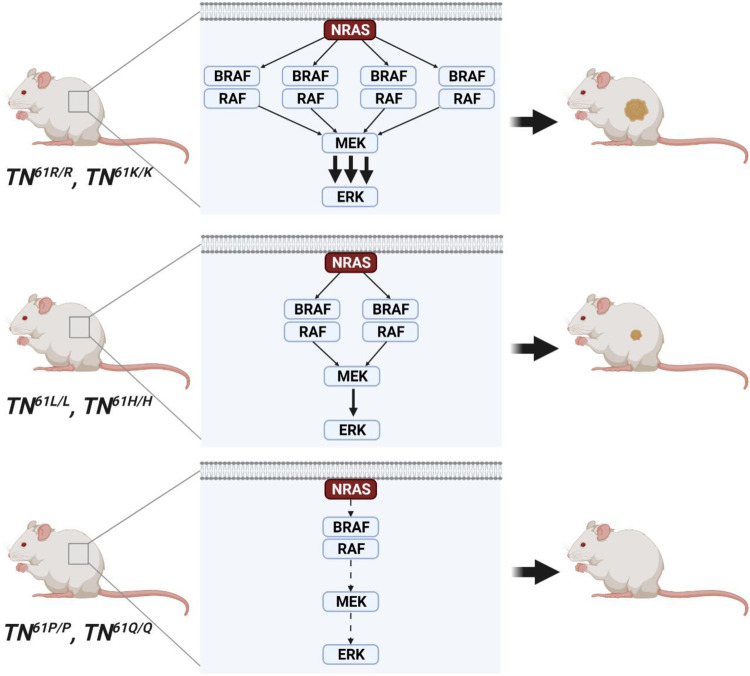
A distinct profile of NRAS mutants is observed in each tumor type. It is unclear whether these profiles are determined by mutagenic events or functional differences between NRAS oncoproteins. Here, we establish functional hallmarks of NRAS mutants enriched in human melanoma. We generate eight conditional, knock-in mouse models and show that rare melanoma mutants (NRAS G12D, G13D, G13R, Q61H, and Q61P) are poor drivers of spontaneous melanoma formation, whereas common melanoma mutants (NRAS Q61R, Q61K, or Q61L) induce rapid tumor onset with high penetrance. Molecular dynamics simulations, combined with cell-based protein-protein interaction studies, reveal that melanomagenic NRAS mutants form intramolecular contacts that enhance BRAF binding affinity, BRAF-CRAF heterodimer formation, and MAPK > ERK signaling. Along with the allelic series of conditional mouse models we describe, these results establish a mechanistic basis for the enrichment of specific NRAS mutants in human melanoma.


Conflict of interest statement

C.E.B. and B.M.M. are inventors of TN61 cell lines licensed to Millipore. All other authors declare no competing interests.

Figures

Fig. 1
Fig. 1. Frequency of NRAS mutants in human melanoma parallels tumorigenic potential in mice.
a Frequency of NRAS mutations in the TCGA PanCancer Atlas dataset for human cutaneous melanoma. Melanoma-free survival (b), total tumor burden (c), and tumor growth rates (d) for mice expressing the indicated melanocyte-specific NRAS mutants. Tumor burden and growth rate data are presented as mean values +/− SD. The following number biologically independent animals were evaluated per genotype (61R = 72, 61K = 19, 61L = 17, 61H = 17, 61P = 16, 61Q = 22). Log-rank (Mantel–Cox) (b) or ANOVA (c, d) with a Tukey’s multiple comparisons test was used to compare measurements between each genotype. TNX/X samples statistically different from TN61R/R are indicated in the figure. Adjusted p-values for all comparisons can be found in Supplementary Table 1a. * p < 0.05, ** p < 0.01, ‡ p < 0.0001. Source data are provided as a Source Data file.
Fig. 2
Fig. 2. Combining codon 61 mutants defective in GTPase activity results in an intermediate melanoma phenotype.
Melanoma-free survival, overall survival, tumor burden, and tumor growth rates for the following treatment cohorts: a TN61K/R, b TN61L/R, c TN61H/R, d TN61P/R, and e TN61Q/R. Tumor burden and growth rate dot plots are presented as mean values +/− SD. The following number biologically independent animals were evaluated per genotype (61K cohort: R/R = 12, K/R = 19, K/K = 19; 61L cohort: R/R = 13, L/R = 17, L/L = 17; 61H cohort: R/R = 16, H/R = 16, H/H = 17; 61P cohort: R/R = 13, P/R = 20, P/P = 16; 61Q cohort: R/R = 18, Q/R = 21, Q/Q = 22). In ae, the phenotype of TN61R/R mice was compared to TN61X/X and TN61X/R animals. Log-rank (Mantel–Cox) tests were used to compare survival. One-way ANOVA with a Dunnet T3 multiple comparisons test was used to compare tumor burden and growth between each genotype and TN61R/R for that cohort. Adjusted p-values for all comparisons can be found in Supplementary Table 1f. * p < 0.05, ** p < 0.01, ‡ p < 0.0001. Source data are provided as a Source Data file.
Fig. 3
Fig. 3. Differential regulation of the RAS-Myc axis by melanomagenic and non-melanomagenic NRAS mutants.
a Dot plots representing the molecular functions subset of Gene Ontology (GO) analysis of genes upregulated (left) or downregulated (right) in TN61R/R and TN61H/H MEFs compared to TN61P/P MEFs. Three biological replicates per genotype were used for analyzed. Bar plot showing the differential enrichment of Hallmark gene sets (p-adjusted < 0.05) in MEFs expressing NRAS61R/R versus NRAS61P/P (b) or NRAS61H/H versus NRAS61P/P (c). d Dot plot of flow cytometric analysis of EdU labeling in NRAS-mutant MEFs. n = 4 biologically independent MEF lines per genotype were examined over 4 independent experiments. e Representative image of EdU (proliferation, green) and gp100 (melanocyte, red) co-staining in skin harvested from a ten-day old mouse. n = 4 biologically independent mice were examined per genotype. f Dot plot of percent EdU positivity in melanocytes from 10-day old TN61X/X mouse skin. The following number biologically independent animals were evaluated per genotype (K/K = 5, L/L = 4, H/H = 4, P/P = 3). Dot plot data are presented as mean values +/− SD where each dot represents one biological replicate. One-way ANOVA with a Tukey’s post-test was used to compare data between each genotype. NRAS mutant samples statistically different from NRAS61R/R samples are indicated in the figure. Adjusted p-values for all comparisons can be found in Supplementary Table 2. * p < 0.05, † p < 0.001. Source data are provided as a Source Data file.
Fig. 4
Fig. 4. MAPK pathway activation parallels the tumorigenic potential of oncogenic NRAS mutant.
Immunoblot of protein lysates isolated from MEFs (a) or murine melanomas (b) expressing the indicated NRAS mutants. Dot plots showing the quantification of ERK activation, AKT activation, or NRAS expression. Dot plot data are presented as mean values +/− SD where each dot represents one biological replicate. For a following number biologically independent replicates per genotype were examined over nine independent experiments (Q/Q = 9, R/R = 9, K/K = 7, L/L = 7, H/H = 9, P/P = 9). For b nine biologically independent replicates were assessed per genotype. One-way ANOVA with a Tukey’s post-test was used to compare data between each genotype. NRAS mutant samples statistically different from NRAS61R/R samples are indicated in the figure. Adjusted p-values for all comparisons can be found in Supplementary Table 3a. * p < 0.05, ** p < 0.01, † p < 0.001. Source data are provided as a Source Data file.
Fig. 5
Fig. 5. Oncogenic NRAS mutants mediate differential MAPK activation via a RAF-dependent mechanism.
Representative immunoblots of AKT and ERK activation in homozygous MEF cell lines treated with shRNAs targeting Nras, Hras and Kras, or Sos1 (a) or Araf, Braf or Craf (b). Dot plot data are presented as mean values +/− SD where each dot represents one biological replicate. For a the following biologically independent replicates per genotype were examined over five independent experiments (eGFP arm: Q = 5, P = 5, R = 5; NRAS arm: Q = 3, P = 3, R = 3; H/KRAS arm: Q = 3, P = 4, R = 3; SOS1 arm: Q = 5, P = 5, R = 5). For b the following biologically independent replicates per genotype were examined over 8 independent experiments (eGFP arm: Q = 8, P = 8, R = 8; ARAF arm: Q = 6, P = 6, R = 6; BRAF arm: Q = 7, P = 7, R = 6; CRAF arm: Q = 7, P = 7, R = 6). Adjusted p-values were generated using a one-way ANOVA with a Tukey’s multiple comparisons test. Statistics denoted in the figure indicate significant differences between shRNA-treated NRAS mutant MEFs and their respective eGFP control. ** p < 0.01, † p < 0.001. A complete list of adjusted p-values can be found in Supplementary Table 4a, b. Source data are provided as a Source Data file.
Fig. 6
Fig. 6. Melanomagenic NRAS mutants enhance RAF dimerization.
a Schematic representation of the RAF NanoBiT assay in which each RAF isoform is tagged with either LgBiT or SmBiT. Dot plots of normalized luminescence intensity in TN61X/X MEFs infected with adenovirus expressing BRAF-LgBiT and BRAF-SmBiT (b), BRAF-LgBiT and Craf-SmBiT (c), CRAF-LgBiT and CRAF-SmBiT (d), ARAF-LgBiT and BRAF-SmBiT (e), ARAF-LgBiT and ARAF-SmBiT (f), or ARAF-LgBiT and CRAF-SmBiT (g). Luminescence intensity was normalized to crystal violet staining for each well. Dot plot data are presented as mean values +/− SD where each dot represents one biological replicate. The following biologically independent replicates per genotype were examined over five independent experiments (BRAF-BRAF: Q/Q = 5, R/R = 5, H/H = 4; P/P = 4; BRAF-CRAF: Q/Q = 5, R/R = 5, H/H = 4; P/P = 5; CRAF-CRAF: Q/Q = 5, R/R = 5, H/H = 4; P/P = 4; BRAF-ARAF: Q/Q = 4, R/R = 4, H/H = 4; P/P = 4; ARAF-ARAF: Q/Q = 4, R/R = 4, H/H = 4; P/P = 4; ARAF-CRAF: Q/Q = 4, R/R = 4, H/H = 4; P/P = 4). One-way ANOVA with a Tukey’s post-test was used to compare data between each genotype. NRAS mutant samples statistically different from NRAS61R/R samples are indicated in the figure. Adjusted p-values for all comparisons can be found in Supplementary Table 4d. * p < 0.05, ** p < 0.01, † p < 0.001, ‡ p < 0.0001. Source data are provided as a Source Data file.
Fig. 7
Fig. 7. Conformational changes induced by NRAS mutants alter BRAF binding affinity.
a Representative conformations of NRAS61R, NRAS61K, and NRAS61P extracted from their highly populated replica-exchange molecular dynamics (REMD) structural ensembles. Interactions with the codon 61 sidechain are listed below each structure. b Binding orientation of NRAS61R and NRAS61P with the BRAF-RBDCRD as generated using Hex molecular docking simulations. The average conformation representing highly populated structural ensembles extracted from each NRAS codon 61 mutant trajectory was docked against the BRAF-RBDCRD. In the cartoon representation, the NRAS codon 61 mutant and bound nucleotide are shown in licorice, the BRAF-RBDCRD in gray and polar interactions for each mutant, and its surrounding residues are indicated by blue dashed lines. Comparisons of the interaction energy and the number of contacts between the BRAF-RBDCRD and each NRAS mutant suggest that highly melanomagenic NRAS mutants (NRAS61R, NRAS61K) bind BRAF with higher affinity than NRAS61H, NRAS61L, and NRAS61P. The number of autoinhibitory contacts relieved by NRAS mutant binding is listed in parentheses. BRET protein–protein interaction data from Venus-tagged NRAS mutant and Rluc8-tagged BRAF (c) or CRAF (d) constructs co-transfected into 293T cells at increasing receptor to donor ratios. The data shown are representative of two replicates. Best fit BRET50 values (binding affinity) and standard error, determined by non-linear regression, are shown for each mutant. Bolded values indicate statistically significant values as compared to both NRAS61H and NRAS61P. p-values determined by t-tests with 20 degrees of freedom representing the number of measures per curve. Source data are provided as a Source Data file.
Fig. 8
Fig. 8. Differential RAF engagement explains variances in the ability of oncogenic NRAS mutants to initiate melanoma formation.
Image created with BioRender.com.

References

    1. Dogan S, et al. Molecular epidemiology of EGFR and KRAS mutations in 3026 lung adenocarcinomas: Higher susceptibility of women to smoking-related KRAS-mutant cancers. Clin. Cancer Res. 2012;18:6169–6177. doi: 10.1158/1078-0432.CCR-11-3265. - DOI - PMC - PubMed
    1. Hodis E, et al. A landscape of driver mutations in melanoma. Cell. 2012;150:251–263. doi: 10.1016/j.cell.2012.06.024. - DOI - PMC - PubMed
    1. Lu S, Jang H, Nussinov R, Zhang J. The structural basis of oncogenic mutations G12, G13, and Q61 in small GTPase K-Ras4B. Sci. Rep. 2016;6:21949. doi: 10.1038/srep21949. - DOI - PMC - PubMed
    1. Cespedes M, et al. K-ras Asp12 mutant neither interacts with Raf, nor signals through Erk and is less tumorigenic than K-ras Val12. Carcinogenesis. 2006;27:2190–2200. doi: 10.1093/carcin/bgl063. - DOI - PubMed
    1. Hobbs GA, et al. Atypical KRASG12R mutant is impaired in PI3K signaling and macropinocytosis in pancreatic cancer. Cancer Discov. 2020;10:104–123. doi: 10.1158/2159-8290.CD-19-1006. - DOI - PMC - PubMed

Publication types