. 2022 Jun 7;13(1):3147.
doi: 10.1038/s41467-022-30924-1.

Cell fate roadmap of human primed-to-naive transition reveals preimplantation cell lineage signatures

Affiliations

Cell fate roadmap of human primed-to-naive transition reveals preimplantation cell lineage signatures

Yan Bi et al. Nat Commun. .

Abstract

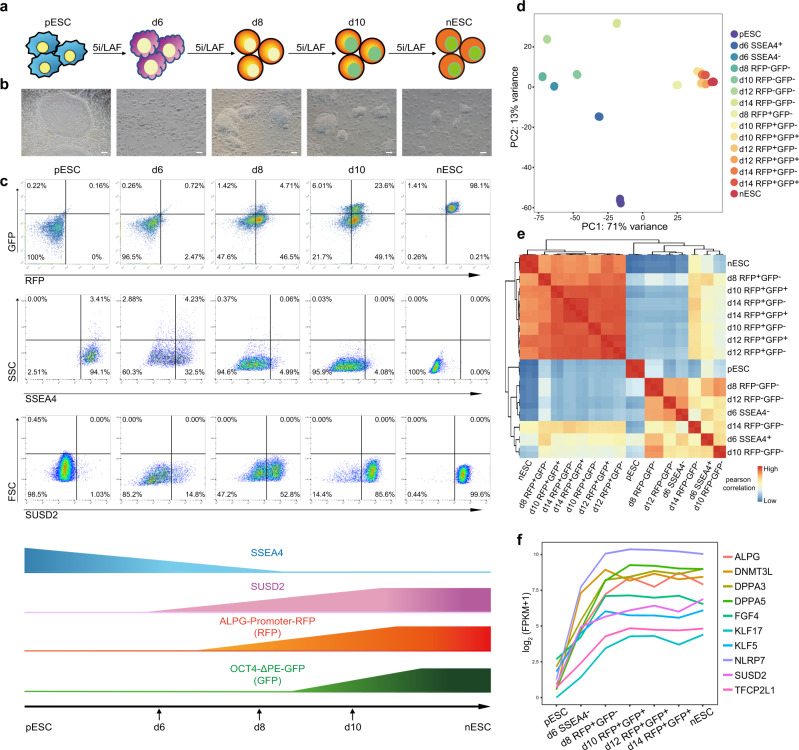
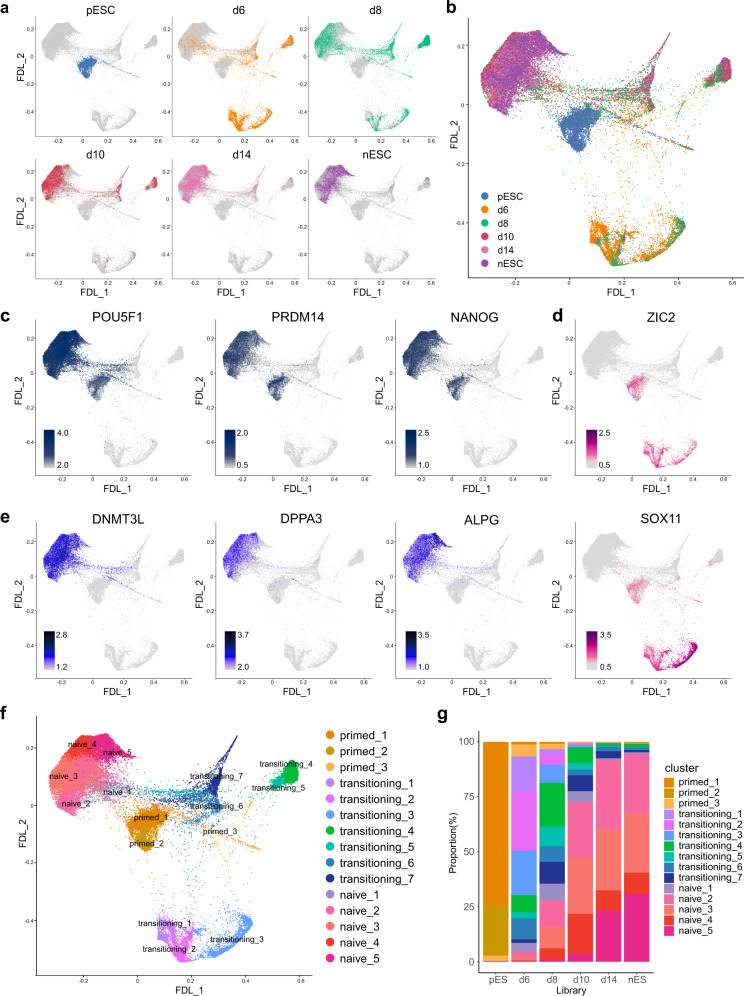
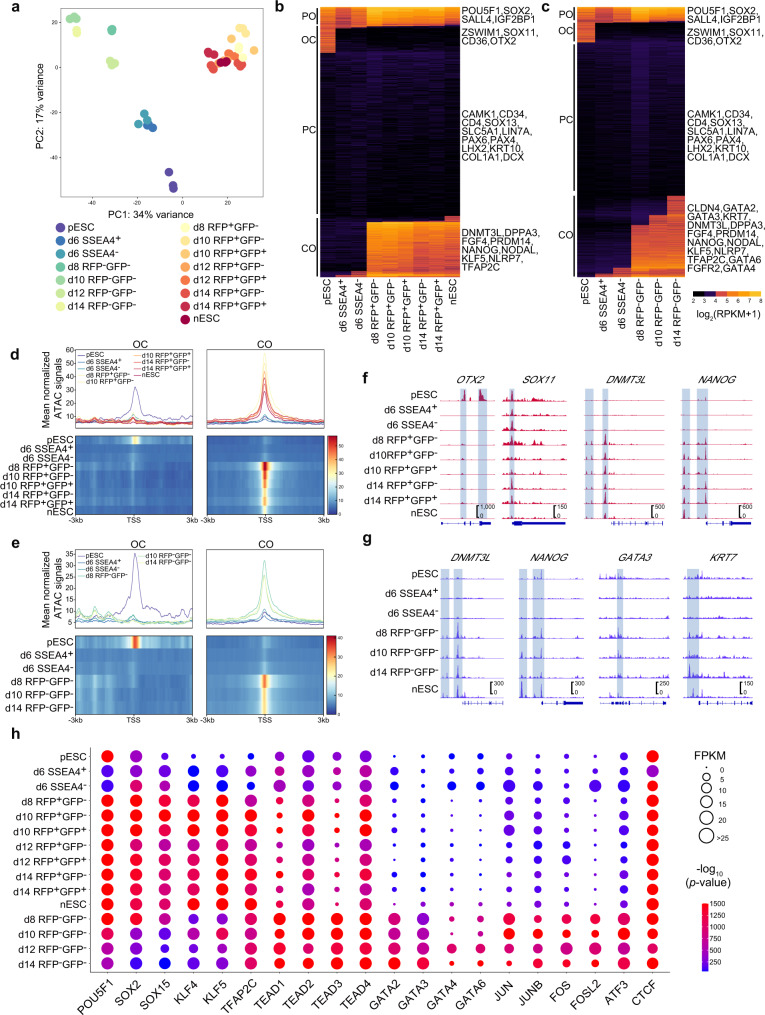
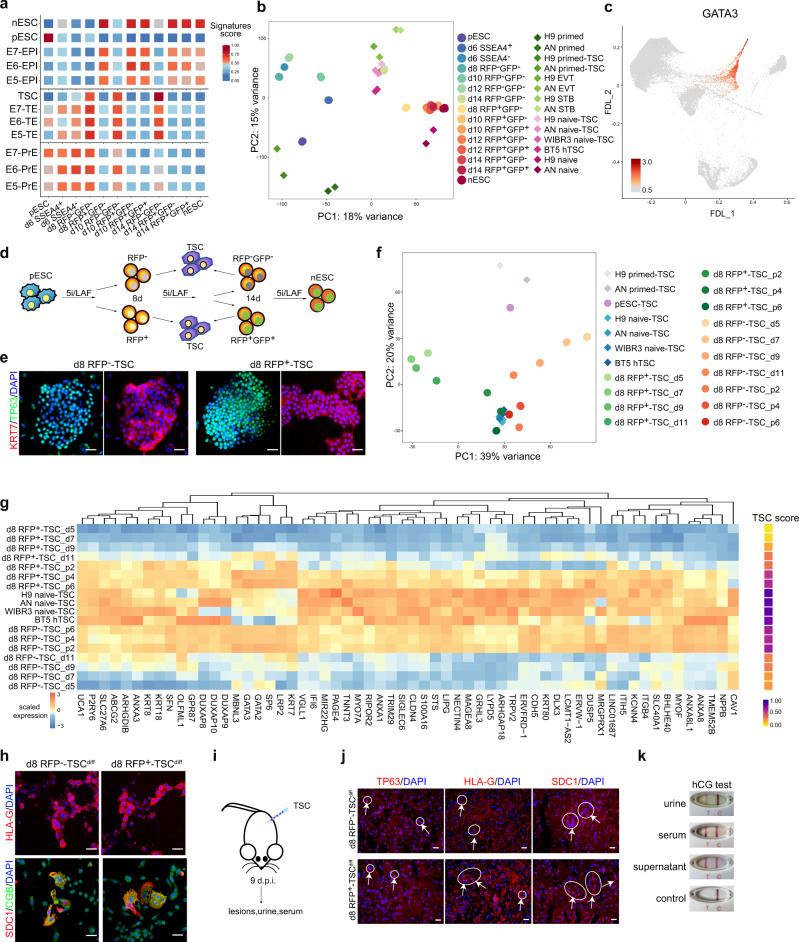
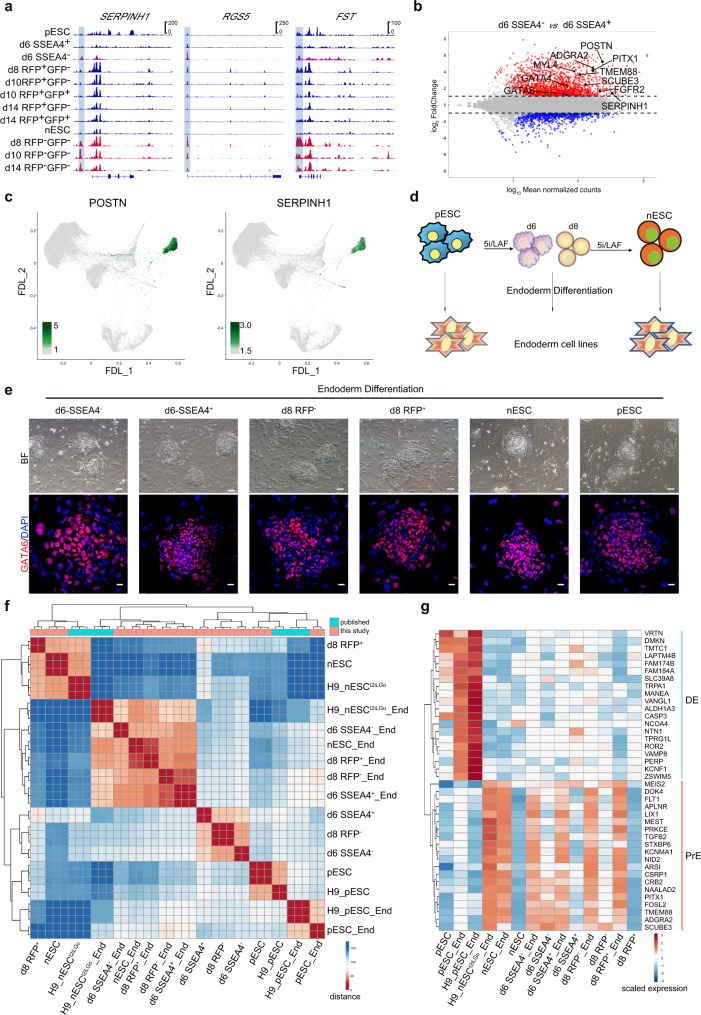
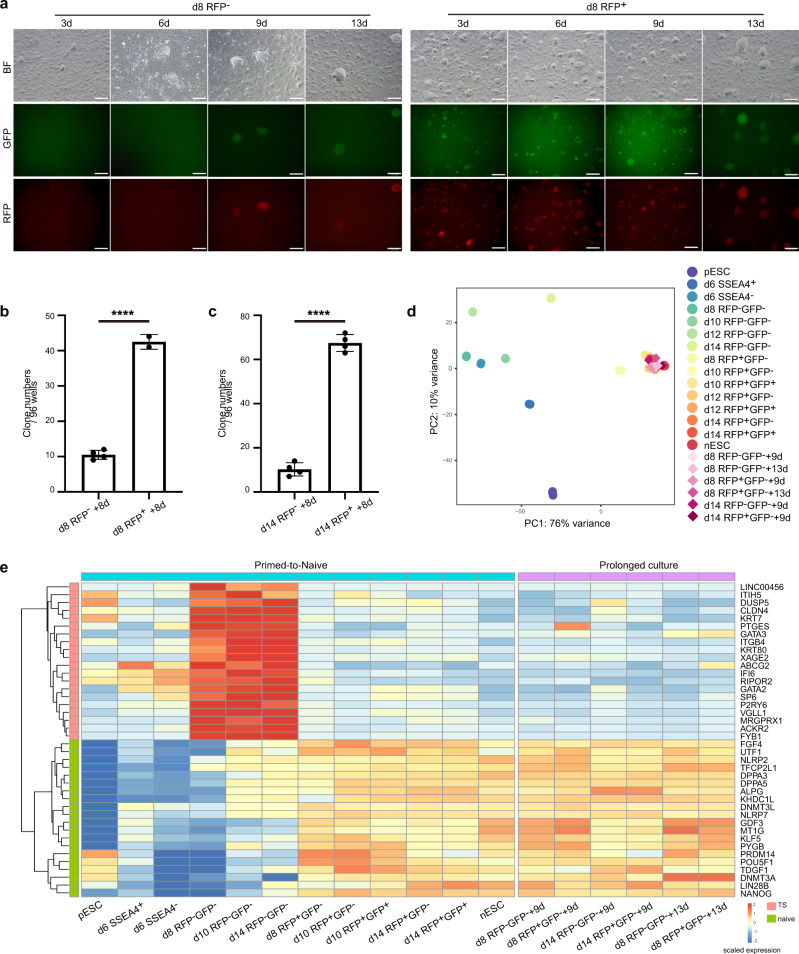
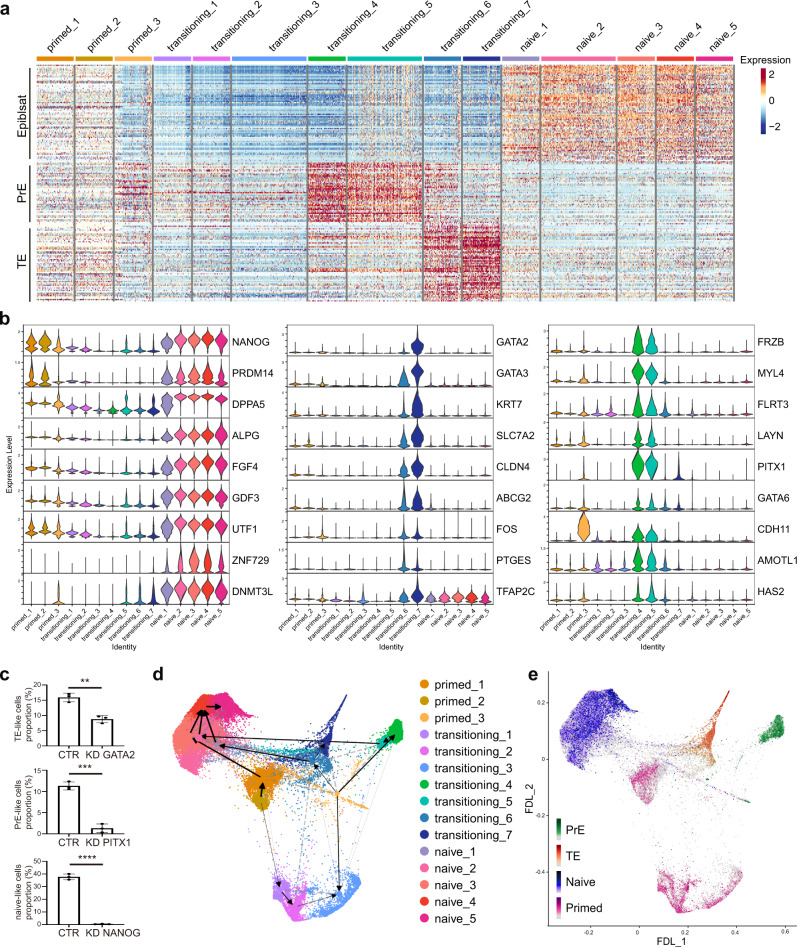
Human naive pluripotent stem cells offer a unique window into early embryogenesis studies. Recent studies have reported several strategies to obtain cells in the naive state. However, cell fate transitions and the underlying mechanisms remain poorly understood. Here, by a dual fluorescent reporter system, we depict the cell fate dynamics from primed state toward naive pluripotency with ALPG activation followed by the activation of OCT4-distal enhancer. Integration of transcription profiles and the chromatin accessibility landscape reveals the appearance of primitive endoderm and trophectoderm signatures in the transitioning subpopulations, with the capacities for derivation of extra-embryonic endoderm and trophoblast stem cell lines, respectively. Furthermore, despite different fluorescent dynamics, all transitioning intermediates are capable of reaching the naive state with prolonged induction, showing their developmental plasticity and potential. Overall, our study describes a global cell roadmap toward naive pluripotency and provides hints for embryo modeling-related studies.


Conflict of interest statement

The authors declare no competing interests.

Figures

Fig. 1
Fig. 1. Transcriptional roadmaps for intermediates with fluorescence dynamics during the primed-to-naive transition process.
a Schematic representation of the primed-to-naive transition using 5iLAF culture conditions. b Morphological changes of cells during the primed-to-naive transition. Scale bars, 50 μm. Representative images from n = 5. c Dynamics of SSEA4, SUSD2, ALPG-promoter-RFP, and OCT4-ΔPE-GFP signals during the primed-to-naive transition process as determined by flow cytometry analysis. d PCA analysis of the bulk RNA-seq datasets collected from the primed-to-naive transition process. n ≥ 2. e Heatmap to indicate the Pearson correlation coefficients among bulk RNA-seq datasets. f Line plots showing the dynamics of representative naive-specific gene expression during the primed-to-naive transition. Source data are provided as a Source Data file.
Fig. 2
Fig. 2. Single-cell transcriptome profiling during the primed-to-naive transition.
a FDL highlighting cells within each time point or library. b FDL of the integrated scRNA-seq datasets (a total of 38,036 cells) with different libraries highlighted. ce Expression of marker genes associated with shared pluripotency, POU5F1, PRDM14, NANOG (c, gray-blue); primed pluripotency,ZIC2, SOX11 (d, pink); naive pluripotency, DNMT3L, DPPA3, ALPG (e, blue) on FDL. f Cell clustering projection on FDL dimensionality reduction, total 15 clusters. g Bar plot showing cell clusters proportions of different libraries in (f). Source data are provided as a Source Data file.
Fig. 3
Fig. 3. Chromatin accessibility dynamics during the primed-to-naive transition.
a PCA of ATAC-seq datasets of the intermediate cells collected at different time points during the primed-to-naive transition process. n ≥ 2. b Chromatin loci arranged into groups according to closed or open status during the putative consecutive stages toward naive pluripotency. Representative genes are noted for each subgroup on the right side. CO closed to open, OC open-to-closed, PO permanently open, and PC permanently closed. c Chromatin loci arranged into groups according to closed or open status within the cells remaining RFP-negative. Representative genes are noted for each subgroup on the right side. CO closed to open, OC open-to-closed, PO permanently open, and PC permanently closed. de Profiles and heatmaps of ATAC signal on gene promoter regions (TSS ± 3 kb) within OC and CO groups in Fig. 2b (d) and Fig. 2c (e). fg Representative ATAC-seq tracks for the OC and CO peaks of intermediates during the primed-to-naive transition. OTX2 and SOX11, primed state-specific markers; DNMT3L and NANOG, naive state-specific markers; GATA3 and KRT7, trophectoderm (TE)-specific markers. h Motif enrichment analysis of TFs. Colors and sizes represent motif enrichment (−log (p value)) and expression values (FPKM), respectively (n = 3 biologically independent samples). Source data are provided as a Source Data file.
Fig. 4
Fig. 4. TE signatures during the primed-to-naive transition.
a EPI, TE, PrE and trophoblast stem cell (TSC) signature scores of the primed-to-naive transitioning intermediates. b PCA of the bulk RNA-seq datasets (circles) from the primed-to-naive transitioning intermediates with published RNA-seq (diamonds) datasets. n ≥ 2. c Expression of GATA3 in FDL. d Experimental design for the induction of TSCs from the primed-to-naive intermediates. e TP63 and KRT7 immunostaining of TSCs derived from day 8 RFP and day 8 RFP+ cells during the primed-to-naive transition. Scale bars, 20 μm. Representative images from n = 3. f PCA of the bulk RNA-seq datasets (circles) from the transitioning intermediates-derived TSCs with published RNA-seq (diamonds) datasets. n ≥ 2. g Heatmap (left) and TSC score (right) showing the expression levels of representative TSC-related genes during the TSC derivation process from RFP and RFP+ transitioning intermediates on day 8. Source data are provided as a Source Data file. h HLA-G, SDC1 and CGB immunostaining of extravillous trophoblast (EVT) (upper) and syncytiotrophoblast (ST) (lower) cells, respectively. EVT and ST cells were differentiated from day 8-RFP and day 8-RFP+ cell-derived TSCs. Scale bar, 20 μm. Representative images from n = 3. i Representation of day 8-RFP and day 8 RFP+ cell-derived TSC engraftment assay by injection into NOD-SCID mice. j Immunostaining of TP63, HLA-G and SDC1 in the lesions collected from day 8-RFP and day 8 RFP+ cell-derived TSC engrafts in NOD-SCID mice. No lesions were evident in the vehicle controls. Scale bar, 20 μm. Representative images from n = 3. k Representative positive results for the hCG pregnancy test performed on urine samples, serum samples, and ST cell culture supernatant collected from day 8-RFP cell -derived TSCs. Source data are provided as a Source Data file.
Fig. 5
Fig. 5. PrE signatures during the primed-to-naive transition.
a ATAC-seq tracks showing the chromatin landscape of representative PrE-related genes in intermediate cells during the primed-to-naive transition. b MAplot of bulk RNA-seq datasets for comparing SSEA4 cells with SSEA4+ cells on day 6 during the primed-to-naive transition with the differentially expressed (DE) genes highlighted. |log2FC | ≥ 1, adjusted p value < 0.01 (n = 3 biologically independent samples). c Expression of POSTN and SERPINH1 (marker gene of the PrE layer) as determined by FDL. d Experimental design for the induction of embryonic endoderm cell lines from the primed-to-naive intermediates following the reported protocol. e Representative images (upper panels) and immunostaining (lower panels) showing the morphologies and GATA6 expression of endoderm cell lines derived from day6-SSEA4 cells, day 6-SSEA4+ cells, day8 RFP- cells, day8 RFP+ cells, pESCs and nESCs. Scale bar (upper panels 50 μm, lower panels 20 μm). Representative images from n = 3. f Heatmap to indicate the samples distance among bulk RNA-seq datasets of endoderm cell lines derived from day6-SSEA4 cells, day 6-SSEA4+ cells, day8 RFP- cells, day8 RFP+ cells, pESCs and nESCs with published RNA-seq datasets, n ≥ 2. g Heatmap showing the expression levels of representative DE and PrE-related genes of endoderm cell lines derived from day6-SSEA4 cells, day 6-SSEA4+ cells, day8 RFP- cells, day8 RFP+ cells, pESCs, nESCs and published endoderm cells. Source data are provided as a Source Data file.
Fig. 6
Fig. 6. Prolonged induction of the RFP- intermediates transitioning toward naive pluripotency.
a Morphological changes and fluorescent dynamics during prolonged 5iLAF culture of day 8-RFP cells (left) and day 8-RFP+ cells (right) from the primed-to-naive transition. Scale bar, 100 μm. Representative images from n = 5. b Statistical analysis of RFP+GFP+ colony numbers during prolonged 5iLAF culture of day 8-RFP cells and day 8-RFP+ cells from the primed-to-naive transition. 96-well plates (one cell/well) were counted (n = 4 and n = 2 biologically independent experiments respectively). ****p < 0.0001 (p = 2.5e−07), two-tailed Student’s t test. The error bars indicate the SD. Source data are provided as a Source Data file. c Statistical analysis of RFP+GFP+ colony numbers during prolonged 5iLAF culture of day 14-RFP cells and day 14-RFP+ cells from the primed-to-naive transition. 96-well plates (one cell/well) were counted (n = 4 biologically independent experiments). ****p < 0.0001 (p = 7.9e−07), two-tailed Student’s t test. The error bars indicate the SD. Source data are provided as a Source Data file. d PCA analysis of the bulk RNA-seq datasets (diamonds) from prolonged 5iLAF culture with the primed-to-naive transition intermediates (circles) datasets. n ≥ 2. e Expression dynamics of representative naïve pluripotency-related genes and TSC specific genes in subpopulations during the primed-to-naïve transition process. Source data are provided as a Source Data file.
Fig. 7
Fig. 7. Cell fate roadmap of the primed-to-naive transition process.
a Heatmap showing EPI, PrE and TE signatures in different cell clusters during the primed-to-naive transition. b Violin plots of representative naïve state-, TE-, and PrE-related genes in the 15 clusters classified in (a). c Statistical comparison of TE-, PrE- and naive-like cells proportions before and after knockdown of key branching-dependent transcription factors identified in (b) (n = 3 biologically independent experiments). **p < 0.01 (p = 0.0026), ***p < 0.001 (p = 0.0002), ****p < 0.0001 (p = 8.7e−06), two-tailed Student’s t test. CTR: control group, KD knockdown group. The error bars indicate the SD. Source data are provided as a Source Data file. d Directed PAGA-Velocity graph with PAGA connectivities (dashed) and transitions (solid/arrows) in a FDL. e Strength of naive (ALPG), primed (ZIC2), TE (GATA3) and PrE (SERPINH1) signatures in FDL.

Similar articles

Cited by

References

    1. Huang K, Maruyama T, Fan G. The naive state of human pluripotent stem cells: a synthesis of stem cell and preimplantation embryo transcriptome analyses. Cell Stem Cell. 2014;15:410–415. doi: 10.1016/j.stem.2014.09.014. - DOI - PMC - PubMed
    1. Pera MF. In search of naivety. Cell Stem Cell. 2014;15:543–545. doi: 10.1016/j.stem.2014.10.013. - DOI - PubMed
    1. Nichols J, Smith A. Naive and primed pluripotent states. Cell Stem Cell. 2009;4:487–492. doi: 10.1016/j.stem.2009.05.015. - DOI - PubMed
    1. Hackett JA, Surani MA. Regulatory principles of pluripotency: from the ground state up. Cell Stem Cell. 2014;15:416–430. doi: 10.1016/j.stem.2014.09.015. - DOI - PubMed
    1. Yang Y, et al. Naive Induced Pluripotent Stem Cells Generated From beta-Thalassemia Fibroblasts Allow Efficient Gene Correction With CRISPR/Cas9. Stem Cells Transl. Med. 2016;5:8–19. doi: 10.5966/sctm.2015-0157. - DOI - PMC - PubMed

Publication types