. 2022 Jun 7;13(1):3258.
doi: 10.1038/s41467-022-30956-7.

Integrating 3D genomic and epigenomic data to enhance target gene discovery and drug repurposing in transcriptome-wide association studies

Affiliations

Integrating 3D genomic and epigenomic data to enhance target gene discovery and drug repurposing in transcriptome-wide association studies

Chachrit Khunsriraksakul et al. Nat Commun. .

Abstract

Transcriptome-wide association studies (TWAS) are popular approaches to test for association between imputed gene expression levels and traits of interest. Here, we propose an integrative method PUMICE (Prediction Using Models Informed by Chromatin conformations and Epigenomics) to integrate 3D genomic and epigenomic data with expression quantitative trait loci (eQTL) to more accurately predict gene expressions. PUMICE helps define and prioritize regions that harbor cis-regulatory variants, which outperforms competing methods. We further describe an extension to our method PUMICE +, which jointly combines TWAS results from single- and multi-tissue models. Across 79 traits, PUMICE + identifies 22% more independent novel genes and increases median chi-square statistics values at known loci by 35% compared to the second-best method, as well as achieves the narrowest credible interval size. Lastly, we perform computational drug repurposing and confirm that PUMICE + outperforms other TWAS methods.


Conflict of interest statement

The authors declare no competing interests.

Figures

Fig. 1
Fig. 1. Simulation studies comparing the performance of PUMICE to other TWAS methods.
Panels (a, b) illustrates the comparison of PUMICE to other single-tissue TWAS methods for type I error (a) and power (b). Panels (c, d) illustrates the comparison of PUMICE to multi-tissue TWAS method (UTMOST) for type I error (c) and power (d). For UTMOST, we evaluate its performance across different combinations of genetic correlation between causal and correlated tissues (ρ) and number of correlated tissues (Ncorr). Shadings represent different training sample sizes used to train gene expression prediction models for single-tissue TWAS methods and ρ/Ncorr combinations for multi-tissue TWAS method.
Fig. 2
Fig. 2. Comparison of PUMICE gene expression prediction models to other TWAS methods.
In panel (a), we compare the number of PUMICE significant models to other TWAS methods, including PrediXcan, FUSION, TIGAR, and UTMOST, across 48 GTEx tissues. Across all scenarios, PUMICE achieves higher number of significant models than those of other single-tissue TWAS methods. In comparison to UTMOST, PUMICE achieves comparable number of models in small sample size tissues, but achieves higher number of models in large sample size tissues. In panel (b), we illustrate the percent increase in significant models between PUMICE and other TWAS methods. Comparing to other single tissue TWAS methods, percent increase of models gets larger for smaller training sample size. In comparison to UTMOST, percent gain of models gets larger for larger training sample sizes.
Fig. 3
Fig. 3. Examples of well-imputed genes unique to PUMICE.
Panel (a) displays prediction performance of REXO4 gene in CMC cohort. Panel (b) shows prediction performance of CASKIN2 gene in GEUVADIS cohort. Panel (c) shows prediction performance of PELO gene in DGN cohort. We show the selected window (w) and penalty factor (ϕ) associated with each PUMICE’s prediction model. Error bands represent 95% confidence intervals.
Fig. 4
Fig. 4. Characteristics of GTEx gene expression prediction models.
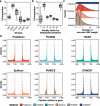
In panel (a), we illustrate the proportions of different window sizes w among selected PUMICE models. Each boxplot is derived from the percent window composition of 48 GTEx tissues. In panel (b), we show the proportion of different values of tuning parameter ϕ among selected PUMICE models. ϕ is the tuning parameter that reduces the L1 and L2 penalties for essential predictors that overlap with ENCODE annotations. Each boxplot is derived from the percent penalty factor composition of 48 GTEx tissues. Minima and maxima values (excluding outliers) are represented by the lower- and upper-bound of the whiskers. Median value is represented by the bolded line in the middle. First and third quartiles are represented by the lower- and upper-bound of the box. In panel (c), we show the distribution of the number of SNPs with non-zero weights in gene expression prediction models across different TWAS methods. Vertical line represents median number of SNPs with non-zero weights. PUMICE models have the lowest median number of SNPs with non-zero weights (n = 13), while UTMOST models have the highest median number of SNPs with non-zero weights (n = 73). In panels (d), we plot the distribution of the locations of SNPs with non-zero weights (for PrediXcan, EpiXcan, PUMICE, and UTMOST) or top 100 SNPs with highest weights (for FUSION and TIGAR). Variant counts are plotted against their locations relative to 5’ gene transcription start site (TSS) and 3’ gene transcription end site (TES) across different TWAS methods.
Fig. 5
Fig. 5. PUMICE+ identifies the largest number of gene x trait associations and novel associations across 48 GTEx tissues using GWAS summary-level statistics of 79 traits.
Panel (a) displays the total number of significant gene x trait associations by each method. Panel (b) shows the number of unique significant gene x trait associations. Gene x trait associations identified in multiple tissues are counted only once. Panel (c) shows the number of independent gene counts. Multiple significant genes within 1 Mb window are counted only once. Panel (d) shows the number of independent novel genes that are outside 1 Mb window on either side of GWAS sentinel variant. PUMICE+ identifies the highest number of gene x trait associations, unique gene count, independent gene count, and novel gene count in comparison to all other methods. Panel (e) displays the distribution of chi-square test statistics at MAGMA-prioritized genes. Median value is denoted in the parentheses. PUMICE+ achieved the largest median value of chi-square values (22.45). P-value is based on the comparison between PUMICE+ and other method using one-sided median test. *** denotes significant differences with p < 0.001. One-sided p-values are provided in the source data file. Each boxplot is derived from the chi-square values across 12,546 MAGMA-prioritized genes. Minima and maxima values (excluding outliers) are represented by the lower- and upper-bound of the whiskers. Median value is represented by the bold line in the middle. First and third quartiles are represented by the lower- and upper-bound of the box.
Fig. 6
Fig. 6. Computational drug repurposing predictions for drugs with known indications in 23 traits.
Panels (ac) illustrates the heatmap of CMap scores derived from different TWAS methods for (a) immune-related traits, (b) COVID-19 traits, and (c) other traits. Due to the large number of trait-drug pairs, we only display text description of one for every three trait-drug pairs in the plot. Numbers in the parentheses are the indices of the displayed trait-drug pairs in the full list (Supplementary Data 16). Panel (d) displays the distribution of CMap scores across 23 traits. Median value is denoted in the parentheses. PUMICE+ achieves the most negative median value of CMap score (−77.99), which shows that it identifies putative target genes that are most consistent with target genes of approved drugs. P-values are based on the comparison between PUMICE+ and other methods using one-sided median test. The label “ns” denotes not significant; * denotes significance at p < 0.05; ** denotes significance at p < 0.01; *** denotes significance at p < 0.001. One-sided P-values are provided in the source data file. Minima and maxima values (excluding outliers) are represented by the lower- and upper-bound of the whiskers. Median value is represented by the bold line in the middle. First and third quartiles are represented by the lower- and upper-bound of the box. Trait abbreviations: ad = Alzheimer’s disease; ast = asthma; bip = bipolar disorder; cad = coronary artery disease; cd = Crohn’s disease; ecz = atopic dermatitis; epl = epilepsy; ibd = inflammatory bowel disease; ldl = low-density lipoprotein level; mi = myocardial infarction; ra = rheumatoid arthritis; scz = schizophrenia; t2d = type 2 diabetes; uc = ulcerative colitis; vit = vitiligo.
Fig. 7
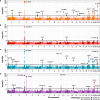
Fig. 7. TWAS Manhattan plot for COVID-19-related outcomes via PUMICE+.
ad illustrates the Manhattan plot for (a) COVID-A2, (b) COVID-B1, (c) COVID-B2, and (d) COVID-C2. Black horizontal line marks the genome-wide significance threshold at 2.5×10⁶ (Bonferroni threshold corrected for 20,000 genes). The most significant genes at each phenotype-locus pair are labelled. Two-sided P value associated with each gene is calculated according to the TWAS Z-score for gene-based association test.

Similar articles

Cited by

References

    1. Hamid J. S. et al. Data integration in genetics and genomics: methods and challenges. Hum. Genomics Proteomics2009, 869093 (2009). - PMC - PubMed
    1. Lonsdale J, et al. The Genotype-Tissue Expression (GTEx) project. Nat. Genet. 2013;45:580–585. doi: 10.1038/ng.2653. - DOI - PMC - PubMed
    1. Battle A, et al. Characterizing the genetic basis of transcriptome diversity through RNA-sequencing of 922 individuals. Genome Res. 2014;24:14–24. doi: 10.1101/gr.155192.113. - DOI - PMC - PubMed
    1. Fromer M, et al. Gene expression elucidates functional impact of polygenic risk for schizophrenia. Nat. Neurosci. 2016;19:1442–1453. doi: 10.1038/nn.4399. - DOI - PMC - PubMed
    1. Lappalainen T, et al. Transcriptome and genome sequencing uncovers functional variation in humans. Nature. 2013;501:506–511. doi: 10.1038/nature12531. - DOI - PMC - PubMed

Publication types