. 2022 Jun 7;8(1):45.
doi: 10.1038/s41522-022-00307-x.

Nisin probiotic prevents inflammatory bone loss while promoting reparative proliferation and a healthy microbiome

Affiliations

Nisin probiotic prevents inflammatory bone loss while promoting reparative proliferation and a healthy microbiome

Li Gao et al. NPJ Biofilms Microbiomes. .

Abstract

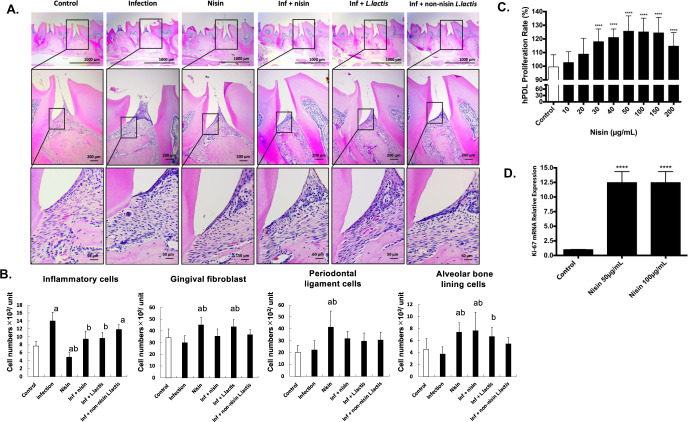
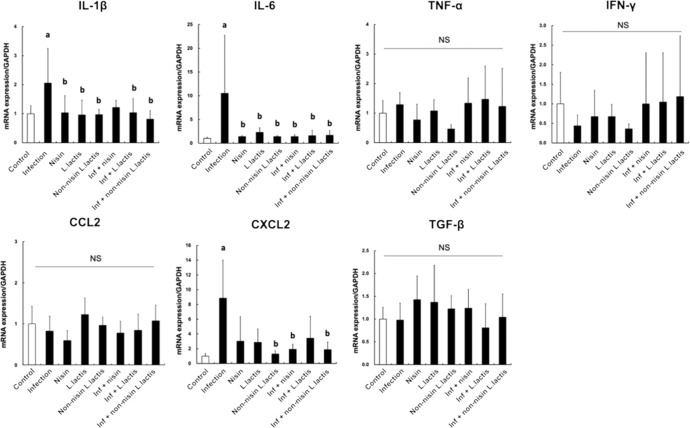
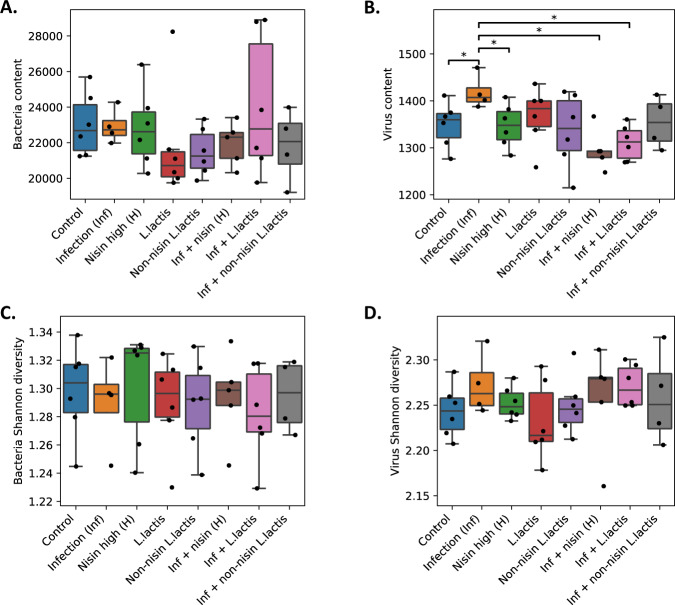
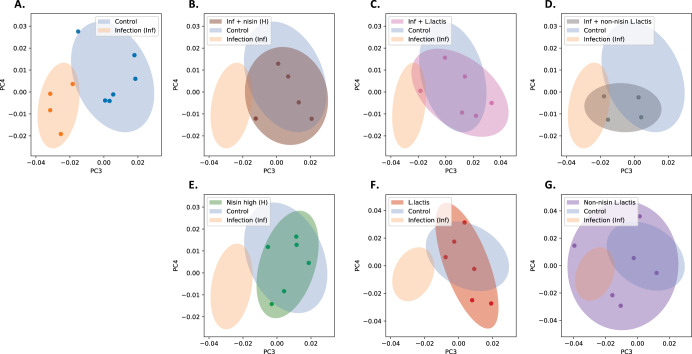
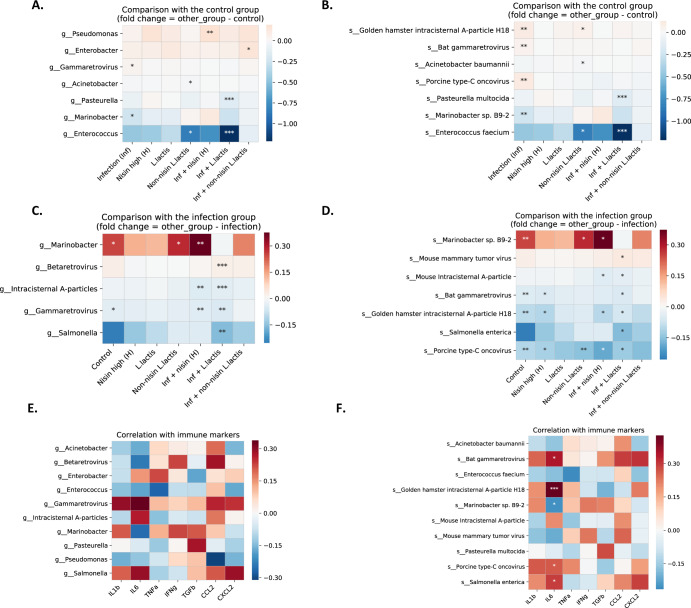
Dysbiosis of the oral microbiome mediates chronic periodontal disease. Realignment of microbial dysbiosis towards health may prevent disease. Treatment with antibiotics and probiotics can modulate the microbial, immunological, and clinical landscape of periodontal disease with some success. Antibacterial peptides or bacteriocins, such as nisin, and a nisin-producing probiotic, Lactococcus lactis, have not been examined in this context, yet warrant examination because of their biomedical benefits in eradicating biofilms and pathogenic bacteria, modulating immune mechanisms, and their safety profile in humans. This study's goal was to examine the potential for nisin and a nisin-producing probiotic to abrogate periodontal bone loss, the host inflammatory response, and changes in oral microbiome composition in a polymicrobial mouse model of periodontal disease. Nisin and a nisin-producing Lactococcus lactis probiotic significantly decreased the levels of several periodontal pathogens, alveolar bone loss, and the oral and systemic inflammatory host response. Surprisingly, nisin and/or the nisin-producing L. lactis probiotic enhanced the population of fibroblasts and osteoblasts despite the polymicrobial infection. Nisin mediated human periodontal ligament cell proliferation dose-dependently by increasing the proliferation marker, Ki-67. Nisin and probiotic treatment significantly shifted the oral microbiome towards the healthy control state; health was associated with Proteobacteria, whereas 3 retroviruses were associated with disease. Disease-associated microbial species were correlated with IL-6 levels. Nisin or nisin-producing probiotic's ability to shift the oral microbiome towards health, mitigate periodontal destruction and the host immune response, and promote a novel proliferative phenotype in reparative connective tissue cells, addresses key aspects of the pathogenesis of periodontal disease and reveals a new biomedical application for nisin in treatment of periodontitis and reparative medicine.


Conflict of interest statement

The authors declare no competing interests. The authors M.R.S. and M.J.Z. have an affiliation with Oralome, Inc.

Figures

Fig. 1
Fig. 1. Mouse treatment procedure and oral sample collection timeline.
The schematic diagram of the experimental design is shown in A and the treatment protocol of each group is shown in B. Polymicrobial infections were carried out in the morning for 4 consecutive days once per week from the 3rd to the 10th week. Nisin and L. lactis were administered every day in the evening from the 3rd to the 10th week. Oral swab samples were collected at 8 weeks following the initial infection. Blood and tissue specimen collection was performed at euthanasia following 8 weeks of infection.
Fig. 2
Fig. 2. Polymicrobial oral infection is reduced by nisin or nisin-producing probiotic treatment.
Oral swab samples were collected at 8 weeks after polymicrobial infection. DNA was isolated and purified from the swab samples of eight groups (Control, Infection, Nisin (H), L. lactis, Non-nisin L. lactis, Infection + nisin (H), Infection + L. lactis and Infection + Non-nisin L. lactis; n = 6 mice per group). The total bacteria were quantified by standard real-time PCR using primers corresponding to 16S ribosomal RNA. A The data are shown as a percentage of each pathogen (P. gingivalis, T. denticola, T. forsythia, or F. nucleatum) among total bacteria. Data represent the means ± standard deviation from six mice per group.Statistical significance was determined using an ANOVA followed by a Tukey’s test. The difference in variance with a p-value of <0.05 was considered significant. (a) The difference in percentage of the pathogen was significant (p < 0.001) compared to the Control group. (b) The difference in percentage of the pathogen was significant (p < 0.01) compared to the Infection group. *, the difference in percentage of the pathogen between the two groups was significant (p < 0.05). B The table demonstrates the number of detected bacteria and detection frequency (%) of periodontal pathogens in each swab from each mouse relative to the number of collected samples.
Fig. 3
Fig. 3. Alveolar bone loss is significantly abrogated with nisin or nisin-producing probiotic treatment.
A Representative images of alveolar bone loss on the palatal surfaces of maxillary molars in six groups (Control, Infection, Infection + nisin (L), Infection + nisin (H), Infection + L. lactis and Infection + Non-nisin L. lactis). Scale bar represents 0.2 mm. B The graph represents alveolar bone loss in all ten groups. Data represent the means ± standard deviation from six mice per group. For each mouse, alveolar bone loss was calculated as the average from 28 sites (3 sites on the first molar, 2 sites on the second molar, and 2 sites on the third molar, on both sides of the left maxilla and mandible). Statistical significance was determined using Student’s t-test between two independent groups. The difference in variance with a p-value of <0.05 was considered significant. (a) The difference in alveolar bone loss was significant (p < 0.05) compared to the Control group. (b) The difference in alveolar bone loss was significant (p < 0.05) compared to the Infection group. *, the difference in alveolar bone loss between the two groups was significant (p < 0.05). C The percentage of intrabony defects was calculated as the number of tooth surfaces containing periodontal intrabony defects out of total tooth surfaces. For each group, there were a total of 72 tooth surfaces (6 mice, 36 molars, 72 sides (buccal, palatal/lingual)). A chi-square test was used for analysis of the percentage of intrabony defects, the difference in variance with a p-value of <0.05 was considered significant. (a) The difference in the percentage of intrabony defect was significant (p < 0.05) compared to the Control group. (b) The difference in the percentage of intrabony defect was significant (p < 0.05) compared to the Infection group. (c) There was no significant difference in the percentage of intrabony defect between the Infection + L. lactis group and Infection + non-nisin L. lactis group (p > 0.05).
Fig. 4
Fig. 4. Host antibody response against periodontal pathogens is significantly abrogated with nisin or nisin-producing probiotic treatment.
Serum IgG antibody levels to P. gingivalis, T. denticola, T. forsythia, and F. nucleatum in all ten groups is shown. Data represent the means ± standard deviation from six mice per group. Statistical significance was determined using Student’s t-test between the two independent groups. The difference in variance with a p-value of <0.05 was considered significant. (a) The difference in serum IgG antibody levels was significant (p < 0.05) compared to the Control group. (b) The difference in serum IgG antibody levels was significant (p < 0.05) compared to the Infection group. *, the difference in serum IgG antibody levels between the two groups was significant (p < 0.05).
Fig. 5
Fig. 5. Nisin or nisin-producing probiotic prevent an influx of inflammatory cells into the periodontal complex, and promote increases in host reparative periodontal cells.
Histological examination of periodontal inflammation in the interproximal area between the first and second maxillary molars was performed in six groups (Control, Infection, nisin, Infection + nisin (H), Infection + L. lactis and Infection + Non-nisin L. lactis). A Representative histological images of morphologic changes within the periodontal tissues using HE staining of sagittal sections. B The bar graphs demonstrate the number of inflammatory cells and host periodontal cells per 1.0 mm2 of connective tissue in the maxillary specimens. In three tissue sections per mouse specimen, the number of inflammatory cells, gingival fibroblasts in connective tissues adjacent to the gingival epithelium, number of periodontal ligament cells, and alveolar bone lining cells were counted within a square field (100 × 100 μm) between first and second molars. Data represent the means ± standard deviation from three mice per group. Statistical significance was determined using an ANOVA followed by a Tukey’s test. The difference in variance with a p-value of <0.05 was considered significant. (a) Significantly different compared to the control group (p < 0.05); (b) significantly different compared to the infection group (p < 0.05). C Nisin treatment promoted human periodontal ligament cell proliferation (****p < 0.0001). D Nisin treatment promoted Ki-67 gene expression in human periodontal ligament cells (****p < 0.0001). Data represent the means ± standard deviation of three independent experiments. Statistical significance was determined using Student’s t-test between two independent groups. The difference in variance with a p-value of <0.05 was considered significant (C and D).
Fig. 6
Fig. 6. Nisin or nisin-producing probiotic abrogate the host inflammatory cytokine response in gingival tissues.
To evaluate the immune cytokine profiles in gingival tissues, mRNA expression of IL-1β, IL-6, TNF-α, IFN-γ, CCL2, CXCL2, and TGF-β1 were measured by real-time PCR. The amount of mRNA in each reaction was normalized to GAPDH, which is a housekeeping gene. Data are shown as means ± standard deviation from six mice per group. Statistical significance was determined using Student’s t-test between two independent groups. The difference in variance with a p-value of <0.05 was considered significant. (a) p < 0.05 compared with the Control group. (b) p < 0.05 compared with the Infection group.
Fig. 7
Fig. 7. Comparison of bacterial and viral content and diversity scores across groups show differences in viral content upon infection that shift back with nisin treatment.
The groups included Control, Infection, Nisin (H), L. lactis, Non-nisin L. lactis, Infection + Nisin (H), Infection + L. lactis, and Infection + Non-nisin L. lactis). A, B Bacterial and viral content in TPM and 95% confidence interval (CI) is shown across groups. In terms of bacterial content, there is no significant difference between groups. Statistical significance was determined using a two-sample t-test assuming equal variance of samples from the two groups. The difference in variance with a p-value of <0.05 was considered significant. *p < 0.05. In terms of viral content, the Infection group has significantly higher virus content than the Control group, Nisin group, Infection + Nisin (H) group, and Infection + L. lactis group. C, D Bacterial and viral Shannon diversity is shown for different groups. In terms of bacterial diversity, there is no significant difference between the groups. In terms of viral diversity, the Infection group has slightly higher but non-significant diversity than the Control and L. lactis groups. Data are presented as the box plots of six mice per group; the box shows the quartiles while the whiskers extend to show the rest of the distribution.
Fig. 8
Fig. 8. Principal coordinates analysis (PCoA) plots for microbiome composition of different groups showing nisin/ nisin-producing probiotic shift oral microbiome back toward healthy control levels following infection.
(Control, Infection, Nisin (H), L. lactis, Non-nisin L. lactis, Infection + Nisin (H), Infection + L. lactis, Infection + Non-nisin L. lactis). A PC3 and PC4 separate the Control group from the Infection group. BG Overlay each of the other groups on top of panel A, respectively. Among infected groups, those treated with nisin (panel B) and L. lactis (panel C) are similar to the Control group, while those treated with non-nisin L. lactis (panel D) is in the middle of the Control group and the Infection group. Among non-infected groups, those treated with nisin (panel E) and L. lactis (panel F) are similar to the Control group, while those treated with non-nisin L. lactis (panel G) have a very high variance, likely due to poorer sample quality.
Fig. 9
Fig. 9. Differential abundance analysis for bacteria and viruses across groups highlight bacterial and viral members that align with healthy controls or infection and correlate with cytokine levels.
The groups included Control, Infection, Nisin (H), L. Lactis, Non-nisin L. lactis, Infection + nisin (H), Infection + L. lactis, and Infection + Non-nisin L. lactis. A Comparison at genus level between the Control group and other groups. B Comparison at species level between the Control group and other groups. C Comparison at genus level between the Infection group and other groups. D Comparison at species level between the Infection group and other groups. The color gradient represents the fold-change against the reference group (A and B; Control group, and C and D; Infection group). Red color means positive fold-change, blue color means negative fold-change and white color means no change. The Pearson’s correlation was computed with a p-value based on t-test. Asterisks represent the significant level; ***FDR < 0.1, **FDR < 0.2, FDR* < 0.3. E and F A correlation of all significant microbes (genus and species significant in at least one comparison in Fig. 9) with immune cytokine levels were computed across all animals. E Correlation of significant genus members with immune cytokine levels. F Correlation of significant species members with immune cytokine levels. The Benjamini–Hochberg procedure was performed for multiple testing for each immune marker (across all microbial species) separately. The color gradient represents the type of correlation (red means positive, blue means negative and white means no correlation) and the asterisks represent the level of significance; ***FDR < 0.1, **FDR < 0.2, FDR* < 0.3.

Similar articles

Cited by

References

    1. WHO. Epidemiology, etiology, and prevention of periodontal diseases. Report of a WHO Scientific Group. World. Health. Organ. Tech. Rep. Ser. 621, 1–60 (1978). - PubMed
    1. Tatakis DN, Kumar PS. Etiology and pathogenesis of periodontal diseases. Dent. Clin. North. Am. 2005;49:491–516. doi: 10.1016/j.cden.2005.03.001. - DOI - PubMed
    1. Kim J, Amar S. Periodontal disease and systemic conditions: a bidirectional relationship. Odontology. 2006;94:10–21. doi: 10.1007/s10266-006-0060-6. - DOI - PMC - PubMed
    1. Kapila Y. Oral health’s inextricable connection to systemic health - special populations bring to bear multimodal relationships and factors connecting periodontal disease to systemic diseases and conditions. Periodontol. 2000. 2021;87:11–16. doi: 10.1111/prd.12398. - DOI - PMC - PubMed
    1. Linden GJ, Lyons A, Scannapieco FA. Periodontal systemic associations: review of the evidence. J. Periodontol. 2013;84:S8–S19. doi: 10.1902/jop.2013.1340010. - DOI - PubMed

Publication types