. 2022 Jun 7;12(1):9401.
doi: 10.1038/s41598-022-13223-z.

Network pharmacology and experimental verification based research into the effect and mechanism of Aucklandiae Radix-Amomi Fructus against gastric cancer

Affiliations

Network pharmacology and experimental verification based research into the effect and mechanism of Aucklandiae Radix-Amomi Fructus against gastric cancer

Siyuan Song et al. Sci Rep. .

Abstract

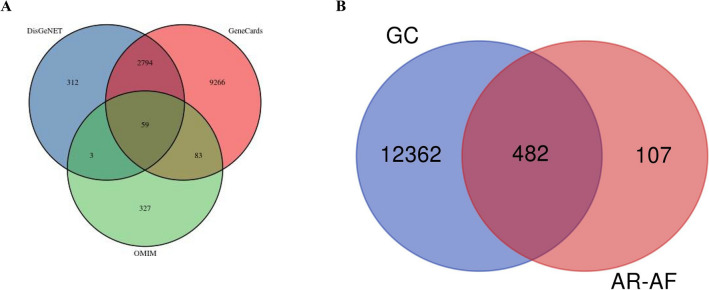
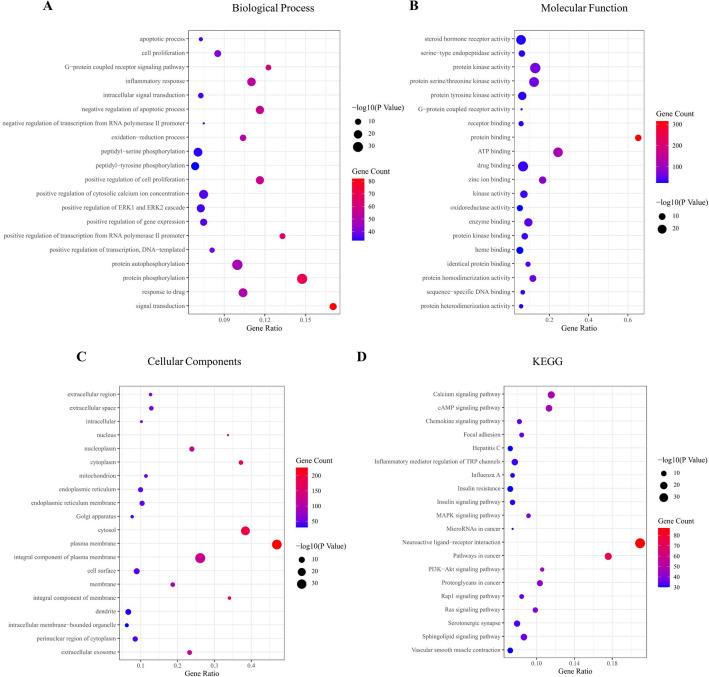
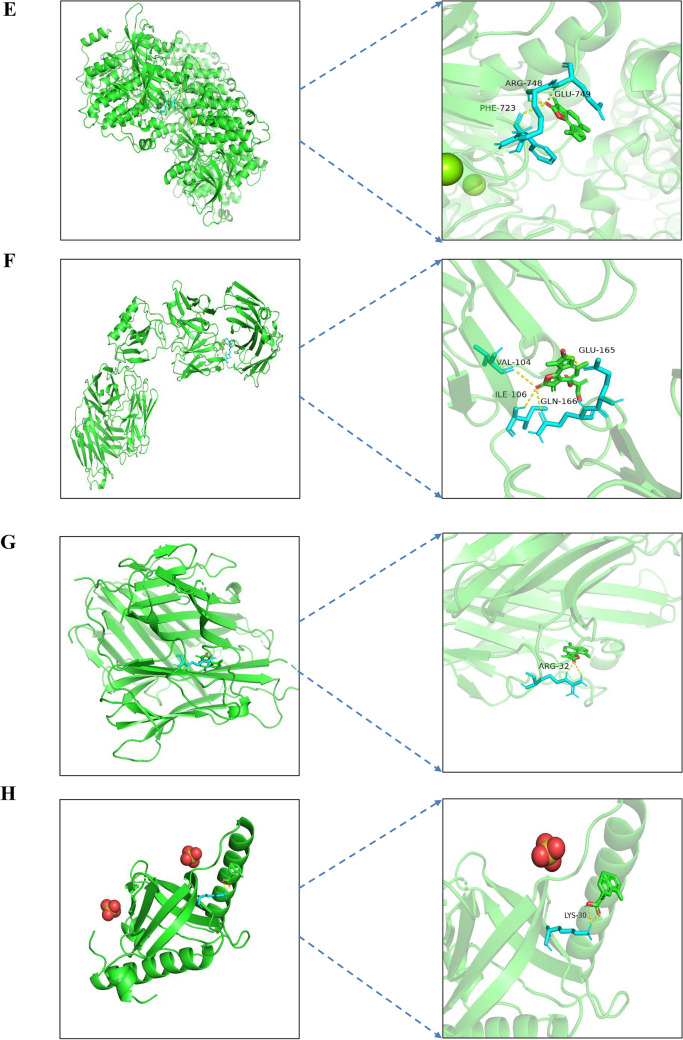
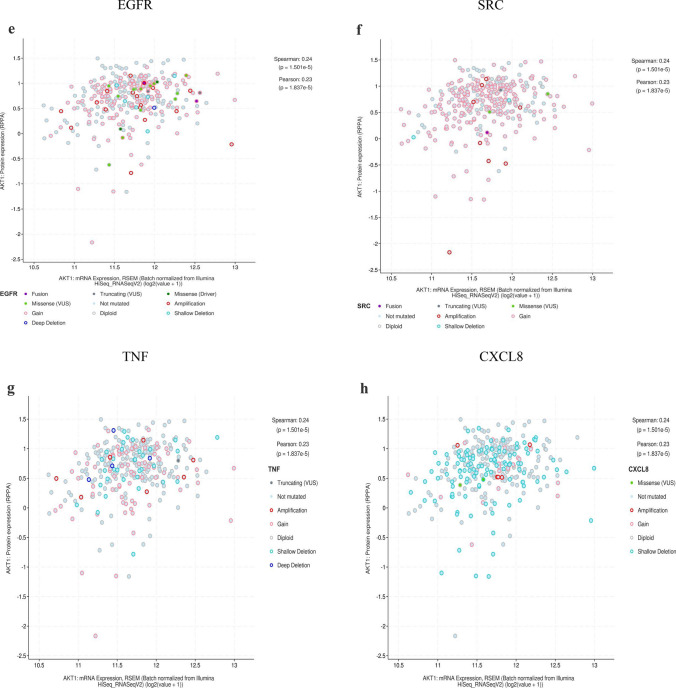
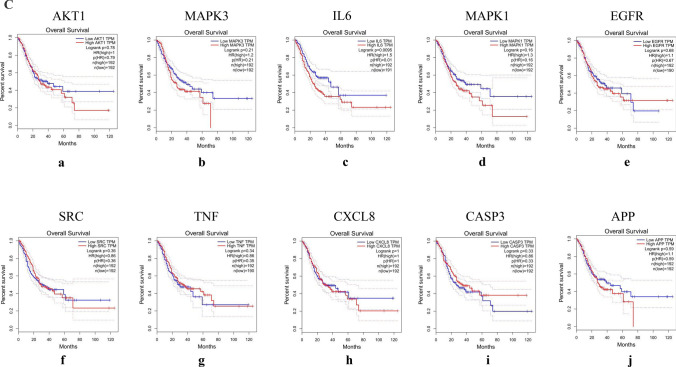
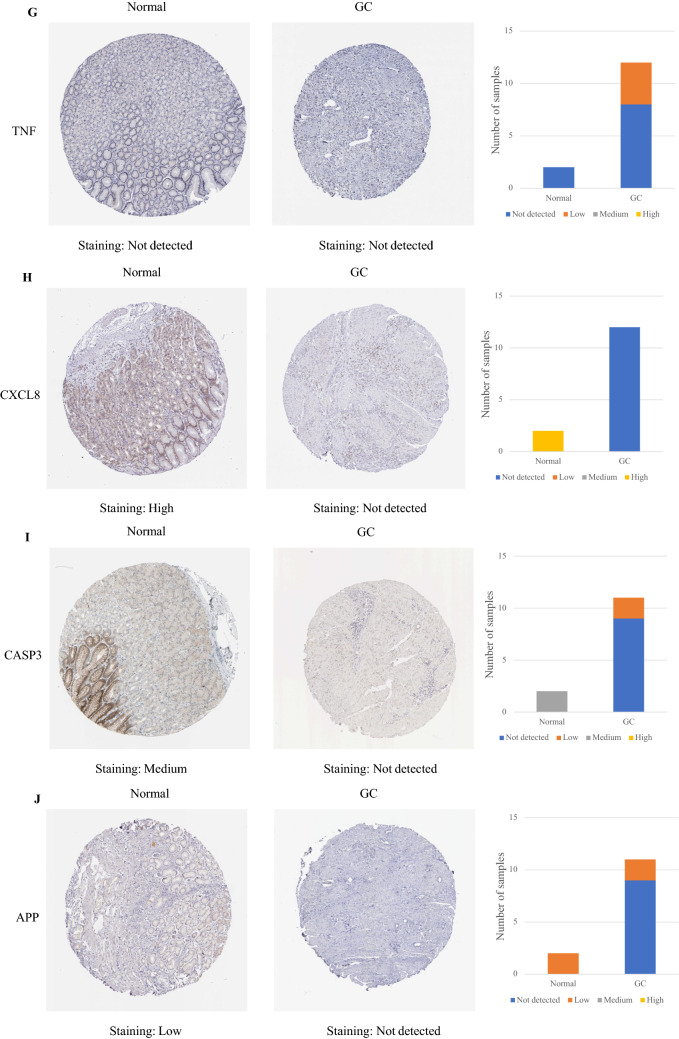
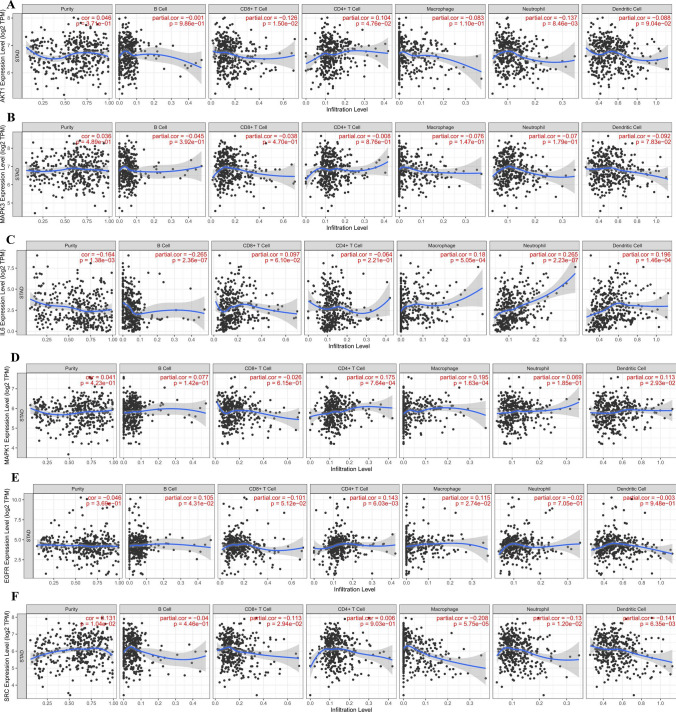
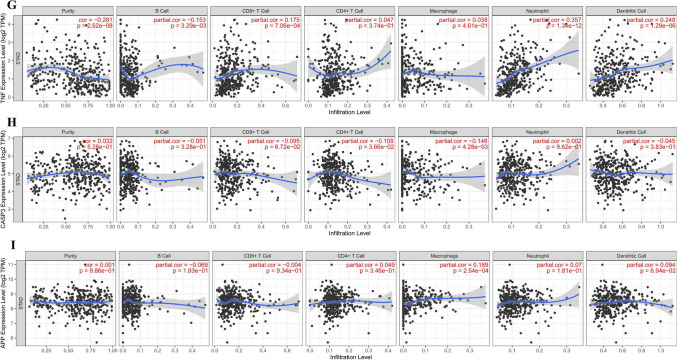
To investigate the mechanism of the Aucklandiae Radix-Amomi Fructus (AR-AF) herb pair in treating gastric cancer (GC) by using network pharmacology and experimental verification. Using the traditional Chinese medicine system pharmacology database and analysis platform (TCMSP), the major active components and their corresponding targets were estimated and screened out. Using Cytoscape 3.7.2 software, a visual network was established using the active components of AR-AF and the targets of GC. Based on STRING online database, the protein interaction network of vital targets was built and analyzed. With the Database for Annotation, Visualization, and Integrated Discovery (DAVID) server, the gene ontology (GO) biological processes and the Kyoto Encyclopedia of Genes and Genomes (KEGG) signaling pathways of the target enrichment were performed. AutoDock Vina was used to perform molecular docking and calculate the binding affinity. The mRNA and protein expression levels of the hub targets were analyzed by the Oncomine, GEPIA, HPA databases and TIMER online tool, and the predicted targets were verified by qRT-PCR in vitro. Eremanthin, cynaropicrin, and aceteugenol were identified as vital active compounds, and AKT1, MAPK3, IL6, MAPK1, as well as EGFR were considered as the major targets. These targets exerted therapeutic effects on GC by regulating the cAMP signaling pathway, and PI3K-Akt signaling pathway. Molecular docking revealed that these active compounds and targets showed good binding interactions. The validation in different databases showed that most of the results were consistent with this paper. The experimental results confirmed that eremanthin could inhibit the proliferation of AGS by reducing the mRNA expression of hub targets. As predicted by network pharmacology and validated by the experimental results, AR-AF exerts antitumor effects through multiple components, targets, and pathways, thereby providing novel ideas and clues for the development of preparations and the treatment of GC.


Conflict of interest statement

The authors declare no competing interests.

Figures

Figure 1
Figure 1
The protocol of our study procedures.
Figure 2
Figure 2
Compound-target network. Orange circle nodes represent the main components of AR, and yellow circle nodes represent the main components of AF. Blue rhombus nodes represent the targets of AR-AF.
Figure 3
Figure 3
Venn diagram of target genes. (A) GC-related targets in different databases. (B) Venn diagram of AR-AF and GC targets.
Figure 4
Figure 4
The PPI network. Yellow diamonds represent the top 20 genes in all nodes with degree ≥ 83. Orange circles represent the genes with degree < 83. Node size and color were set to reflect the degree value. The greater the degree value is, the darker the color and the larger the node.
Figure 5
Figure 5
Bubble diagram for GO and KEGG enrichment analysis. (A) Biological processes for the major targets. (B) Molecular function for the major targets. (C) Cellular components for the major targets. (D) Represents KEGG for the major targets. The bubble size represents the number of enriched genes, and the bubble color difference represents the significant magnitude of target gene enrichment.
Figure 6
Figure 6
Compound-target-pathway network. Red hexagonal nodes represent pathways, blue rectangle nodes represent targets, yellow circle nodes represent AR, and green circle nodes represent AF.
Figure 7
Figure 7
Heatmap of binding affinity. The bluer the color is, the more stable the binding force. AR10 stands for cynaropicrin, AR08 stands for 2- [(2r, 4ar, 8as)-4a-methyl-8-methyl-decalin-2-yl] acrylic acid, AR12 stands for eremanthin, and AR15 stands for aceteugenol.
Figure 8
Figure 8
Schematic diagram of docking between eremanthin and proteins. Molecular models of eremanthin binding to the predicted target proteins (A) 1UNQ, (B) 6GES, (C) 4O9H, (D) 6OPH, (E) 7JXP, (F) 6E6E, (G) 7KPA, (H) 6WZM, (I) 6X8K, and (J) 6ITU.
Figure 8
Figure 8
Schematic diagram of docking between eremanthin and proteins. Molecular models of eremanthin binding to the predicted target proteins (A) 1UNQ, (B) 6GES, (C) 4O9H, (D) 6OPH, (E) 7JXP, (F) 6E6E, (G) 7KPA, (H) 6WZM, (I) 6X8K, and (J) 6ITU.
Figure 8
Figure 8
Schematic diagram of docking between eremanthin and proteins. Molecular models of eremanthin binding to the predicted target proteins (A) 1UNQ, (B) 6GES, (C) 4O9H, (D) 6OPH, (E) 7JXP, (F) 6E6E, (G) 7KPA, (H) 6WZM, (I) 6X8K, and (J) 6ITU.
Figure 9
Figure 9
mRNA expression levels of hub targets. The red box indicates the overexpression of the gene in tumor tissues, while the blue box indicates the downregulation of the targets. The intensity of expression is expressed in shades of color.
Figure 10
Figure 10
Genetic information of hub targets. (A) Data from TCGA of gastric adenocarcinoma showed that 124 of 434 patients (29%) had genetic mutations in these targets. (B) The diagram shows an overview of the genetic variation of the hub targets. (C) The diagram shows the correlation between the mRNA and protein levels of (a) AKT1, (b) MAPK3, (c) IL6, (d) MAPK1, (e) EGFR, (f) SRC, (g) TNF, (h) CXCL8, (i) CASP3, and (j) APP.
Figure 10
Figure 10
Genetic information of hub targets. (A) Data from TCGA of gastric adenocarcinoma showed that 124 of 434 patients (29%) had genetic mutations in these targets. (B) The diagram shows an overview of the genetic variation of the hub targets. (C) The diagram shows the correlation between the mRNA and protein levels of (a) AKT1, (b) MAPK3, (c) IL6, (d) MAPK1, (e) EGFR, (f) SRC, (g) TNF, (h) CXCL8, (i) CASP3, and (j) APP.
Figure 11
Figure 11
mRNA expression level, pathological stage, and OS of hub targets. (A) Box plots showing the mRNA expression levels of (a) AKT1, (b) MAPK3, (c) IL6, (d) MAPK1, (e) EGFR, (f) SRC, (g) TNF, (h) CXCL8, (i) CASP3, and (j) APP. Red represents tumor, gray represents normal. (B) The violin diagram shows the stage plot of mRNA expression level and pathological stage in the GEPIA database. (C) The line charts show the OS of hub targets. The survival curve comparing the patients with high (red) and low (blue) expression in GC.
Figure 11
Figure 11
mRNA expression level, pathological stage, and OS of hub targets. (A) Box plots showing the mRNA expression levels of (a) AKT1, (b) MAPK3, (c) IL6, (d) MAPK1, (e) EGFR, (f) SRC, (g) TNF, (h) CXCL8, (i) CASP3, and (j) APP. Red represents tumor, gray represents normal. (B) The violin diagram shows the stage plot of mRNA expression level and pathological stage in the GEPIA database. (C) The line charts show the OS of hub targets. The survival curve comparing the patients with high (red) and low (blue) expression in GC.
Figure 12
Figure 12
IHC of hub targets in the HPA. Representative immunohistochemistry images of (A) AKT1, (B) MAPK3, (C) IL6, (D) MAPK1, (E) EGFR, (F) SRC, (G) TNF, (H) CXCL8, (I) CASP3, and (J) APP in GC and noncancerous stomach tissues. The staining strengths were annotated as Not detected, Low, Medium, and High. The bar plots indicate the number of samples with different staining strengths.
Figure 12
Figure 12
IHC of hub targets in the HPA. Representative immunohistochemistry images of (A) AKT1, (B) MAPK3, (C) IL6, (D) MAPK1, (E) EGFR, (F) SRC, (G) TNF, (H) CXCL8, (I) CASP3, and (J) APP in GC and noncancerous stomach tissues. The staining strengths were annotated as Not detected, Low, Medium, and High. The bar plots indicate the number of samples with different staining strengths.
Figure 13
Figure 13
Immune cell infiltration of hub targets. Immune cell infiltration of (A) AKT1, (B) MAPK3, (C) IL6, (D) MAPK1, (E) EGFR, (F) SRC, (G) TNF, (H) CASP3, and (I) APP in the TIMER database.
Figure 13
Figure 13
Immune cell infiltration of hub targets. Immune cell infiltration of (A) AKT1, (B) MAPK3, (C) IL6, (D) MAPK1, (E) EGFR, (F) SRC, (G) TNF, (H) CASP3, and (I) APP in the TIMER database.
Figure 13
Figure 13
Immune cell infiltration of hub targets. Immune cell infiltration of (A) AKT1, (B) MAPK3, (C) IL6, (D) MAPK1, (E) EGFR, (F) SRC, (G) TNF, (H) CASP3, and (I) APP in the TIMER database.
Figure 14
Figure 14
Correlation analysis of hub targets and immune cell infiltration. Correlation analysis of immune cell infiltration and (A) AKT1, (B) MAPK3, (C) IL6, (D) MAPK1, (E) EGFR, (F) SRC, (G) TNF, (H) CASP3, and (I) APP in the TIMER database.
Figure 14
Figure 14
Correlation analysis of hub targets and immune cell infiltration. Correlation analysis of immune cell infiltration and (A) AKT1, (B) MAPK3, (C) IL6, (D) MAPK1, (E) EGFR, (F) SRC, (G) TNF, (H) CASP3, and (I) APP in the TIMER database.
Figure 15
Figure 15
The graph of eremanthin inhibiting AGS growth. (A–C) show the growth state of AGS cells in different groups after 24 h of dosing. (A) The IC50 of eremanthin on AGS cells was 25.07 μmol/L, (B) represents the control group, and (C) represents the eremanthin group.
Figure 16
Figure 16
Effect of eremanthin on AKT1, MAPK3, IL6, MAPK1, and EGFR mRNA expression. (A) Relative mRNA expression of AKT1, (B) relative mRNA expression of MAPK3, (C) relative mRNA expression of IL6, (D) relative mRNA expression of MAPK1, and (E) relative mRNA expression of EGFR (*P < 0.05, **P < 0.01, ***P < 0.001).

Similar articles

Cited by

References

    1. Serra O, Galan M, Ginesta MM, Calvo M, Sala N, Salazar R. Comparison and applicability of molecular classifications for gastric cancer. Cancer Treat. Rev. 2019;77:29–34. doi: 10.1016/j.ctrv.2019.05.005. - DOI - PubMed
    1. Feng RM, Zong YN, Cao SM, Xu RH. Current cancer situation in China: Good or bad news from the 2018 global cancer statistics? Cancer Commun. (Lond.) 2019;39(1):22. doi: 10.1186/s40880-019-0368-6. - DOI - PMC - PubMed
    1. Le X, Mu J, Peng W, Tang J, Xiang Q, Tian S, Feng Y, He S, Qiu Z, Ren G, et al. DNA methylation downregulated ZDHHC1 suppresses tumor growth by altering cellular metabolism and inducing oxidative/ER stress-mediated apoptosis and pyroptosis. Theranostics. 2020;10(21):9495–9511. doi: 10.7150/thno.45631. - DOI - PMC - PubMed
    1. Rollinger JM, Langer T, Stuppner H. Strategies for efficient lead structure discovery from natural products. Curr. Med. Chem. 2006;13(13):1491–1507. doi: 10.2174/092986706777442075. - DOI - PubMed
    1. Tutone M, Almerico AM. The in silico fischer lock-and-key model: The combined use of molecular descriptors and docking poses for the repurposing of old drugs. Methods Mol. Biol. 2020;2089:29–39. doi: 10.1007/978-1-0716-0163-1_2. - DOI - PubMed

Publication types

MeSH terms