

Identifying spatiotemporal patterns of COVID-19 transmissions and the drivers of the patterns in Toronto: a Bayesian hierarchical spatiotemporal modelling
- PMID: 35672355
- PMCID: PMC9172088
- DOI: 10.1038/s41598-022-13403-x
Identifying spatiotemporal patterns of COVID-19 transmissions and the drivers of the patterns in Toronto: a Bayesian hierarchical spatiotemporal modelling
Abstract
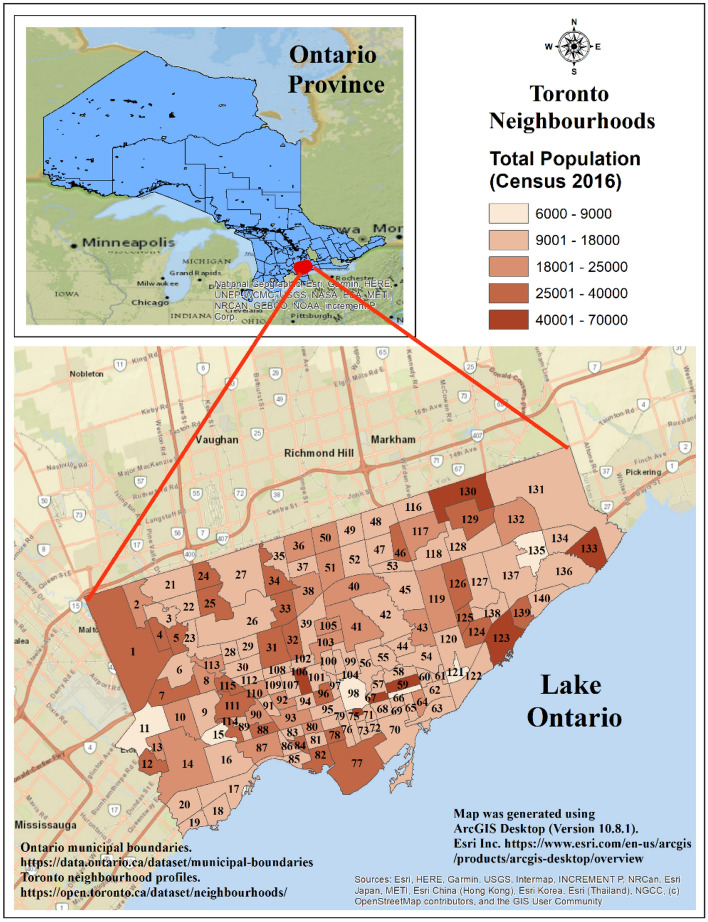
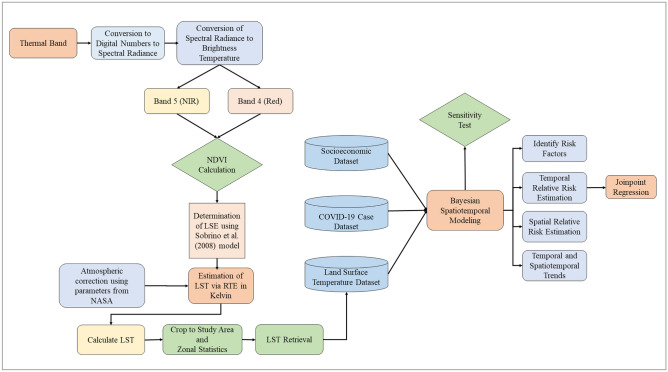
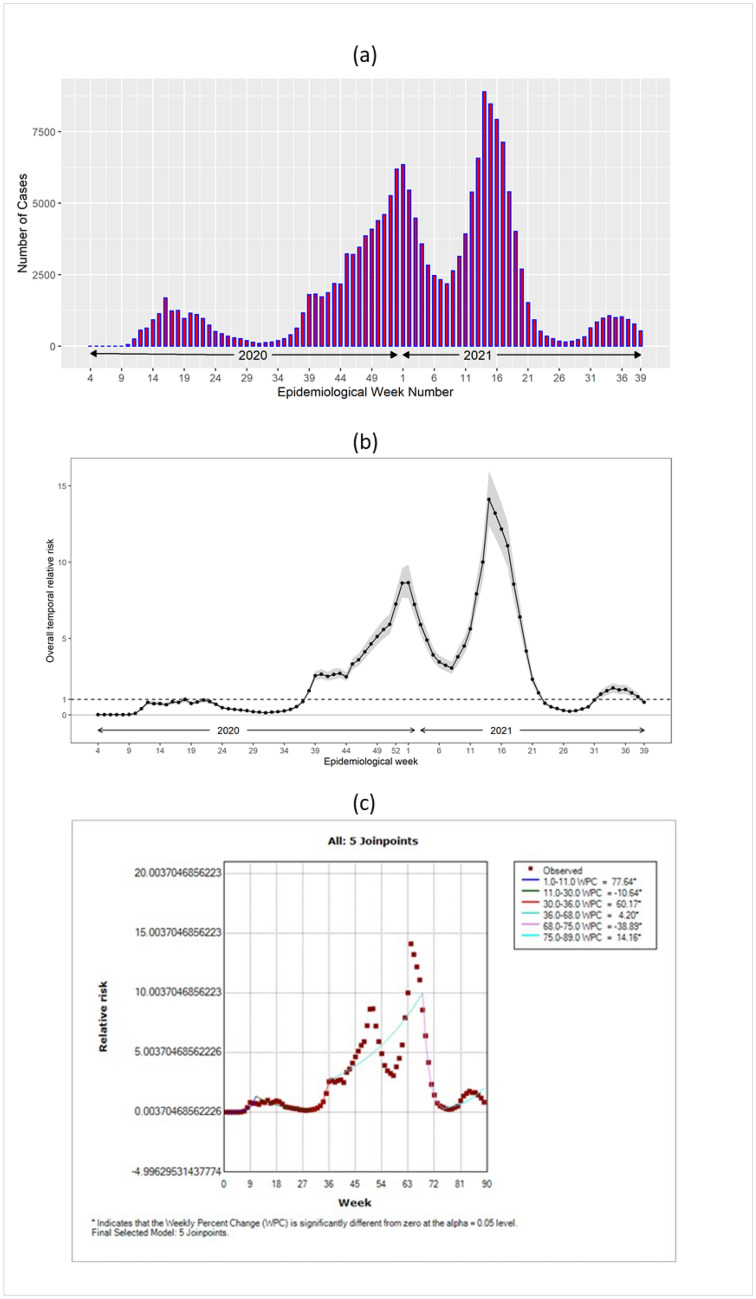
Spatiotemporal patterns and trends of COVID-19 at a local spatial scale using Bayesian approaches are hardly observed in literature. Also, studies rarely use satellite-derived long time-series data on the environment to predict COVID-19 risk at a spatial scale. In this study, we modelled the COVID-19 pandemic risk using a Bayesian hierarchical spatiotemporal model that incorporates satellite-derived remote sensing data on land surface temperature (LST) from January 2020 to October 2021 (89 weeks) and several socioeconomic covariates of the 140 neighbourhoods in Toronto. The spatial patterns of risk were heterogeneous in space with multiple high-risk neighbourhoods in Western and Southern Toronto. Higher risk was observed during Spring 2021. The spatiotemporal risk patterns identified 60% of neighbourhoods had a stable, 37% had an increasing, and 2% had a decreasing trend over the study period. LST was positively, and higher education was negatively associated with the COVID-19 incidence. We believe the use of Bayesian spatial modelling and the remote sensing technologies in this study provided a strong versatility and strengthened our analysis in identifying the spatial risk of COVID-19. The findings would help in prevention planning, and the framework of this study may be replicated in other highly transmissible infectious diseases.
© 2022. The Author(s).
Conflict of interest statement
The authors declare no competing interests.
Figures

References
-
- Interrelationship between daily COVID-19 cases and average temperature as well as relative humidity in Germany-PubMed. https://pubmed.ncbi.nlm.nih.gov/34050241/. Accessed 3 Jan 2022. - PMC - PubMed
MeSH terms
LinkOut - more resources
Full Text Sources
Medical
